

Background
MCC’s guiding objective and mission is “Poverty Reduction through Growth.” The approach that MCC takes to advance this objective, and its analytic foundations, were discussed at the first EAC meeting.[[See EAC Spring 2019 meeting notes here: https://www.mcc.gov/resources/doc/report-spring-2019-economic-advisory-council-meeting-notes.]] MCC economists and country counterparts undertake a growth diagnostic exercise—“Constraints Analysis”—that aims to identify the most binding constraints on economic growth for each compact. Based on this analysis, MCC identifies the underlying factors driving each binding constraint in a “Root Cause Analysis” (RCA). Based on the RCA, MCC outlines investment opportunities; this is the first time in the Compact process that specific project concepts begin to take shape. MCC then defines and designs projects that aim to address a root cause of a binding constraint to growth. Each project undergoes a rigorous cost benefit analysis (CBA) to ensure that the project’s returns are sufficiently high to meet MCC’s investment criteria.
MCC’s final pre-investment analysis is the Beneficiary Analysis (BA), undertaken after completing CBA modeling, or typically a year or two after the RCA stage. The BA is used to estimate the expected number and income gains of beneficiaries by income category for each project. These analyses are public and reported to Congress. The essential question for discussion by the EAC is: what additional analysis of benefits to households of proposed projects and their potential income/welfare gains can be undertaken earlier in our project cycle to help guide MCC’s investment priorities?
| Contraints Analysis (4-6 months) |
Root Cause Analysis (3 months) |
Cost Benefits Analysis (6-8 months) |
Beneficiary Analysis (two weeks) |
Current Practice
Beneficiary analysis as currently practiced in MCC is derived from project cost-benefit analysis, and hence is available only at the end of the project design cycle. Only projects with an economic rate of return (ERR) above a ten percent threshold are approved. In the course of CBA modeling, benefit flows to different agents (e.g., firms, households, central and local government) are identified and monetized. The distribution of these benefit streams across households by income level is also estimated, providing the basis for identifying the distributional impact of MCC project benefits. While the distributional impacts are identified, MCC does not assign explicit weights to different income categories. That is, there is no formal method of using the information to select among projects; instead, this depends on the context. A brief methodological discussion of BA and an example is provided in the Annex. This BA as described has been MCC’s practice since 2012.
The contribution of this analytic tool to MCC’s work and reporting is that it provides a shorthand estimate of the impacts (as guided by the CBA) of compact interventions on different kinds of households, consistent with the economic logic that drives project design. The measured estimate of the income impact on poor households links MCC’s investments to the objective of poverty reduction. The beneficiary numbers (benefits in dollar terms, and beneficiary counts) are reported at the end of compact design, and are updated if and when there are significant changes in program design, or when updated cost and benefit information would trigger a revision of the underlying CBA model.[[Rules for counting beneficiaries are by necessity somewhat arbitrary, which can result in counterintuitive results. According to the current MCC BA guidelines, if a person who interacts with an MCC project experiences an increase in income as a result, everyone in the household of which they are a member is considered a beneficiary. This definition has the unintended consequence of making counts of female beneficiaries largely uninformative.]]
The Challenge
The main limitation of MCC’s current beneficiary analysis practice is that it is not available early enough to help select sectors of engagement, or weigh alternative interventions and their design. MCC does undertake early analysis of social, poverty and gender characteristics of each country, but there is limited direct evidence brought to bear on how proposed interventions are likely to impact poverty or gender and social outcomes. Interventions are selected principally to address the constraints to private investment and economic opportunity, as distinct from their expected impact on poverty or gender equity.
These aims – boosting growth and reducing poverty – go hand in hand. But of course growth is not uniform -- across sectors, technologies, or market structures the impact of growth on corporate profitability, public revenue generation, or inter- and intra-household incomes, varies significantly. Expanding supply of low-cost electricity to households and small enterprises, for example, is more likely to help labor-intensive firms and generate direct income opportunities for low income households. De-risking investment in capital intensive sectors may have less direct impact on household incomes. In general, growth that yields significant employment generation (especially low skilled) or that has a large effect on individuals operating in the informal sector will have a deeper direct impact on reducing poverty in low-income countries, where the poor tend to be dependent on income from low-skilled employment.
The challenge for MCC is to mobilize evidence on both the expected impact on growth as well as on the expected impact on poverty reduction in a way that can help guide early investment decisions. This may involve identifying high-growth projects likely to meet the ERR hurdle rate, against potentially lower-growth return projects with benefits that may be better targeted to the poor.[[The notion of an equity-efficiency tradeoff is well enshrined in neoclassical economics. But this has been challenged in recent economic literature -- Ravallion [citation forthcoming], and Ostry, Loungani, and Berg, “Confronting Inequality” 2019.]] Ideally, selected interventions will both generate sustainable high returns and will align well with the objective of poverty reduction.
There are numerous economic tools that could conceivably be brought to bear on this analytic question. We can note here a few that may be promising, while stressing that there may be others equally or more useful:
- General equilibrium models. CGE models hold out the promise of capturing complex economic interactions and ‘systems thinking’ design relationships through labor markets and asset values to impact on household incomes using stylized household profiles. IFPRI and MCC are considering a collaboration to build general equilibrium “LEWIE” (Local Economy-Wide Impact Evaluation) models from household level data designed to understand the full impact of policies like cash transfers, input and output price supports for agriculture, and other agricultural and non-agricultural policies on local economies, including on the production activities of both target and non-target groups; how these effects change when programs are scaled up to larger regions; and why these effects happen. The models, however, can be costly to build, are demanding to parameterize (often requiring considerable guesswork), might not add much value, if first order effects (that could be captured with a simpler partial equilibrium model) dominate second order ones, and may be challenging to communicate.
- Jobs diagnostics. The World Bank has developed the approach of jobs diagnostics to identify employment challenges facing a country, distinguishing between constraints on labor supply side, on labor demand by firms, and in the intermediation of labor demand and supply. Inclusivity is a key focus of the approach, since the analysis is directed at ensuring access to good jobs for the poor and other vulnerable groups. Jobs diagnostics focus on the implications for employment and job quality of structural economic change from lower to higher productivity sectors, as well as on productivity improvements within sectors. It uses a range of other tools, including regression analysis of household or labor supply data and firm data. While not a focused diagnostic in the manner of the growth diagnostic tree—jobs diagnostics are less systematic and broader in focus—distributional conclusions follow more directly out of jobs diagnostics.
- CEQ fiscal incidence analysis. This approach to modeling incidence of expenditures and revenue mobilization across a country’s fiscal landscape could be valuable to a deeper understanding of MCC interventions that touch fiscal space. Public services (tariff regulations), tax policy, intergovernmental transfers can all be relevant to compact development. Several MCC countries already have CEQ models built. But a CEQ analysis captures *average* incidence at a moment in time and may be difficult to construct in order to capture geographical incidence or to accurately depict marginal changes in incidence. (Existing consumers of a service may be significantly wealthier, on average, than the marginal consumer, the target of the MCC intervention).
Questions for the EAC to help MCC Practice
Which of these approaches would be valuable to use for guiding MCC’s investment decisions, or are there other tools and approaches to recommend? The answer should take into account concerns regarding (i) the timing of information available to conduct the analysis, and (ii) MCC’s desire to better bring poverty impact and equity analysis into its investment decisions.
- What is the contribution of these tools to understand the poverty impact of MCC projects? How could the tool help MCC design projects that have high returns and high poverty impact? Is it likely to require significant additional resources needed to gather the data/carry out the analysis?
- Is the tool easily implemented in the brief window available (3-4 months) to carry out the root cause analysis?
- Are the results of the analysis easily interpreted and likely to be relevant to selecting project design options? Can they easily be explained to non-economists?
- Can the tool help to illuminate whether there is an equity-efficiency tradeoff in project design between net growth impact and poverty impact?
Annex: MCC Beneficiary Analysis approach
EA has internal guidance for BA, which includes guidelines for assumptions used in generating barcharts (described below) and counting beneficiaries.
MCC has adopted the absolute definition of extreme poverty used by the World Bank, currently defined as anyone earning less than $1.90/day in 2011 PPP terms. To lessen boundary issues our beneficiary analysis also explicitly includes the World Bank’s definition of “poor” (<$3.20/day) and “near poor” (<$5.50/day). Our “poverty scorecards” calculate a cost effectiveness ratio for each project/activity by income category, which takes the total benefits per MCC dollar spent from the ERRs calculated prior to the investment memo (IM) and allocates it (through various assumptions outlined in our “Beneficiary Analysis Guidelines”) to the four income categories: extreme poor, poor, near poor, and not poor.
We then compute the cost effectiveness ratio for each project in a compact and present these in a “barchart” so the poverty reducing impact can be compared across projects, along with the reference of an “income neutral” project having a 10% return (labeled “National Income Distribution” in the illustration below).
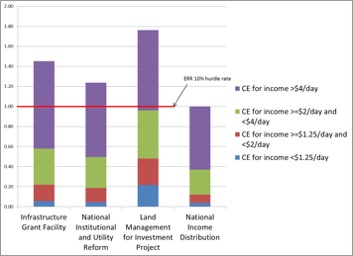
Displaying the results of the ERRs, distributed across income categories, has a tendency to spark discussion among country team members. The discussions include thoughts on improving the poverty impact of various projects and on key assumptions that go into ERRs that show a particularly troublesome outcome. The barchart is a useful attention-focusing device, allowing teams to hone in on assumptions that drive key results.
Furthermore, the barchart shows that distribution-neutral projects with very high returns can have a higher poverty-reducing impact than projects with lower returns that have been explicitly designed to target the poor. With the help of the barchart, teams can make an informed decision about whether the “pro poor” alternative has a greater expected impact on poverty than the (usually more inexpensive or more technically feasible) distribution-neutral alternative. In the example below, the “Delta Extension Irrigation” project (taking as given the various ERRs’ assumptions) is approximately distribution-neutral compared to the other projects, but arguably has a greater expected impact on poverty.
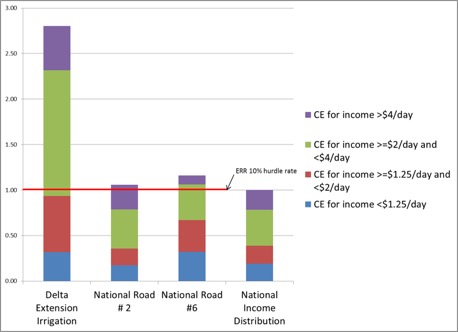
The barchart is a useful tool for facilitating country team discussion of the relative merits of different projects and for focusing attention on key assumptions made in the cost benefit analysis. However, the barchart can only be produced after the cost benefit analysis has at least been partially completed, too late in the compact development process to significantly affect any investment decisions.