Program Overview
MCC’s $238 million Liberia Compact (2016-2021) funded the $18 million Water Pipeline Sub-Activity, which was part of the Energy Project, to construct a raw water transmission pipeline to upgrade and replace the pre-war pipeline infrastructure. The sub-activity was based on the theory that the pipeline’s larger capacity, upstream inlet location, and gravity-fed design would increase the supply of raw water, protect against salt-water intrusion, and reduce electricity costs for the water utility. This would help meet the growing demand for water in Monrovia and improve the quality and consistency of water supplied to the utility’s service areas.
Evaluator Description
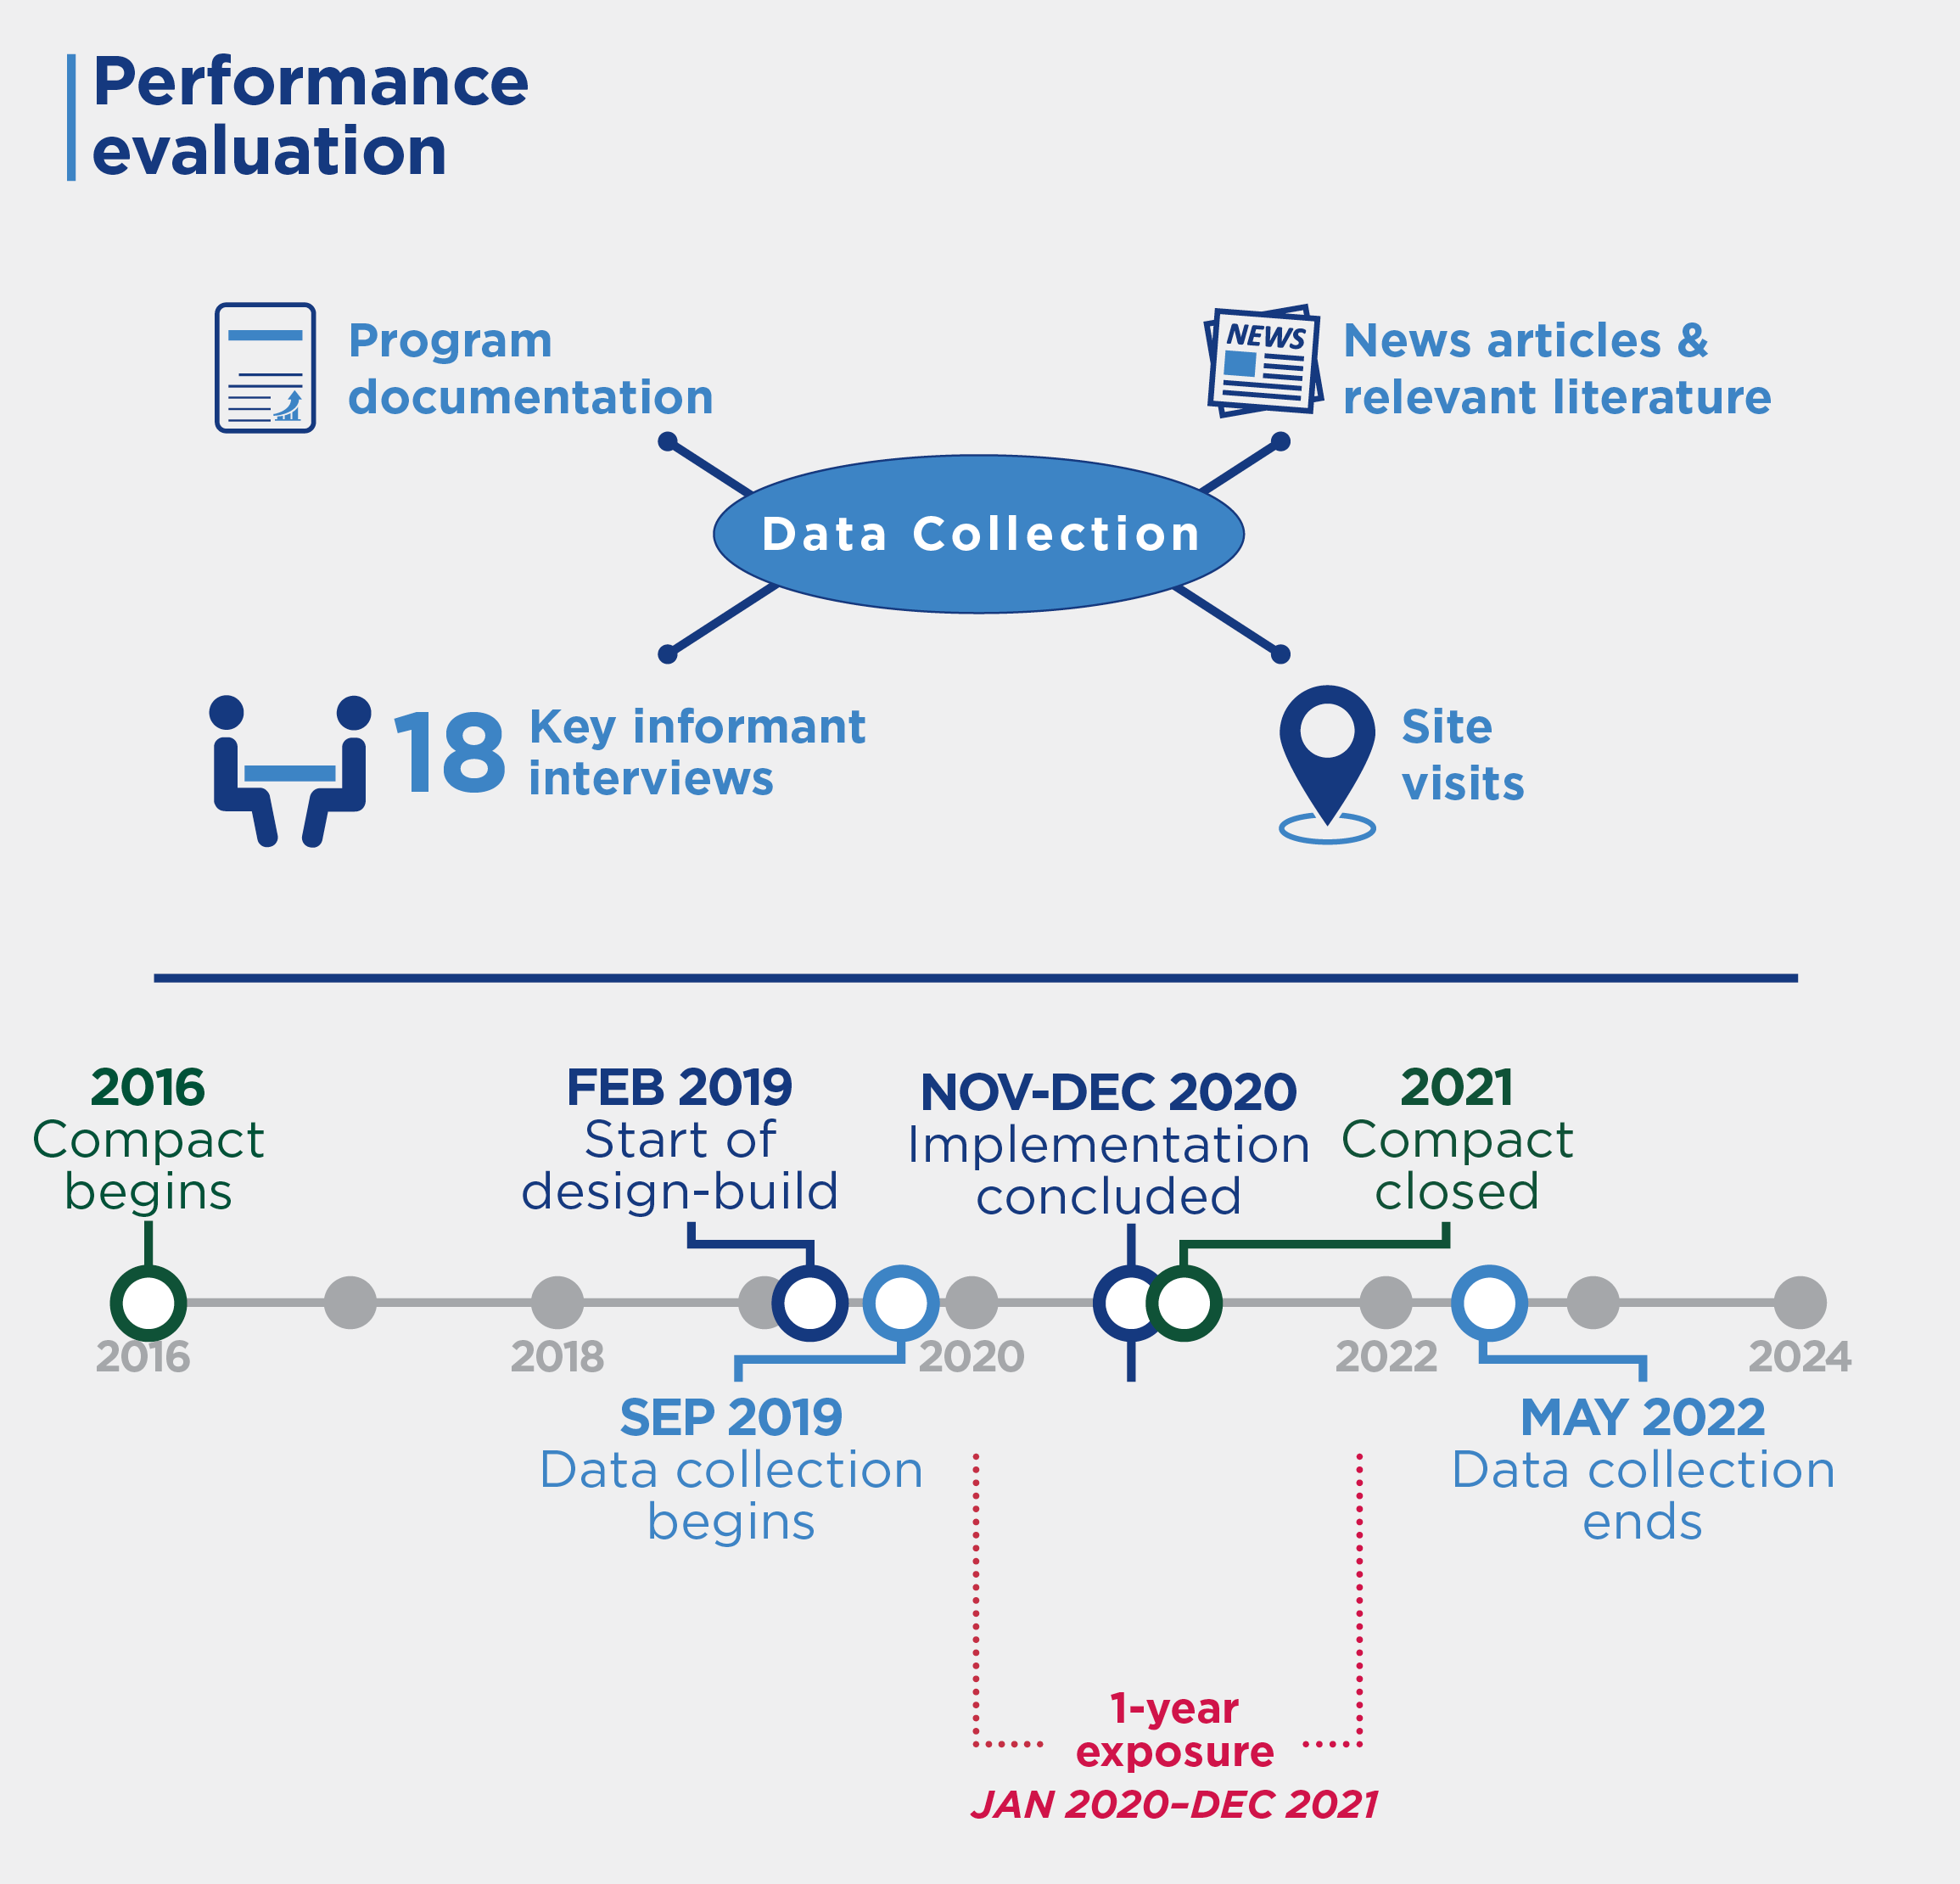
MCC commissioned Mathematica to conduct an independent final performance evaluation of the Liberia Water Pipeline Sub-activity. Full report results and learning: https://mcc.icpsr.umich.edu/evaluations/index.php/catalog/277.
Key Findings
Pipeline Implementation
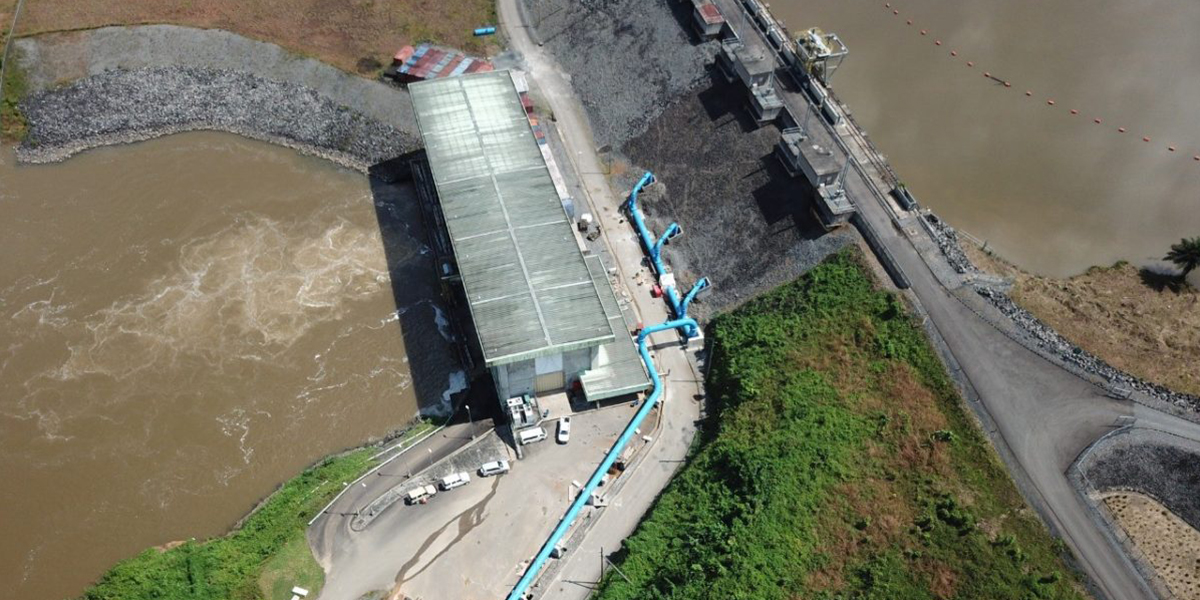
- The pipeline was successfully completed and has been transmitting raw water from the Mt. Coffee Hydropower Plant to the Liberia Water and Sewer Corporation’s (LWSC) water treatment plant since December 2020.
Water Supply Outcomes
- Overall, the pipeline did not improve the quantity or quality of the treated water supply.
- The pipeline increased the reliability of raw water flow, but not the supply of raw water because LWSC limits water intake due to resource constraints.
- In addition, the pipeline did not reduce raw water salinity or turbidity (clarity of the water).
- LWSC staff reported reduced electricity use and costs given the gravity-fed design replaced an expensive system that pumped the water.
Pipeline Maintenance
- LWSC is not conducting pipeline maintenance, risking long-term sustainability. LWSC staff said there was a shortage of spare parts and insufficient management support for maintenance.
Evaluation Questions
This final performance evaluation was designed to assess whether or not the pipeline:- 1 Implementation went according to plan?
- 2 Increased the supply, reliability, and quality of water?
- 3 Reduced electricity costs for the water utility?
- 4 Existing water network can it accommodate the increased supply?
- 5 Cost-benefit analysis met the MCC threshold rate of return?
- 6 Asset is being maintained?
Detailed Findings
Pipeline Implementation
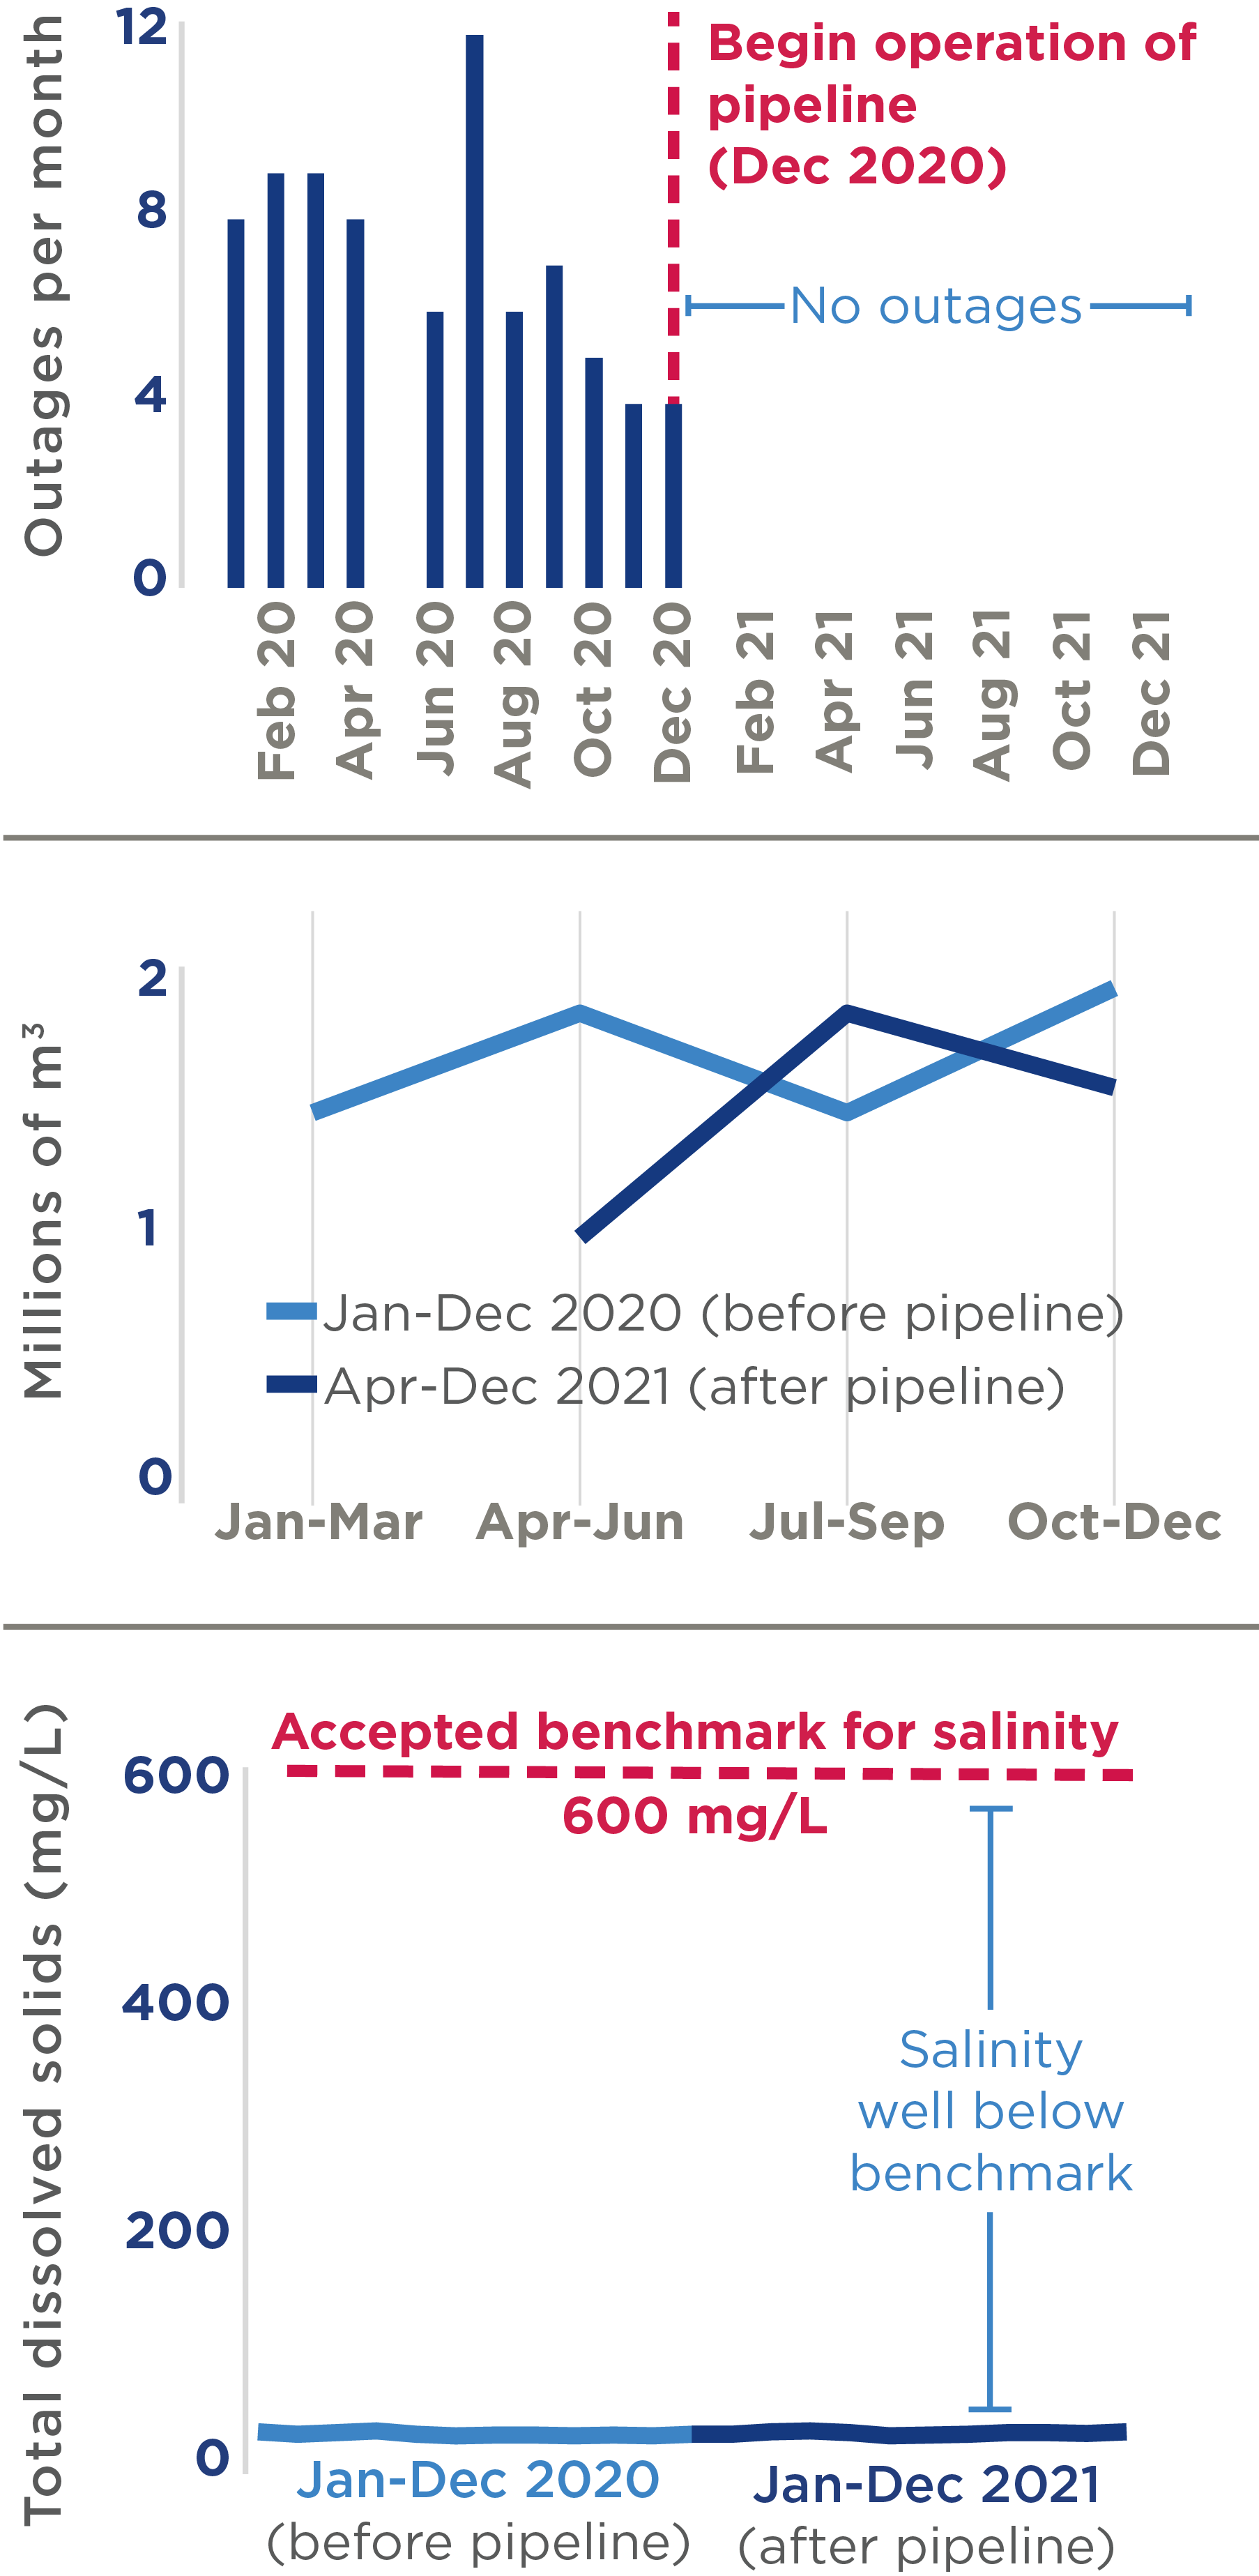
Reliability, quantity, and salinity of raw water supply, before and after the pipeline
Water Supply Outcomes
Despite having a larger capacity than the pre-existing system, the pipeline did not substantively increase raw water supply. This is because LWSC limits water intake due to resource constraints that restrict processing of additional raw water at the treatment plant. There were no changes observed in raw water salinity during the study period, and raw water turbidity increased after the pipeline due to rainy season storms and floods and pipeline maintenance issues. The pipeline improved the reliability of raw water supply, with the number of outages in water transmission falling from about seven per month to zero.The pipeline led to a reduction in electricity costs for LWSC (estimated at $780,000 in savings annually) as raw water is supplied to the treatment plant through gravitational flow.
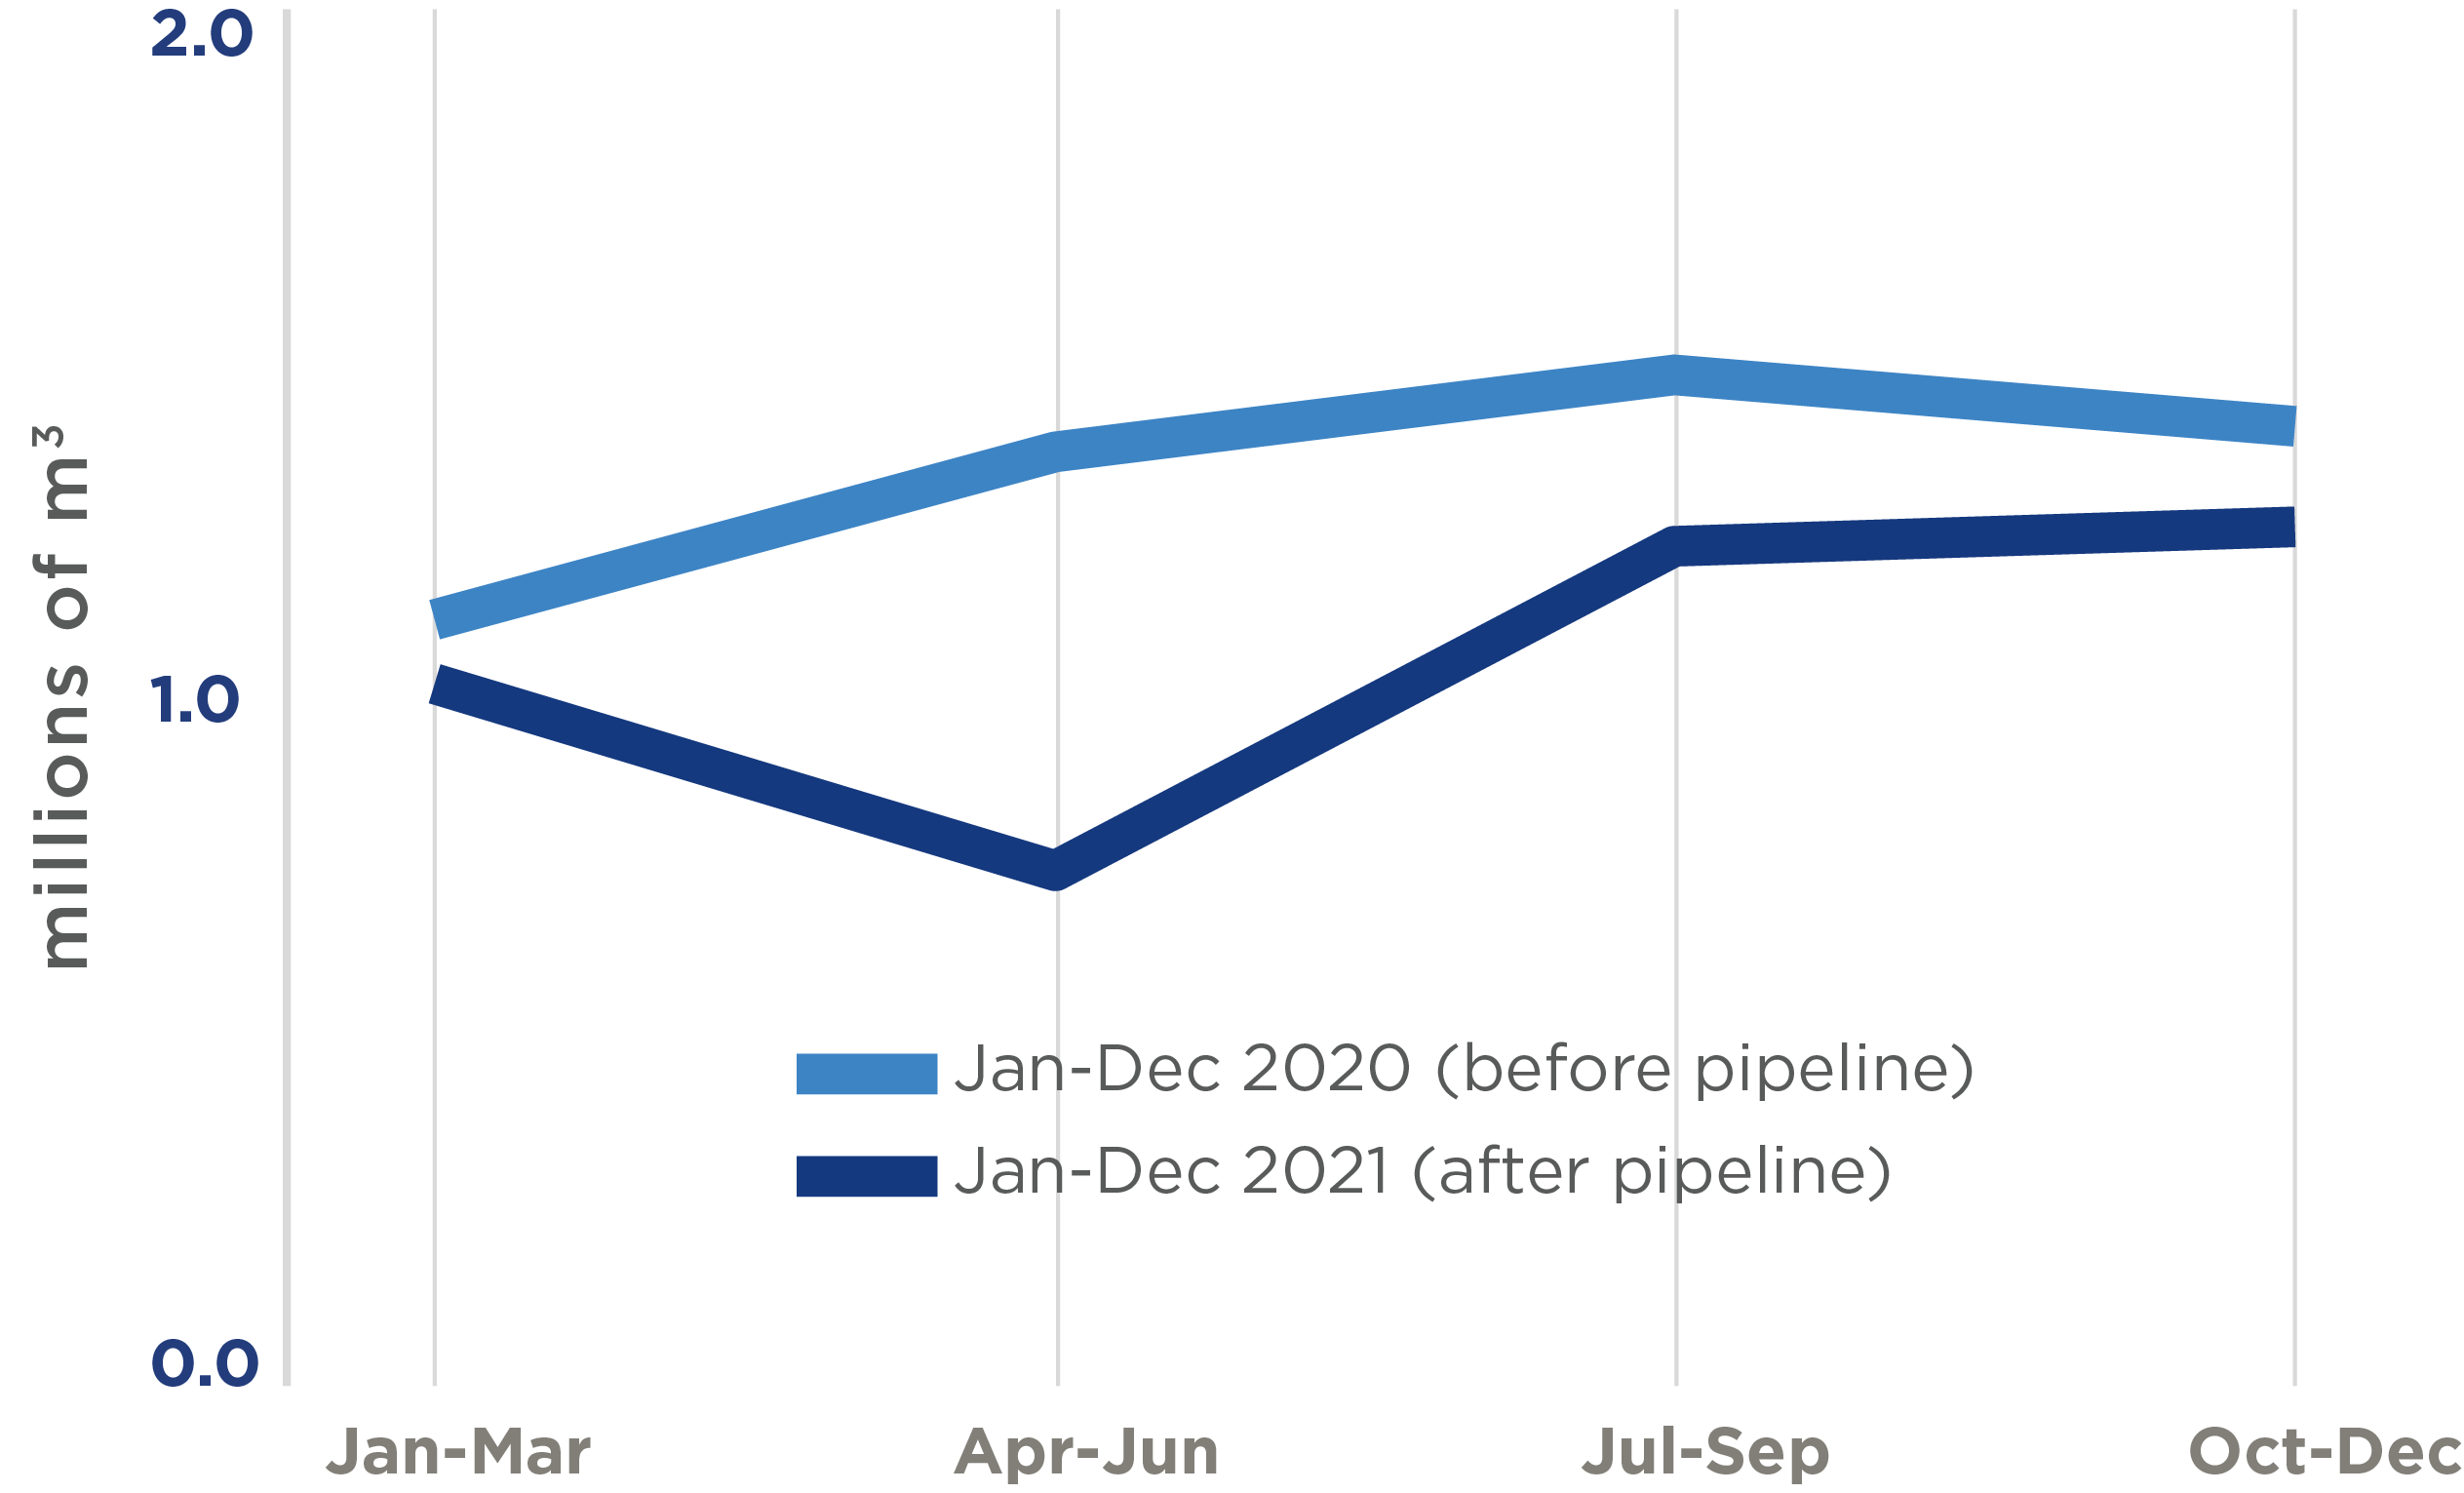
Production of treated water at the treatment plant, before and after the pipeline
Pipeline Maintenance
LWSC staff are not maintaining the pipeline system and have not conducted regular inspections, tests, and other maintenance activities as described in the operations and maintenance plan. Stakeholders report that the access road to the pipeline has overgrown vegetation, which impedes inspection of the pipeline and makes it challenging to conduct leak detection tests. Many sections of the pipeline’s perimeter fencing have been stolen for use as building material and the bridge component of the pipeline has been vandalized.Lack of support from LWSC’s senior management and financial constraints are the key impediments to implementing the operations and maintenance plan and procuring parts for repairs. This risks the sub-activity’s ability to sustain and achieve outcomes related to the quantity, quality, and reliability of water supply.
Economic Rate of Return
MCC considers a 10 percent economic rate of return (ERR) as the threshold to proceed with investment.- 17% Original ERR
- -18% Evaluation-Based ERR
MCC Learning
- Activities added late in the compact process should be carefully analyzed before moving forward with the works.
- The ex-ante cost-benefit analysis should be sequenced after the project due diligence is complete and be in alignment with both the findings from due diligence and the program logic.
- When programs are implemented in a situation where maintenance is unlikely, the program should be designed to withstand low levels of maintenance.
Evaluation Methods