

Program Overview
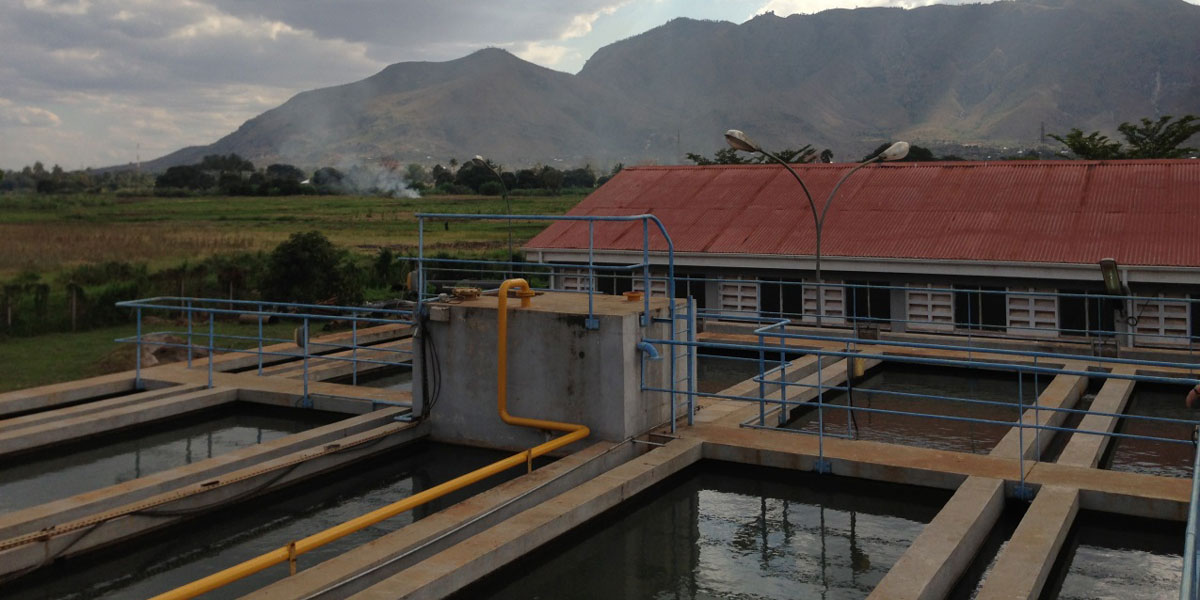
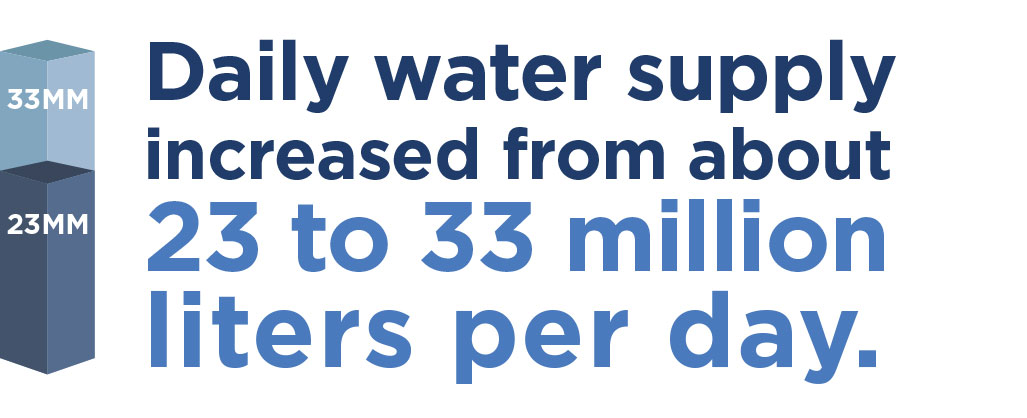
MCC’s $695 million Tanzania Compact (2008-2013) funded the $12 million Morogoro Water Supply Activity in Morogoro, which was part of the $54.6 million Water Sector Project (WSP). The objective of the project was to increase investment in human and physical capital and reduce the prevalence of water-related diseases. The activity aimed to increase production and quality of water by rehabilitating the Mafiga Treatment Plant and building a new treatment plant in Mambogo. The activity increased water supply from 23 to 33 million liters per day (MLD) in Morogoro.Evaluator Description
MCC commissioned Social Impact (SI) to conduct an independent impact evaluation of the Tanzania WSP. Final impacts are presented for the Morogoro Water Supply Activity. Full report results and learning: https://data.mcc.gov/evaluations/index.php/catalog/86.
Key Findings
Program Implementation
- Both plants were fully functional with no major maintenance issues at the time of data collection. The utility was managing pressure and supply to prioritize equity across its customer base. As of 2016, ongoing risks to sustainability included power fluctuations, growing demand, and insufficient revenues.
Supply, Reliability, Quality and Access
- Production volume at the water treatment plants met and exceeded Compact targets. The WSP was successful in increasing water supply and quality in Morogoro, despite some initial water quality issues at one of the plants that were resolved by the time of the midline dissemination.
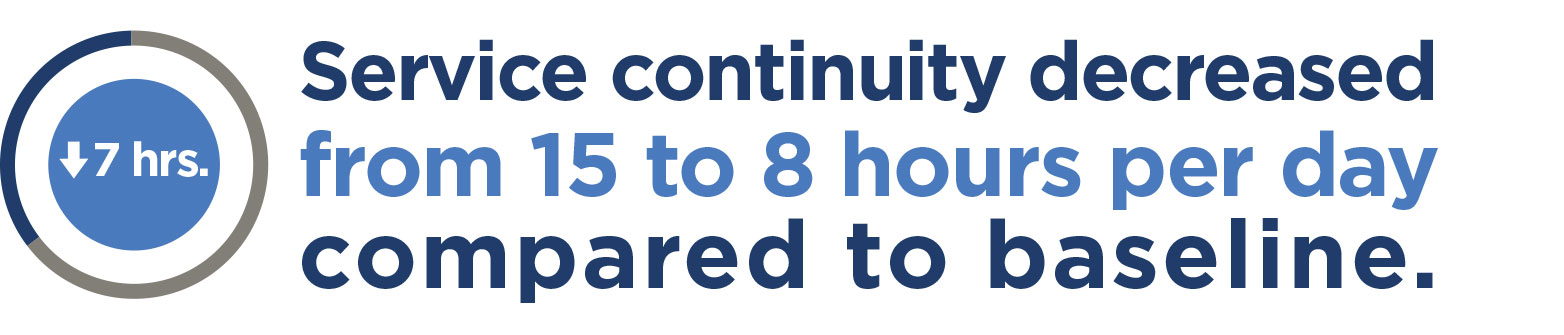
- Continuity of service, or the average daily hours of available water supply, decreased from about 15 to 8 hours per day, due to an increase in the customer base and the utility’s efforts to increase equity by reaching all customers for a shorter time each day.
- While only 41% of household tap samples were free of E. coli at the time of measurement in 2015, compliance was worse for non-piped sources (26%) and at household’s points of consumption (15%). This suggests that factors such as household water storage limit the impacts of system water quality improvements.
Household Impacts
- The evaluation found that supply improvements—for those that experienced them—were associated with increased water consumption and reduced time hauling water. However, since intermittency persisted, effects on investment in physical and human capital and water related diseases were unlikely to have been achieved during the study period.
Evaluation Questions
The final impact evaluation was designed to answer the following questions.- 1 Implementation: Was the MCC investment implemented according to plan? What challenges were encountered and how were they addressed?
- 2 Outputs & Outcomes: Did the project lead to improvements in supply, access to and availability of water, water quality, and water consumption patterns?
- 3 Objectives: Did the project impact human and physical investment and health (under five diarrheal illness)?
- 4 Goal: What was the project’s impact on poverty and income?
- 5 Cross-Cutting: How did the benefits differ by sub-groups? Did the project produce any unintended results? Was the project cost-effective?
- 6 Lessons Learned & Sustainability: What lessons were learned and what is the likelihood that results will be sustained?
Detailed Findings
Program Implementation
The intervention increased production volume and quality of piped water in Morogoro. At the time of the study, both plants were fully functional with no major maintenance issues. Ongoing challenges include power cuts that affect production and long-term reliability of equipment, and the need to accommodate growing demand. Additionally, Morogoro Urban Water Supply and Sewage Authority’s (MORUWASA) revenues are sufficient only to cover operations, not major improvements or maintenance.Supply, Reliability, Quality and Access
Supply
- The project achieved its aim of increasing water supply from about 23 to 33 MLD—from 19 to 27 MLD at Mafiga and 4 to 6 MLD at Mambogo.
- Despite system-wide water supply increases, the interventions may not have been sufficient to meet growing demand for water in Morogoro.
Reliability
- Despite production increases, service continuity decreased during the study period, from about 15 to 8 hours per day, because of increases in the customer base and the utility’s efforts to ensure more equitable access. The percent of customers with 24/7 access dropped from 28 percent in 2013 to 0 percent by 2015. This provided each service area with sufficient pressure to reach all customers for a shorter period of time each day.
Quality
- At the time of the study, the evaluation found that neither plant was consistently producing water that meets World Health Organization standards, likely contributing to lower water quality at household taps; only Mambogo was consistently meeting turbidity targets.
- Issues at Mafiga were due to a lack of post-chlorination. Since data collection, a new disinfection step has been put in place, likely improving the situation.
- In 2015, 41% of household taps tested were compliant with WHO standards for E. coli (0 CFU/100ml) compared to 26% compliance in other community sources. Only 15% of point of consumption samples were compliant, likely due to household water storage practices. Comparison with pre-program water quality was limited due to a change to a more rigorous testing methodology in 2015.
Access
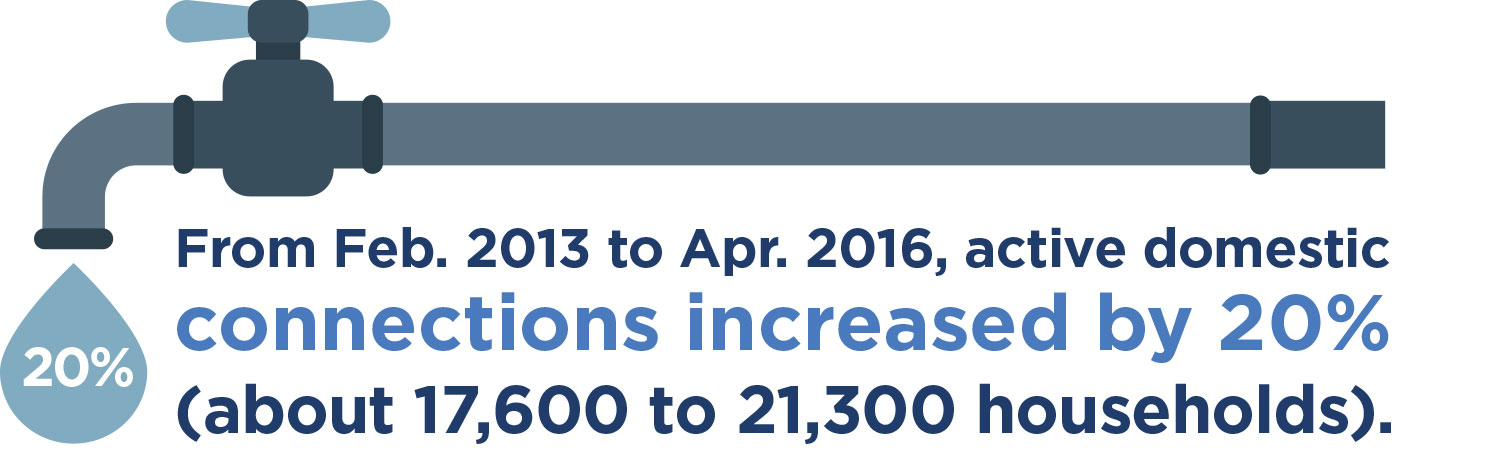
- In Morogoro, the percentage of households with a connection increased from 54% to 58% between 2013 and 2015. However, it is not possible to attribute the increase in household connections to any one factor. From Feb. 2013 to Apr. 2016, the number of active domestic connections increased by 20% (about 17,600 to 21,300 households).
Household Impacts
- Greater supply continuity is associated with increased water consumption, as well as with reductions in time spent collecting water, particularly for households with lower supply levels.
- Since continuity declined during the study period, it is not likely that the project resulted in intended impacts of water consumption at the household level and increased investment in human and physical capital in Morogoro after one year. It is unlikely that there will be significant economic benefits to households in these urban areas due to the program.
MCC Learning
- It was unrealistic to predict a strong health benefit from the project since under 5 diarrheal disease was already low and the causal links that trace the project to reduced stunting was tenuous at best.
- Water network monitoring is a critical complement to household surveys. MCC is addressing this lesson by placing a greater emphasis on system level monitoring throughout the compact life-cycle.
Evaluation Methods
The evaluation consisted of a performance evaluation and impact evaluation to measure how supply change affected outcomes of interest at the household level. The quasi-experimental impact evaluation measured 1-year impacts of the project at the system and household levels, utilizing a continuous treatment with Generalized Propensity Score Matching (GPSM) approach to quantify the impacts of incremental changes in water supply on short- and medium-term project outcomes. However, this approach relies on the assumption that the program would increase overall continuity for households, which did not happen because of utility management decisions to prioritize equity. As such, the impact analysis also included the use of ordinary least squares (OLS) and Instrument Variable regressions to triangulate findings. The impact analysis was complemented by a process evaluation that examined program implementation, outputs, and sustainability at two points in time: 1 and 2 years after program completion. The evaluation for the Morogoro Activity was originally intended to have two rounds of data collection. However, after a thorough review, MCC decided that the cost of another household survey in Morogoro outweighed the additional learning that was expected from another round of data collection.Two rounds of data were collected for this evaluation. The baseline occurred between April and Septem ber 2013, followed by a subsequent round of data collection conducted between August and November 2015 and involved the following data sources:
- A household survey of 2,508 was distributed to a panel of respondents in Morogoro.
- To measure E. coli, 377 household tap water quality tests were conducted. 140 water samples were drawn from community sources and 255 samples were drawn at the “point of consumption” (e.g. household water storage containers). To test for free chlorine residuals (FCR), 402 household tap water quality tests were conducted, and 67 water samples were drawn from community sources and 216 at the “point of consumption,” respectively.
- Pressure logging devices took direct measurements of water supply at the household level. Loggers were installed at a subset of 86 surveyed households.
- A set of 24 qualitative cognitive interviews were conducted to refine survey questions on water supply, consumption, storage, and illness.
- Monthly administrative data was collected from the utility.
- Site visits and semi-structured interviews with the utility and WTP staff were conducted.
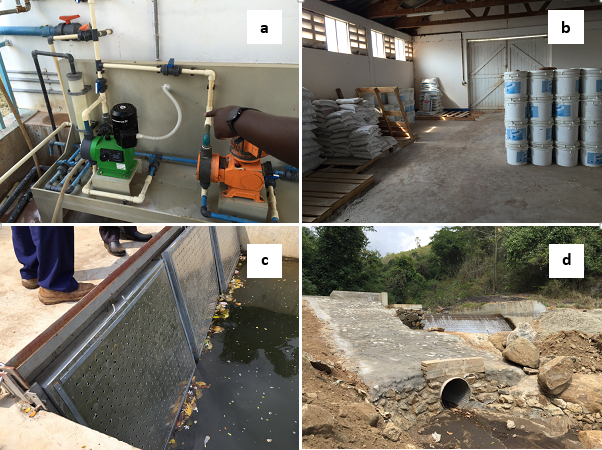
(A) Repaired pre-dosing pump at Mafiga; (B) Chemical supplies at Mafiga; (C) New strainers installed at Mambogo in-take; (D) Larger washout pipe installed at Mambogo
2019-002-2230