

Program Overview
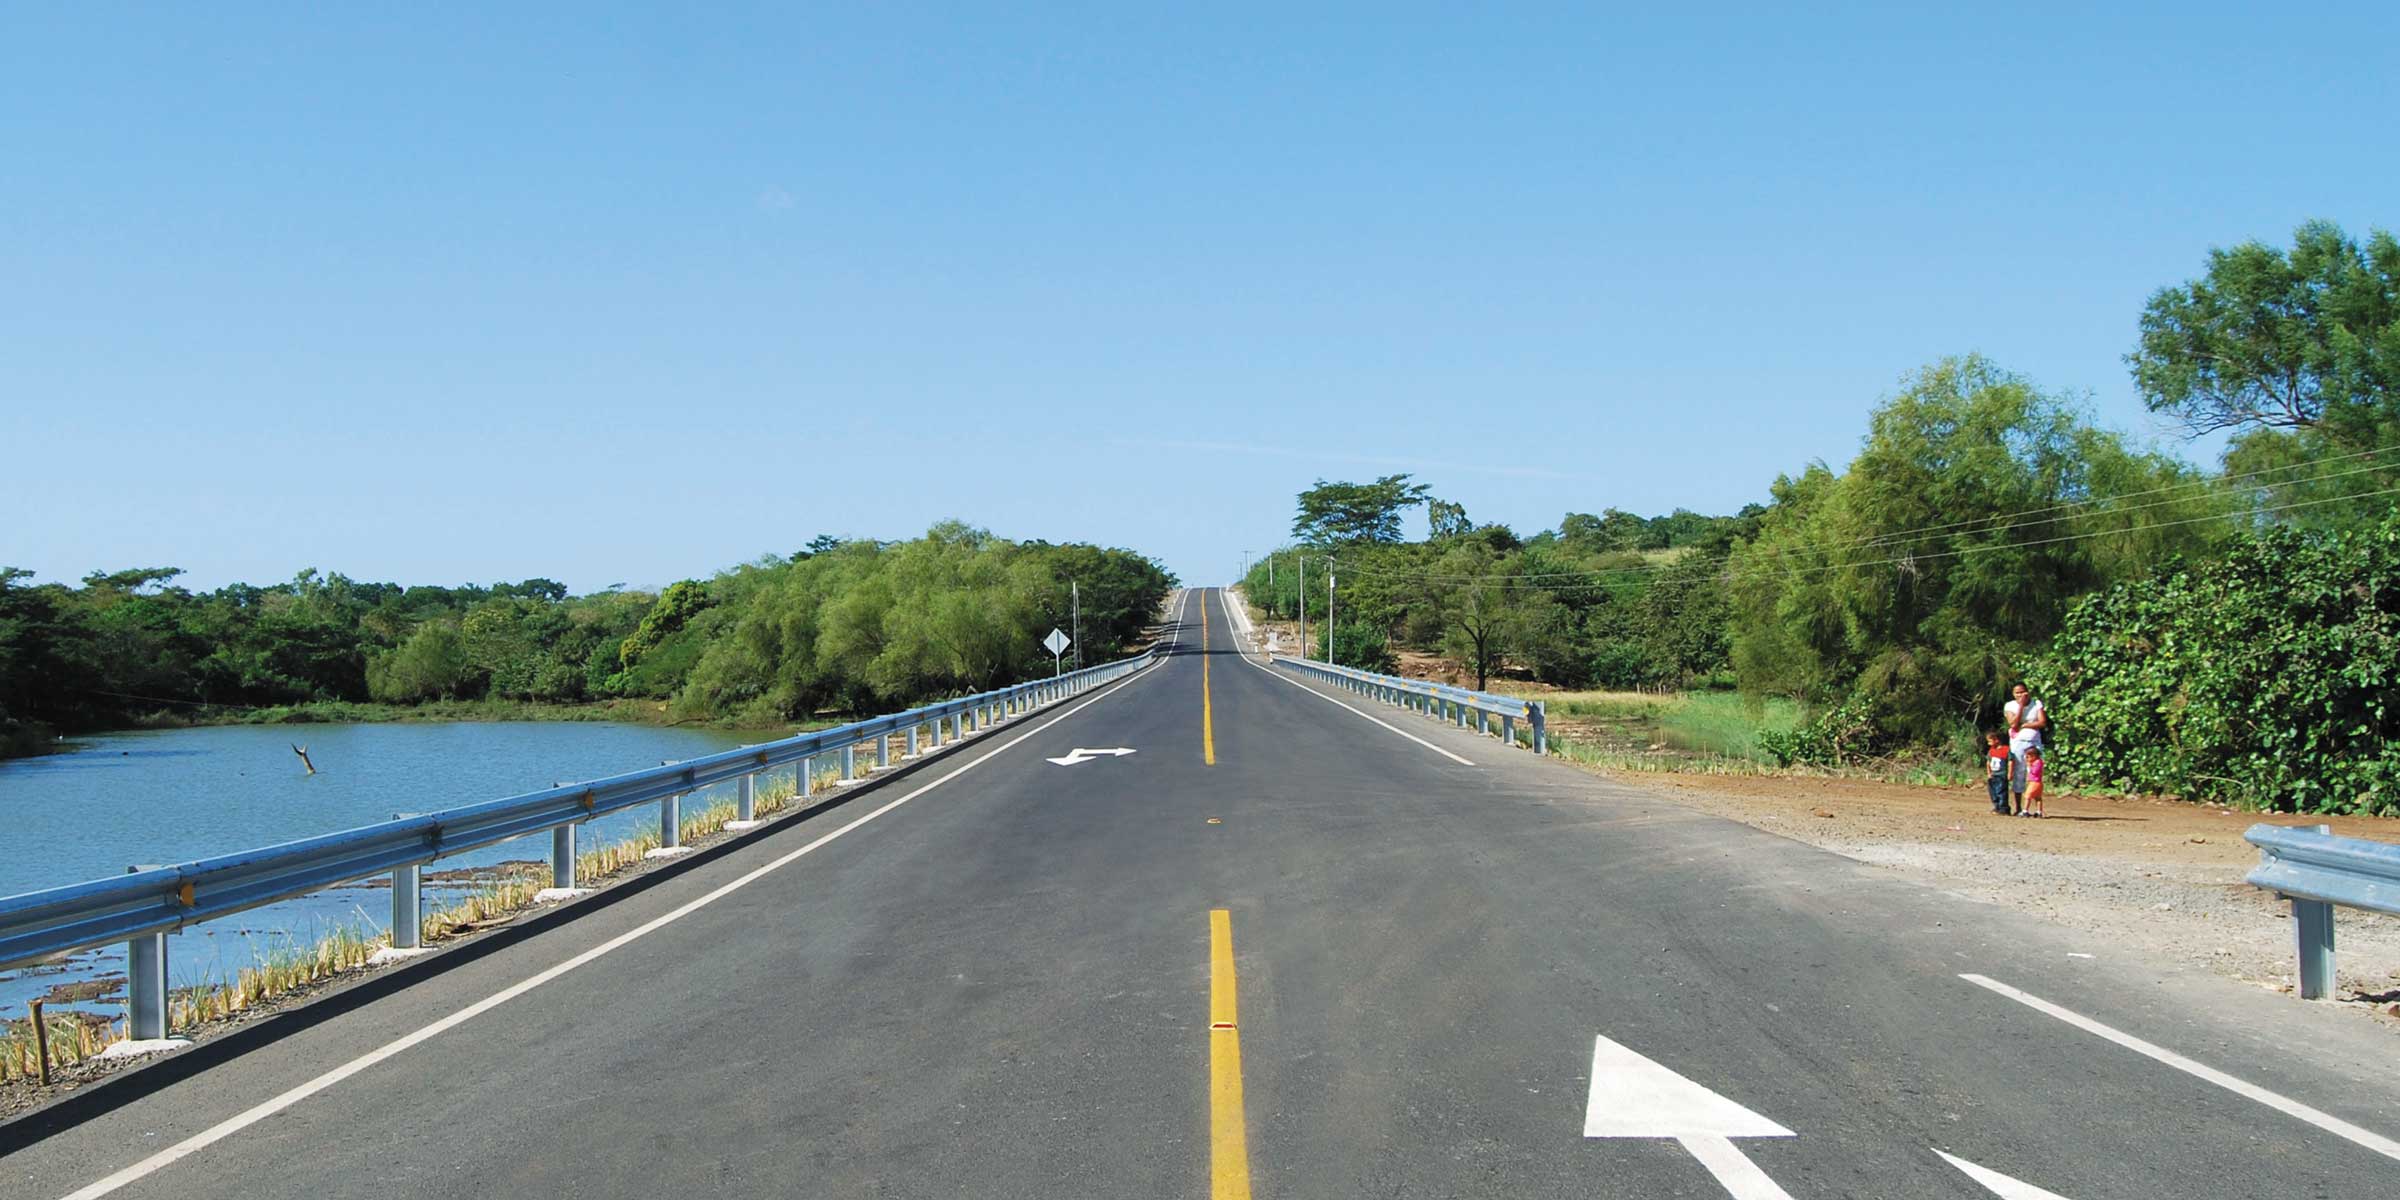
MCC’s $113 million Nicaragua Compact (2006-2011) supported those living in the Leon and Chinandega region through three projects, one of which was the $58 million Transportation Project. The project rehabilitated 18 kilometers of highway between Villanueva and Guasaule and 50 kilometers of rural secondary routes to improve community access to markets and social services. The project aimed to decrease transportation costs, thereby increasing the availability and lowering the price of consumer goods.
Evaluator Description
MCC commissioned Jonathan Alevy to conduct an independent final impact and performance evaluation of the Transportation Project. Full report results and learning: https://data.mcc.gov/evaluations/index.php/catalog/132.
Key Findings
Road Quality and Costs
- No roads met the 10 percent economic rate of return (ERR) hurdle rate because the actual costs were double those estimated in the feasibility study.
- On the benefits side, the number of vehicles using the road increased on all three roads surpassing expectations of the traffic growth.
- ERRs for the roads ranged from -3.9 percent to 4.5 percent, a decrease from initial estimates of 13 percent.
Availability and Costs of Goods
- The availability and costs of all products in the basic basket of goods remained essentially the same.
- Within the basic basket of goods, there were some statistically significant changes for perishable products.
Evaluation Questions
This final performance and impact evaluation included an ex-post calculation of the ERR of each road and an impact evaluation of the roads’ effects on local markets. The evaluation sought to answer the following questions about whether the rehabilitation of roads:
- 1
Affected the quality of the roads? - 2
Reduced vehicle operating costs? - 3
Affected the price of goods? - 4
Affected the availability of goods?
Detailed Findings

Road Quality and Costs

The transport project led to substantially improved road quality. The number of vehicles using the road increased on all three roads and surpassed the expected traffic growth. While the road upgrades led to increased use, the costs were twice the feasibility-study estimates. Because of higher costs, none of the roads had an ERR greater than 10 percent; ERRs ranged from -3.9 percent to 4.5 percent compared to initial estimates of 13 percent. These evaluation-based estimates are conservatively low given that all road upgrades were completed in 2010 with traffic counts occurring in 2010, less than one year later. However, literature suggests that road users may take two to five years to adjust to road improvements.
Availability and Costs of Goods
The impact of the lower transportation costs on the value of the basic basket of goods was close to zero in both urban and rural areas. However, the availability of goods increased in both project and non-project communities. Although there is a slightly larger increase in project communities (2.55 additional items available in project communities), it is not a statistically or economically significant effect.
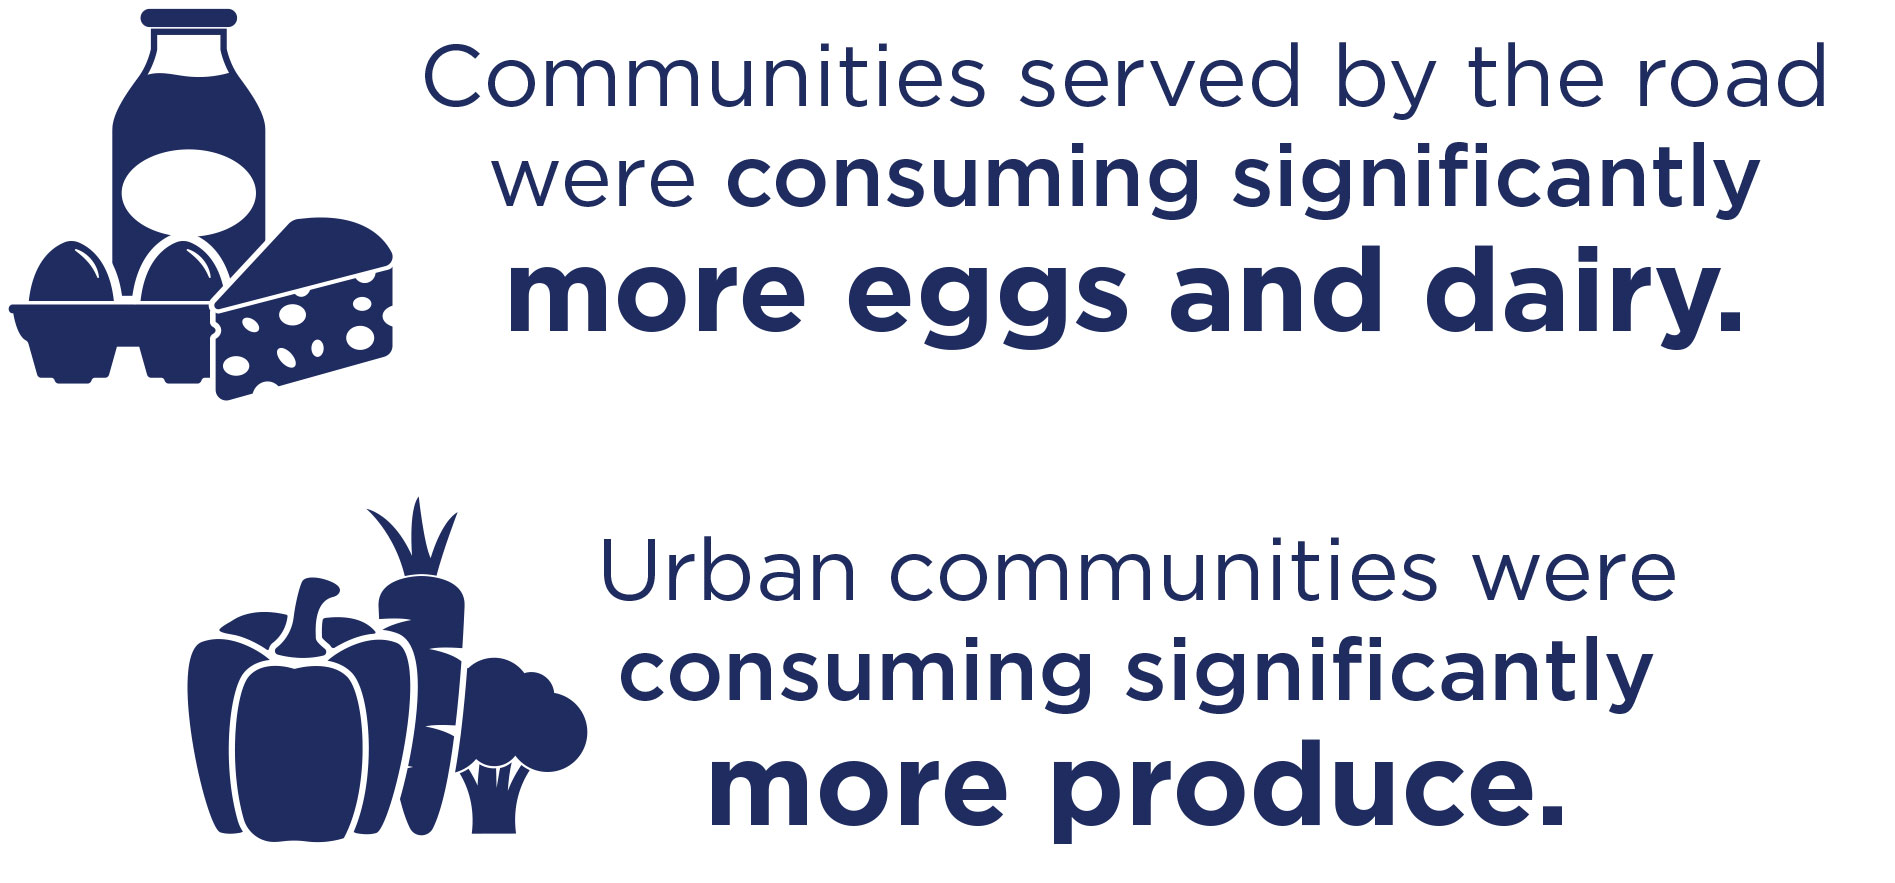
Within the basic basket of goods, there were some statistically significant changes for perishable products. From the household survey, communities served by the road were consuming significantly more eggs and dairy, and urban communities were consuming significantly more produce. The increased household consumption of dairy and eggs finding was supported by retail establishment surveys’ estimates of significantly reduced prices for these items.
Economic Rate of Return
- 13.2%
MCC Original Estimate - 4.5%
Evaluation-Based Estimate S9 (Leon-Poneloya-Las Peñitas) Road - -3.9%
Evaluation-Based Estimate S1 (Somotillo-Cinco Pinos) Road - 3.8%
Evaluation-Based Estimate VG (Villanueva-Guasaule) Road
The Original ERR for Transport Project was based on reductions in vehicle operating costs and time savings of road users and is a weighted average of the returns for the three road segments. The evaluation-based ERRs are lower due to higher costs, on average 2.2 times higher than estimated costs. The estimated benefits (reductions in vehicle operating costs and travel times) are consistent with the feasibility estimates.

The S1 (Somotillo-Cinco Pinos) Road before road improvement.
MCC Learning
When selecting roads to upgrade, include an upfront national or area-wide road network analysis based on selected criteria such as traffic volume, road roughness, and other parameters in order to prioritize potential road investments that are proven to be economically viable.
Understand the constraints in road maintenance as well as seek assurances from the partner country that the necessary mechanisms to ensure sustainability of their existing roadway network are in place prior to MCC committing to a road investment project.
To evaluate the project, determine when to collect data based on the logic of the investment. All road upgrades were completed in early 2010 with traffic counts taking place in 2010, for an exposure period of less than one year. The literature on rural infrastructure suggests that complete adjustment to projects of this type happens more slowly, typically two to five years from project completion.
Evaluation Methods
Two approaches were used to understand project impacts: (i) road-user benefits of reduced travel time and vehicle operating costs, and (ii) comparison of communities near the roads to those communities not near the roads. The community comparison relied on two data sources: establishment survey of basic basket of goods and a household-consumption survey of people living near the roads.

Man riding tricycle transport cart on road shoulder.
Road user benefits model for Economic Rate of Return
An independent ex-post ERR was calculated using a modified Road Economic Decision model. All road upgrades were completed in early 2010 with traffic counts taking place in 2010, for an exposure period of less than one year. In addition, traffic and Origin-Destination Surveys were conducted in 2008 and 2010.
Communities near the road model
An impact evaluation using a difference-in-difference with propensity-score matching methodology estimated how the local economy responded to lower transportation costs. The double difference was comprised of:
- First difference – comparing prices and availability of goods and household consumption in communities affected before and after the upgrading (treatment).
- Second difference – comparing prices and availability of goods and household consumption in communities NOT affected by the upgrading (comparison) before and after the upgrading to those communities in point (i) above (treatment).
- Matching – the sample for the establishment survey was created using propensity score matching methods. The comparison group was chosen from communities on roads considered for upgrading and in which project feasibility studies were conducted. The matching methods identified the communities most similar to those in the treatment group based on characteristics that included population, initial road quality, and share of population with electric lighting.
For the establishment survey, the baseline was conducted in August 2008, and the endline was conducted in October 2010. For the household-consumption survey, there were three rounds of surveys in 2007, 2009, and 2011. All road upgrades were completed in early 2010, for an exposure period of approximately one year.
2020-002-2448