

Program Overview
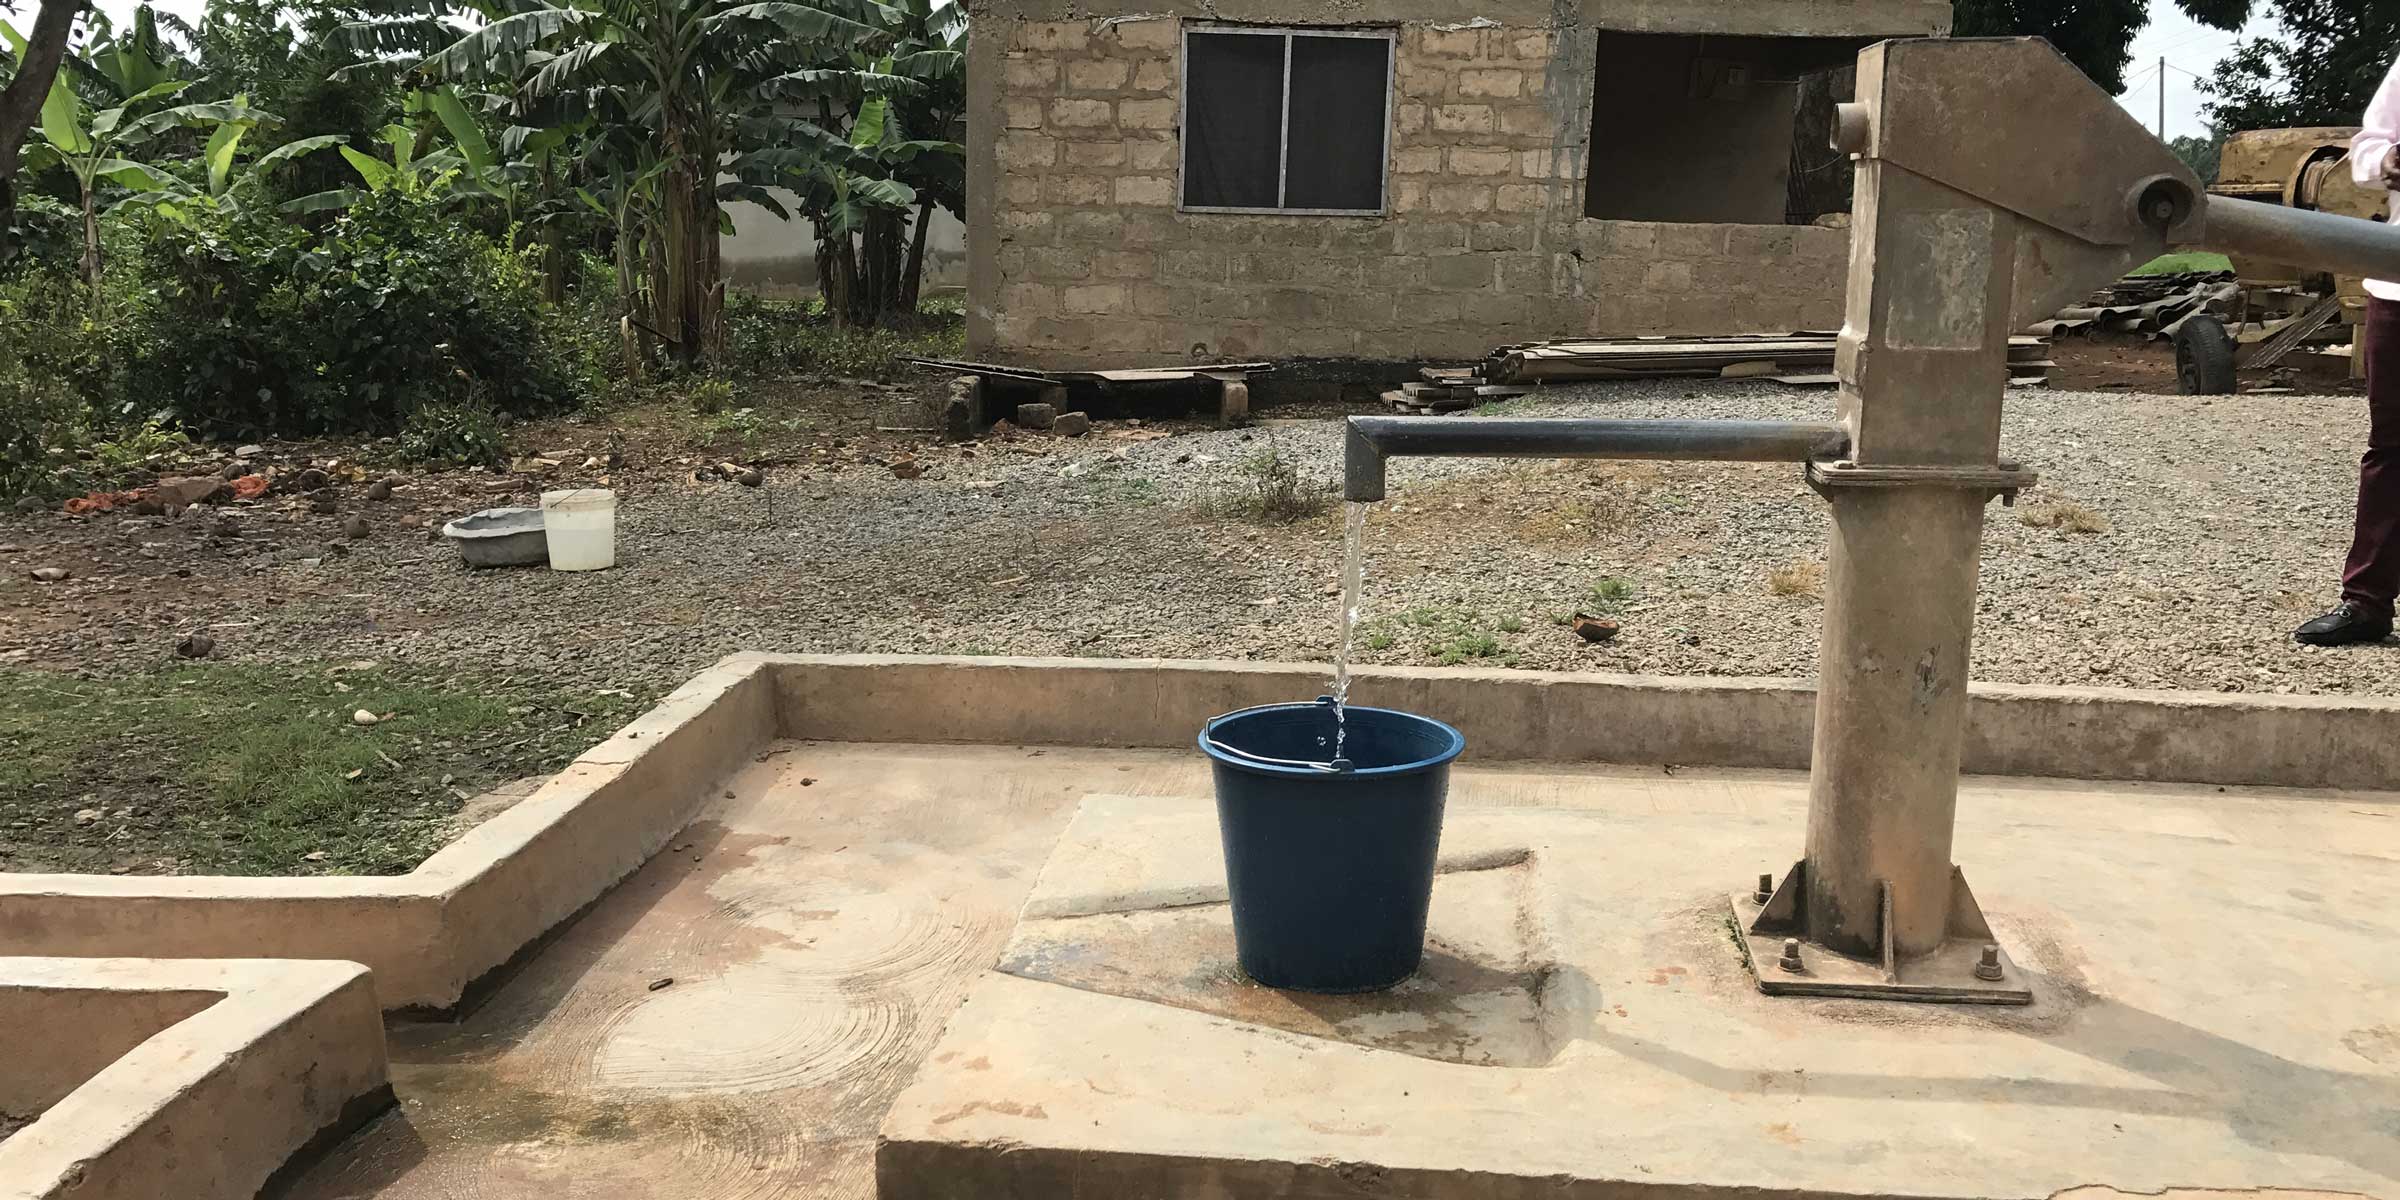
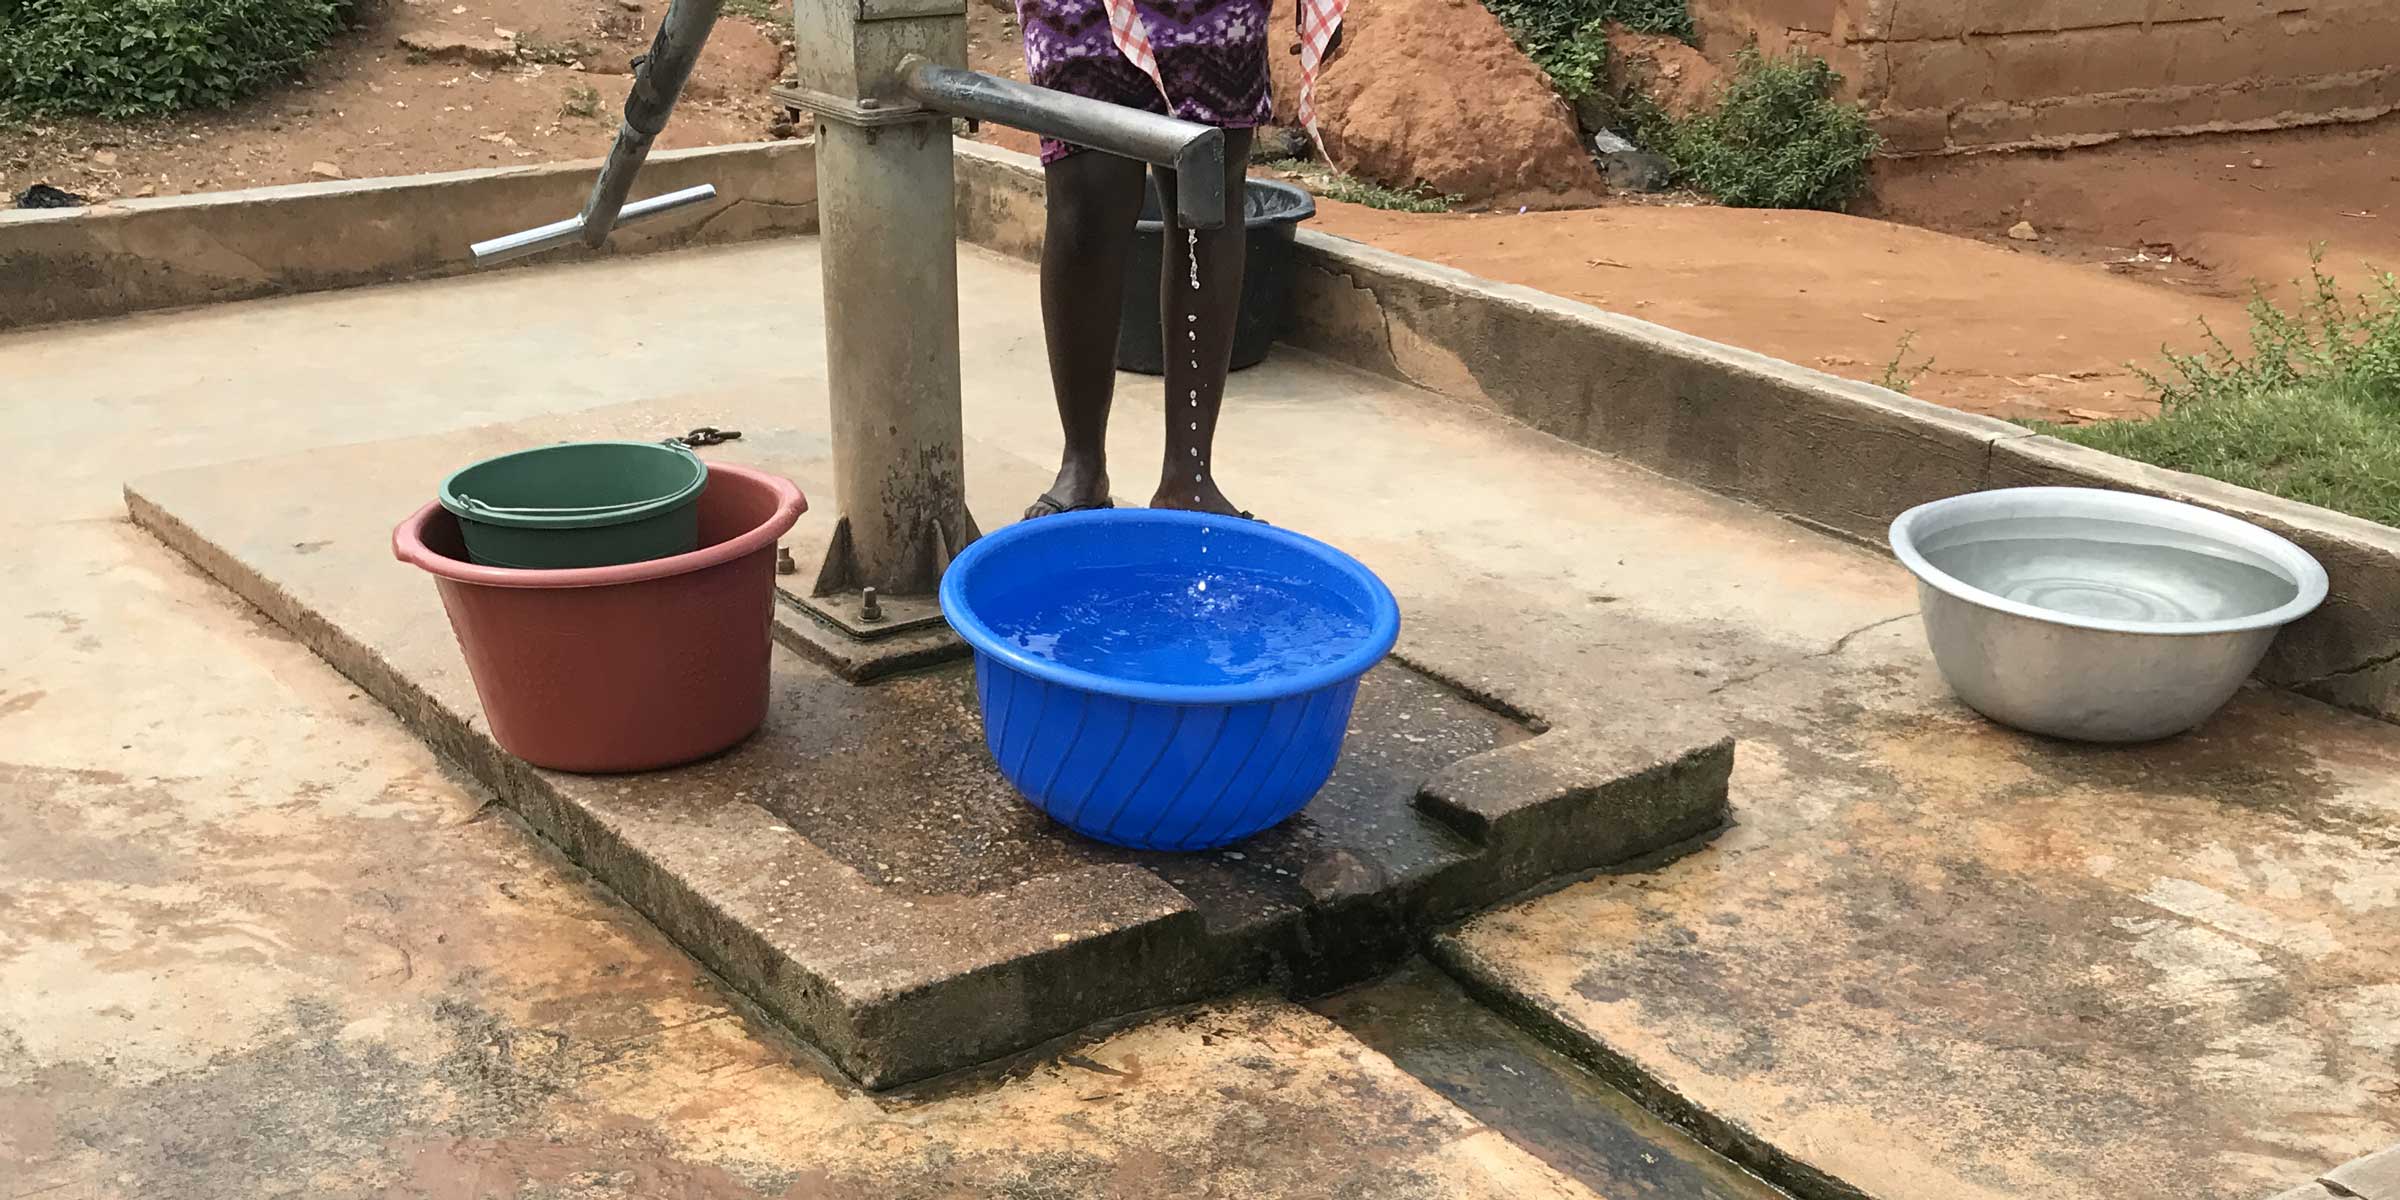
MCC’s $547 million Ghana Compact (2007-2012) funded the $15 million Water and Sanitation Sub-Activity to improve water systems in districts participating in the compact. The sub-activity aimed to decrease waterborne illnesses and reduce the time spent fetching water and caring for the sick so that community members would have more time to devote to economic activities. The sub-activity constructed or repaired 392 water points, including boreholes, small town water systems, and pipe extensions across 137 selected communities. It also provided hygiene and sanitation training to 778 participants.
Evaluator Description
MCC commissioned Notre Dame Initiative for Global Development to conduct an independent final impact evaluation of the Water and Sanitation Sub-Activity. Full report results and learning: https://data.mcc.gov/evaluations/index.php/catalog/112.
Key Findings
Time Savings and Distance Traveled
- Survey respondents in treatment communities reported that the intervention reduced their time spent collecting water by 13 minutes per day, and reduced their travel time to collect water by 3 minutes.
- Interestingly, more water points did not reduce the actual distance households in treatment communities traveled to collect water.
Water Consumption and Quality
- Having easier access to water sources did not significantly increase water consumption, nor did it affect the price paid for water.
- At the community level, water tested from improved sources demonstrated higher quality than surface water.
Health and Hygiene
- The evaluation found that the incidence of diarrhea in children under five was reduced by 6 percentage points; however, the reduction could not be definitively attributed to the intervention.
- The evaluation was not able to detect if the hygiene and sanitation training had an effect on hand-washing.
Household Welfare
- The evaluation did not find evidence that the intervention had an impact on household income.
Evaluation Questions
The final impact evaluation was designed to assess outcomes in time savings, water consumption, the price of water, health, and household welfare. Evaluation questions included assessing the impact of the investment on:
- 1
The distance traveled and the time households devoted to collecting water. - 2
The quantity of water consumed by households. - 3
The quality of water consumed. - 4
The price that households paid for drinking water. - 5
The incidence of diarrhea among children under five. - 6
Hand-washing behavior. - 7
Household income.
Detailed Findings
Time Savings and Distance Traveled
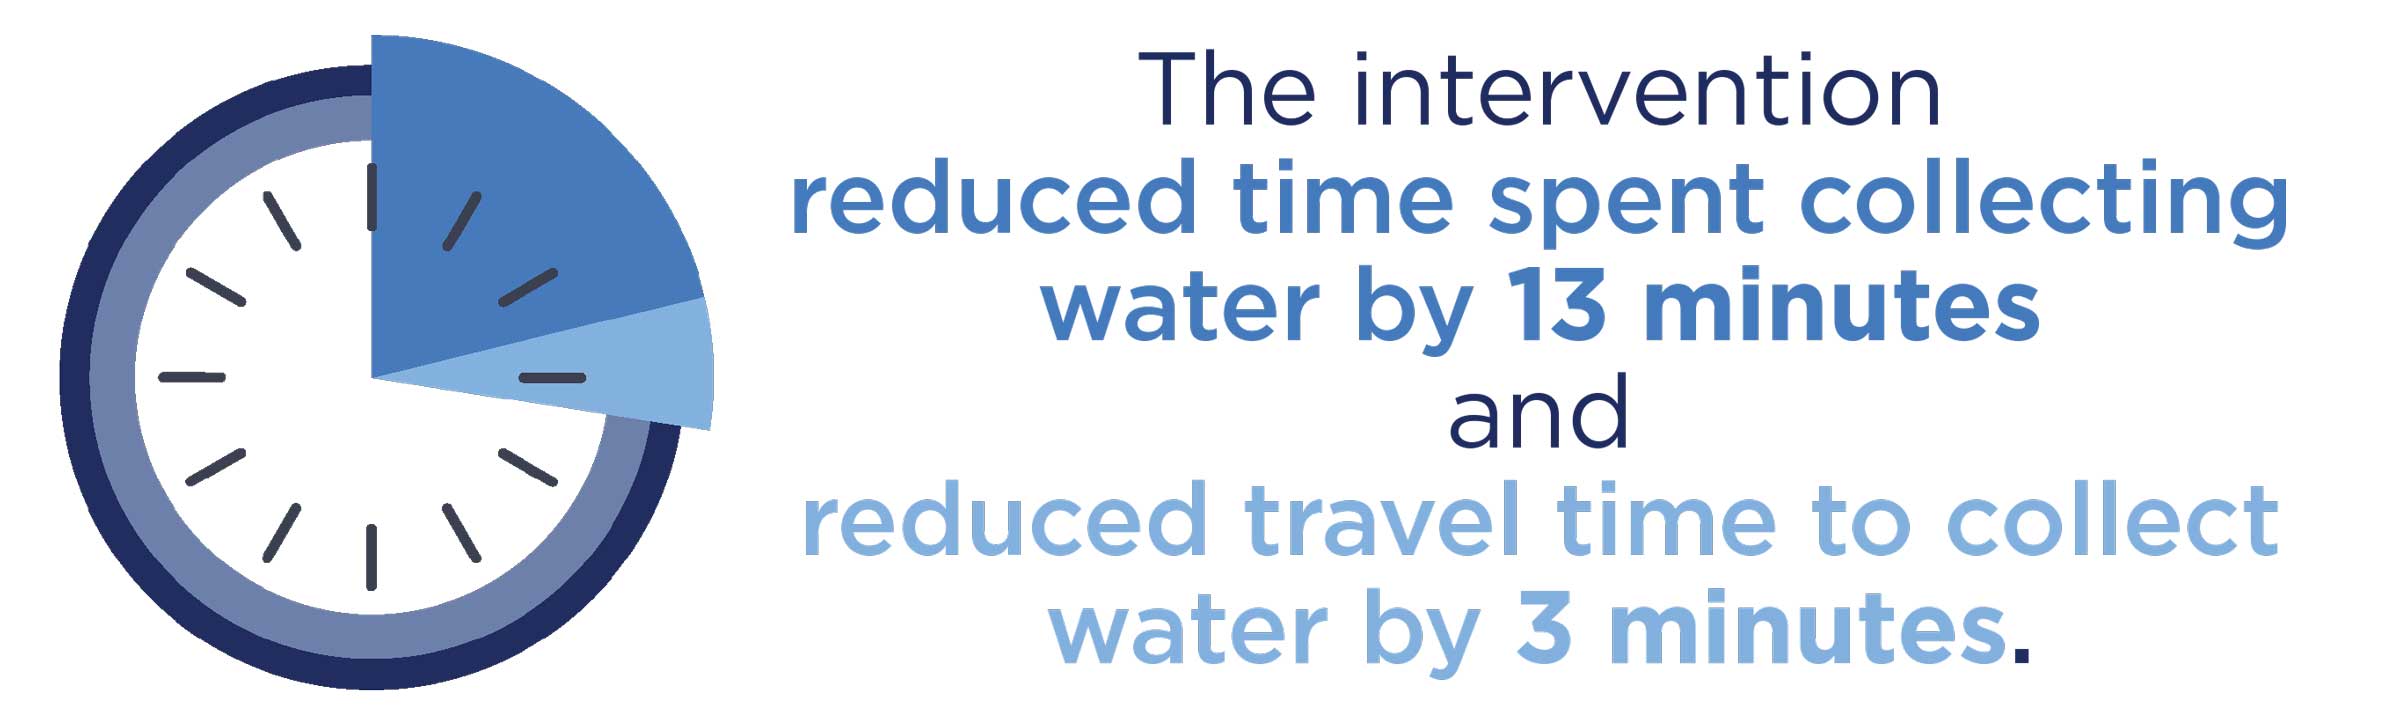
While beneficiaries reported a 13 minute savings in time spent collecting water, there was no difference in the distance to the closest water source between treatment and comparison communities. The discrepancy between the result of less time spent collecting water but no difference in distance are likely coming from two things: (1) people in treatment communities perceive that they are spending less time collecting water, and (2) people might have actually preferred a particular water source regardless of the distance.
Water Consumption and Quality
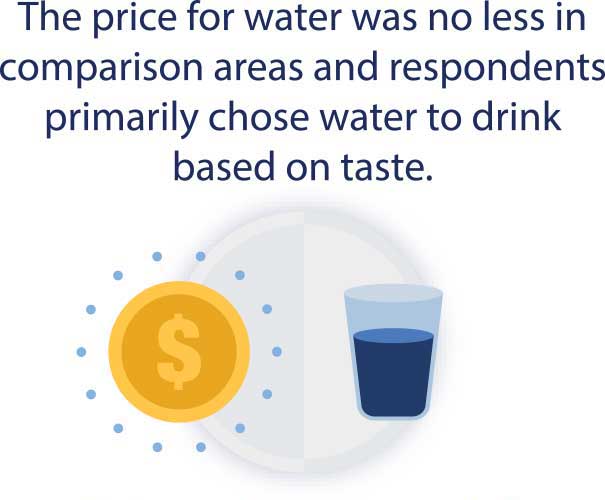
The improved water sources did not significantly impact the price paid for water or the quantity of water consumed from any water source between households in treatment and comparison communities. This may be explained by the fact that the price for water was no less in comparison areas, and 36 percent of respondents in treatment communities reported that they were unable to afford the price. In addition, respondents primarily chose water to drink based on taste, and improved sources did not necessarily taste better than unimproved sources.
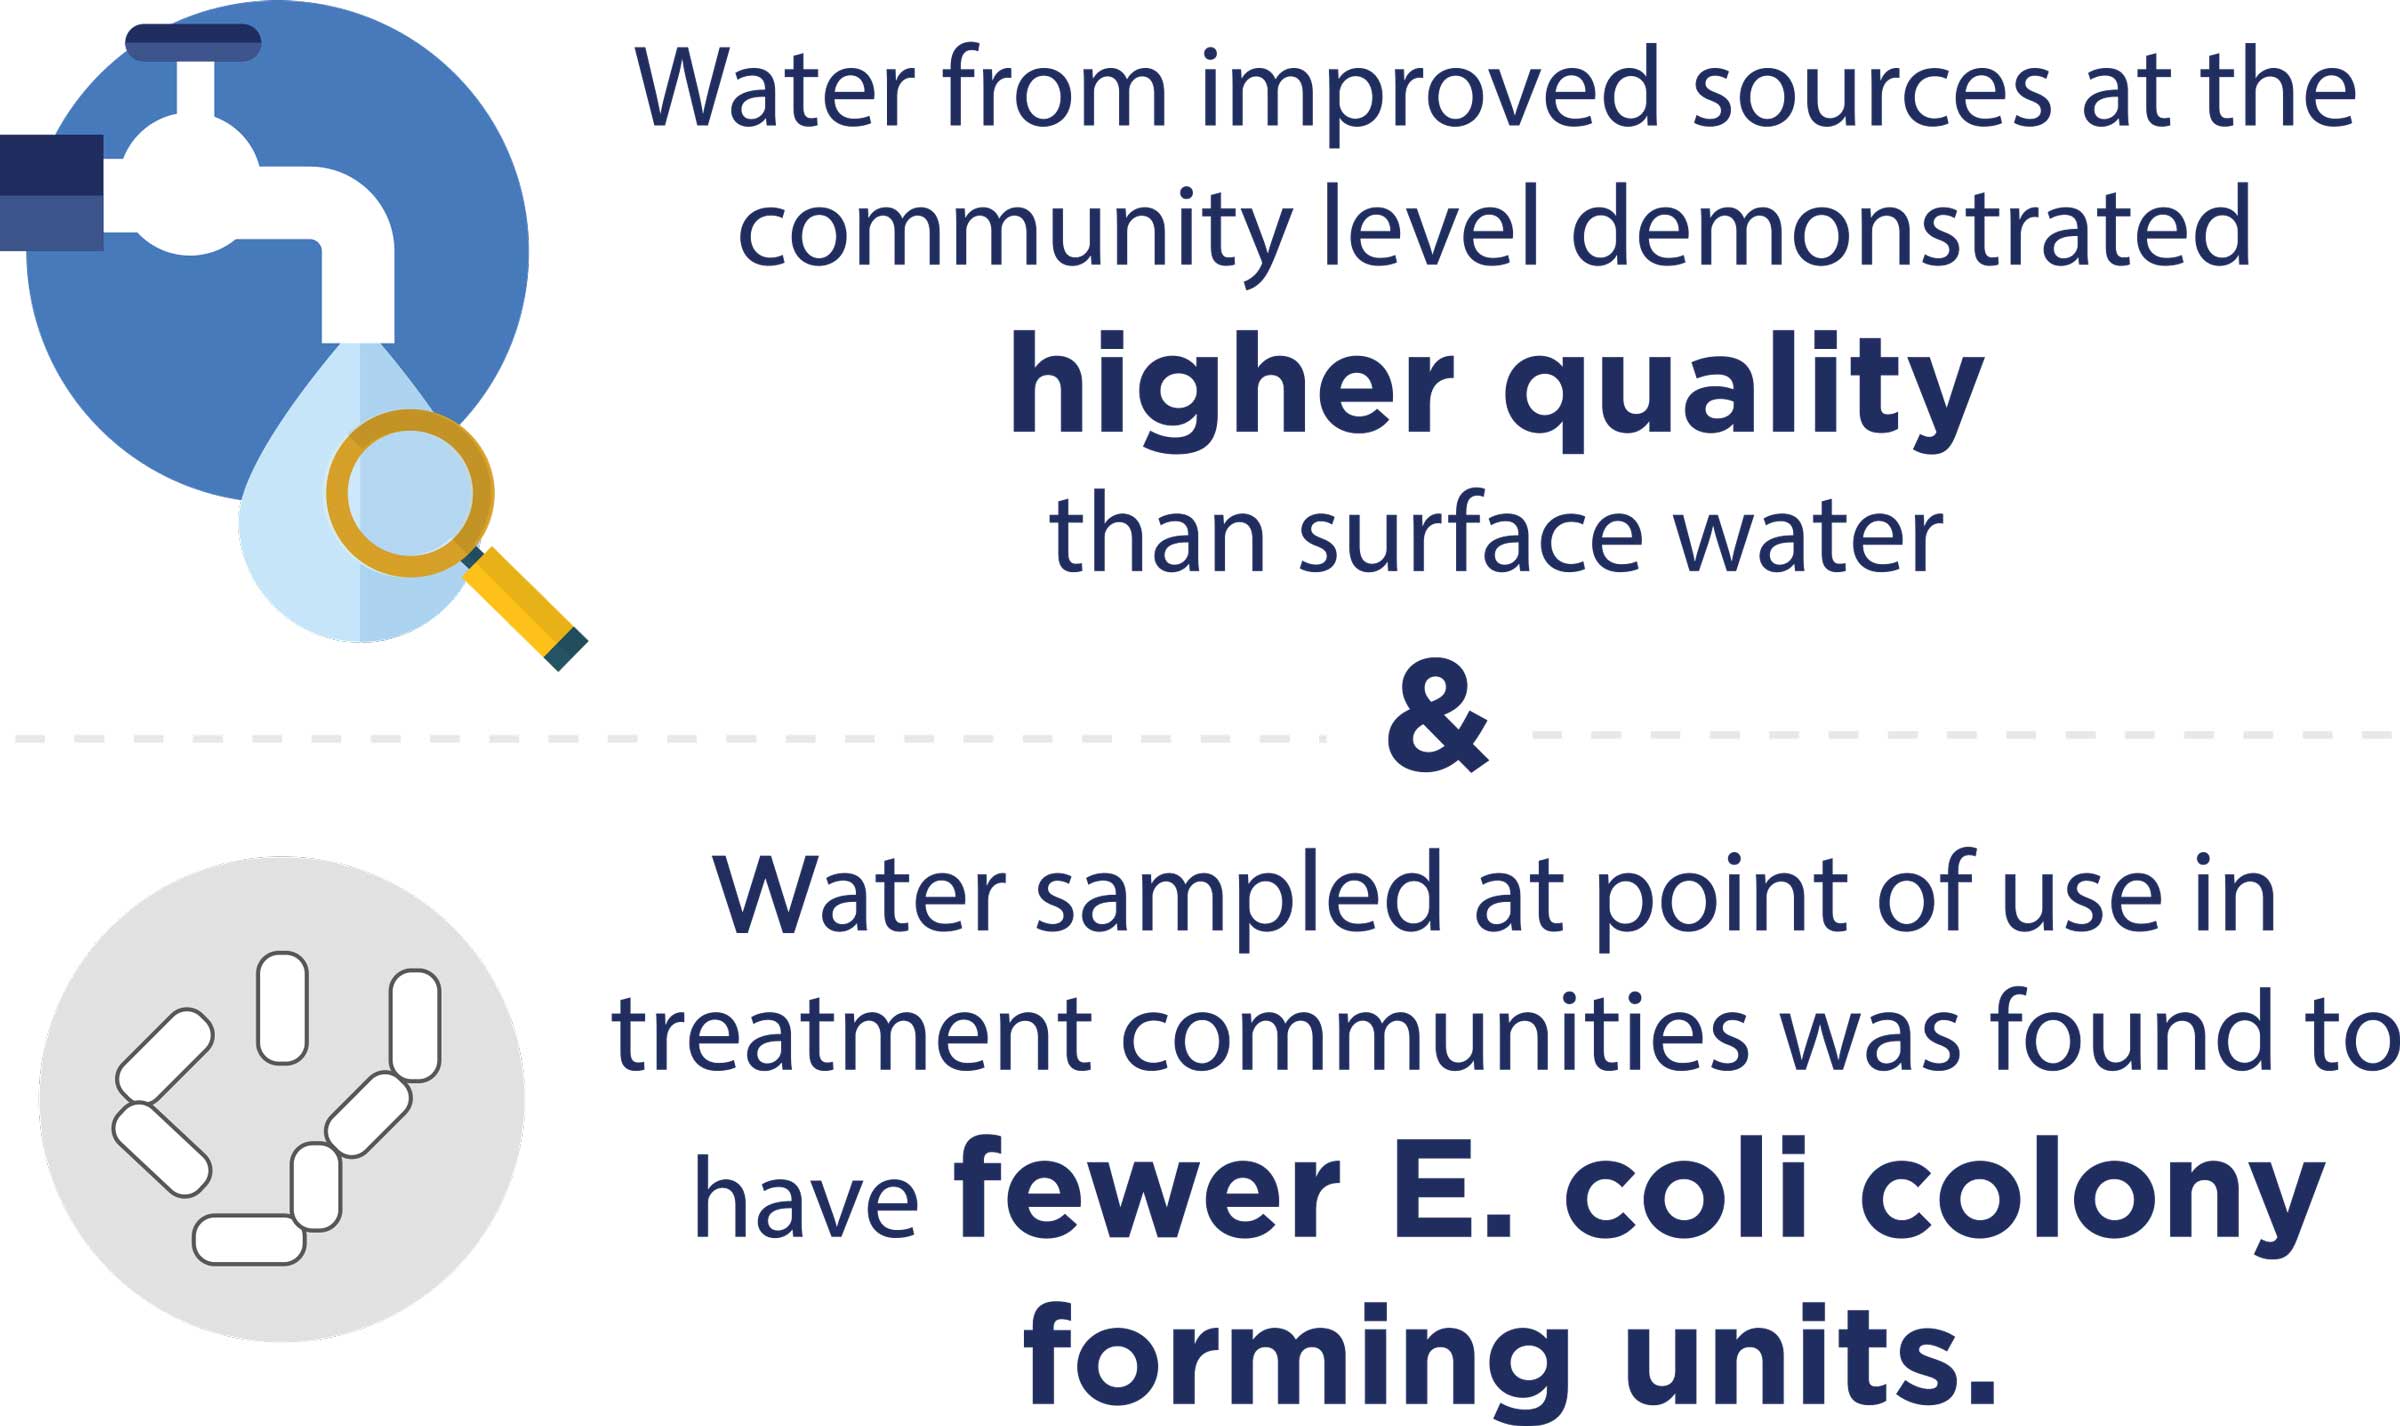
The intervention did appear to have positively impacted water quality. Water from improved sources at the community level demonstrated higher quality than surface water, and water sampled at point of use in treatment communities was found to have fewer E. coli colony forming units, as compared to water sampled from comparison communities. However, data on water quality was collected at end-line only.
Health and Hygiene
According to the end-line survey responses, the incidence of diarrhea in children under five was reduced by 6 percentage points in the intervention communities. However, a new question was added to the end-line survey to specifically ask about diarrhea incidences, separate from a question about general illness in the household. As the data was collected this way in the end-line survey and not in the baseline survey, the difference could not be definitively attributed to the intervention. The hygiene and sanitation training similarly was not found to have an effect on household members’ hand-washing behavior in treatment communities.
Household Welfare
Although the intervention resulted in time savings, changes of such small magnitude did not result in increased economic activity. Accordingly, the evaluation did not find a statistically significant impact on household welfare in terms of income or possession of durable goods.
Economic Rate of Return
- 20.5%
over 20 years Original Estimate - 6.6%
over 20 years Evaluation-Based Estimate
MCC considers a 10 percent economic rate of return (ERR) as the threshold to proceed with investment. The ERR was updated with actual information based on demographic and evaluation data, including estimates of disease reduction, time savings, deterioration rates, wage rates, inflation, population growth and spillover effects. The initial ERR also assumed that benefits of the program will be realized by the entire population; however, some benefits such as time savings will only be realized by water collectors.
MCC Learning
There was not a good understanding of the local context (community expectations or current water collection practices) during project design and implementation. Water points were placed for primarily hydro-geological considerations without community consultation or any effort to maximize time savings.
Despite the fact that women play the primary role in fetching water, qualitative data shows that they were underrepresented in consultations and as part of the management committees around the water points.
While most communities receiving the intervention had a pricing plan, the plans were often inadequate to cover the costs of operations and maintenance, thereby impacting project sustainability.
Evaluation Methods
The impact evaluation methodology is a quasi-experimental propensity score matching design, where communities that received the interventions were matched with similar communities that did not. The evaluator originally proposed a difference-in-differences evaluation design , but shifted to an analysis of covariance (ANCOVA) to have higher statistical power. In addition, water quality was tested at both point of collection (community water sources) and point of consumption (household water storage). The exposure period was between 2 and 2.5 years for the quantitative data collection and the water quality testing. Qualitative data was collected 1.5 years after the project ended. Data collection included:
- Ahousehold survey of 1200 households at baseline (Sept/Oct 2010) and endline (Feb/March 2015). These households were selected from 50 treatment and 50 comparison communities.
- Water quality testing at endline only in both treatment and comparison communities in May 2015. Samples were taken from 247 community water points and 963 household points of consumption.
- Qualitative data collection in August 2014 in the form of 10 focus group discussions (FGDs), and 20 key informant interviews across 15 communities (10 treatment and 5 comparison) including 116 participants. FGDs were organized into women only, men only, and mixed gender groups.
2019-002-2227