

Program Overview
MCC’s $273 million Jordan Compact (2011-2016) contained three projects: the $88.6 million Water Network Project (WNP), the $75.8 million Wastewater Network Project (WWNP), and the $97.8 million As-Samra Expansion Project (AEP). It aimed to increase the supply of water to households and businesses through improvements in the efficiency of water delivery, the extension of wastewater collection, and the expansion of wastewater treatment in Zarqa Governorate. The projects aimed to stimulate economic growth by reducing the cost of water and the cost of supplying it (both borne by the utility) and by reducing household expenditure on non-utility water.
Evaluator Description
MCC commissioned Social Impact to conduct an independent final impact and performance evaluation of the Jordan Compact. Full report results and learning: https://data.mcc.gov/evaluations/index.php/catalog/103.
Key Findings
Water Supply
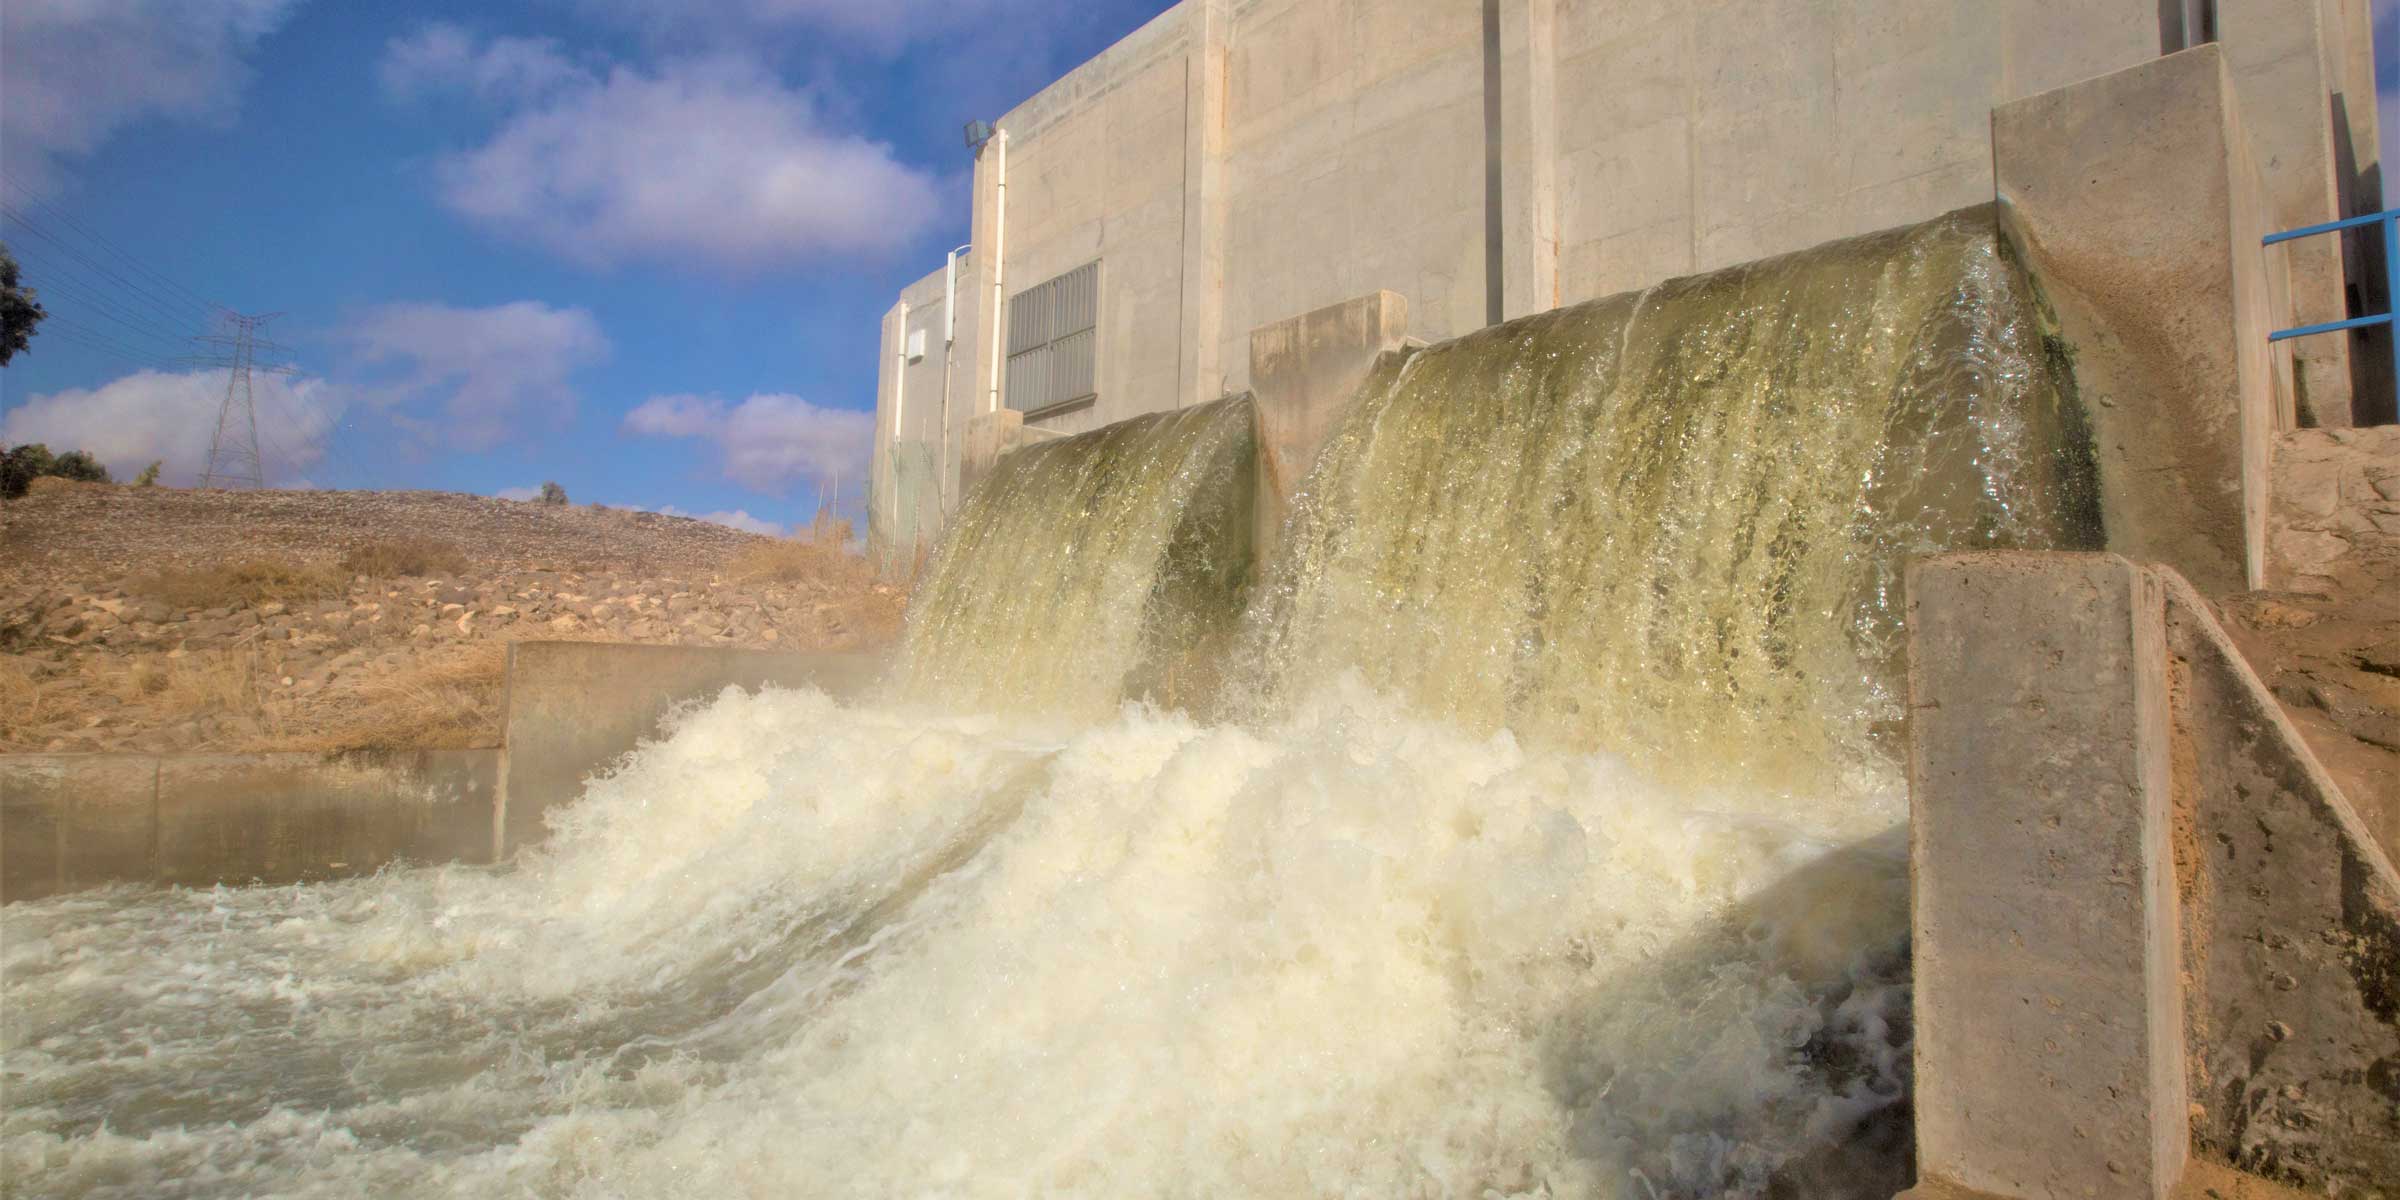
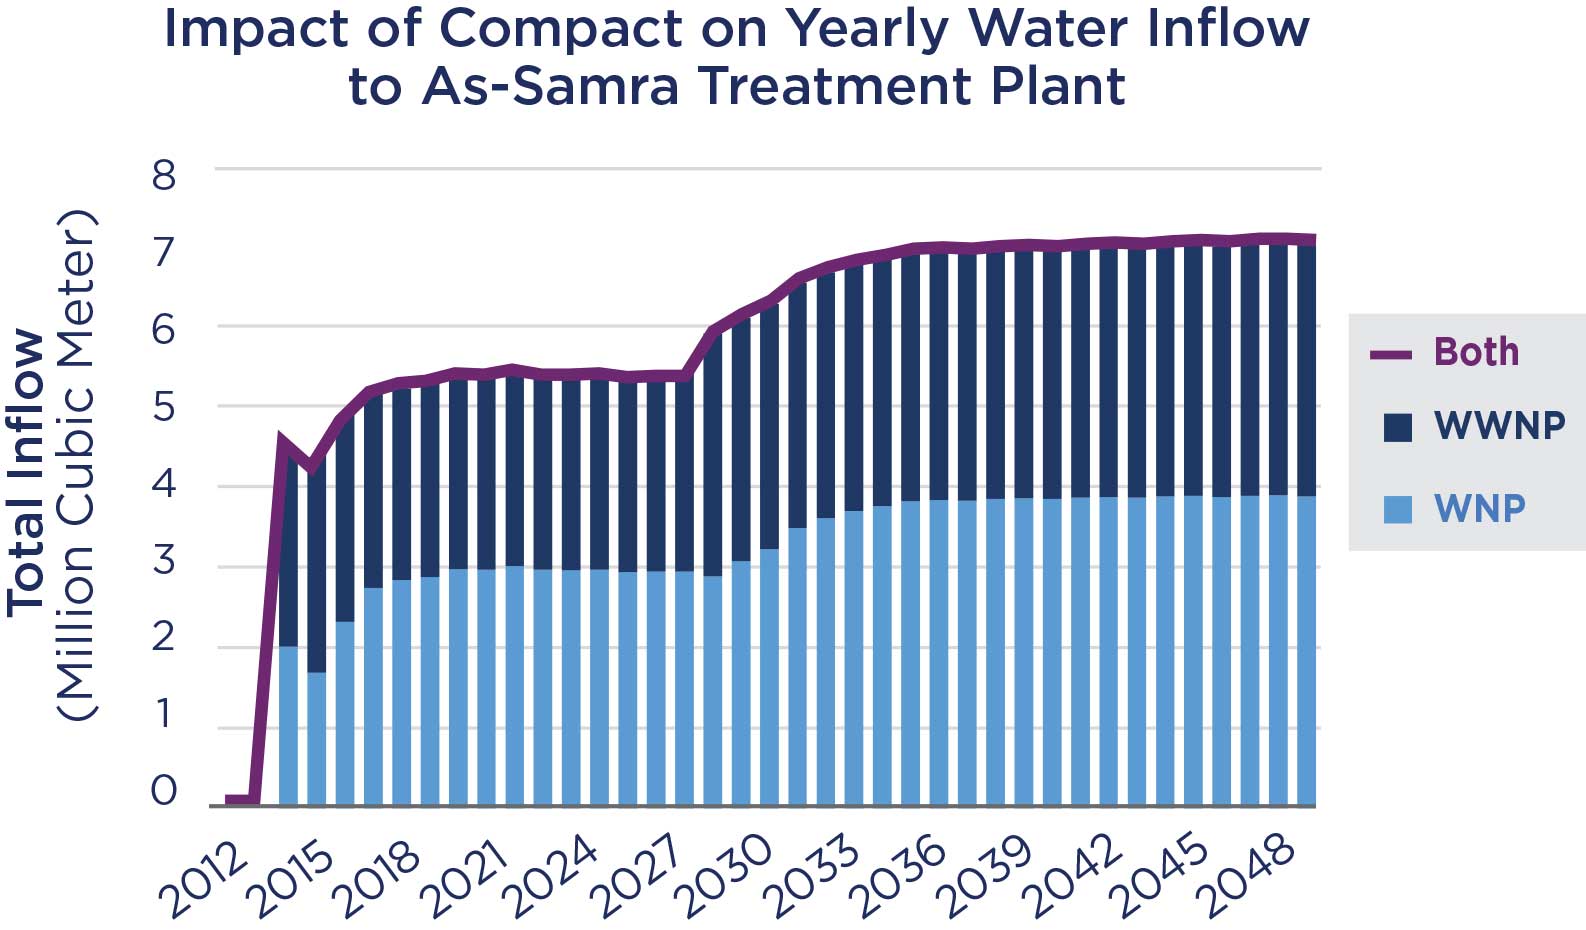
- MCC expanded Zarqa’s sewer networks, resulting in 5 million m3/per year more wastewater flowing to the As-Samra Wastewater Treatment Plant compared to what would have happened without the compact. This water was successfully treated by As-Samra and released to farmers in the Jordan Valley, which freed up more freshwater for consumers in Zarqa.
- Farmers in the Jordan Valley increased use of blended water (a mix of treated wastewater and freshwater) for irrigation as a result of WWNP efforts. Farmers did report declining quality in their irrigation water compared to controls, although total farm revenues did not decline.
- This increased use of additional treated wastewater for irrigation allowed more fresh water (4-6 million m3/year, which is 0.5 percent of total national water use/year) to be supplied to urban areas in Jordan, and this amount may continue to increase over time reaching as much as 11 m3/year by 2050.
Water Consumption
- Billed consumption increased by 2-3 m3/quarter per connection, though some of this change was due to more accurate meter reading.
- There was no evidence that residents spent less on alternative, more expensive water sources, such as bottled water, an objective of the compact. The theory that consumers would shift towards utility water and away from such other water sources, thus saving time and money, did not materialize.
Utility Performance
- The Jordan Compact appears to have improved the Zarqa water utility performance, reducing administrative losses (via water meter replacement) and non-revenue water, or NRW (water that the utility does not collect payment for because of theft, billing errors, or leaks). However, decreases in NRW lagged expectations, perhaps due to lack of complete isolation of the improved network from the old network, or illicit water use.
- Utility revenue increased, but so did costs. However, these changes may be due to the utility’s privatization rather than the compact.
- Operating costs rose. This was because compact infrastructure was not fully operated as expected, using more pumping than expected relative to gravity-fed distribution, and because of the costs of additional wastewater management. Energy costs also rose more than expected. Finally, the pumping of expensive water from the Disi aquifer also increased costs over time, though this increase was expected.
Evaluation Questions
This final impact and performance evaluation was designed to answer key questions such as:
- 1
Water Supply: Did the compact investments result in increased irrigation with additional blended water (freshwater + treated wastewater) in the Jordan Valley? Is the volume of irrigation using freshwater correspondingly decreasing? What reallocation of water is made possible by the compact investments? - 2
Water Consumption: Did the WNP change the quantity of water consumed by households and enterprises in Zarqa (through reduced leaks and increased reliability)? Did the WNP affect time and money expenditure on water for consumers in Zarqa? - 3
Utility Performance: Did the net cost recovery of the utility improve due to the compact, and is this related to service improvements? Did the WWNP change consumer expenditure on wastewater management and disease prevention and treatment?
Detailed Findings
Water Supply
Irrigation with blended water in the Jordan Valley increased and irrigation using freshwater alone decreased, compared to controls. The WNP and WWNP investments contributed 5 million m3/year of inflow to the As-Samra Wastewater Treatment Plant, an amount that may increase to nearly 8 million m3/year by 2050. Treated wastewater is now blended with Zarqa River water, freeing up more water supply for consumers in Zarqa and increasing the use of blended water by farmers downstream. This additional flow is displacing the use of freshwater alone for irrigation in the North Jordan Valley, where farmers report a 10-15 percentage point increase in the relative balance of blended to freshwater sources, compared to controls. This shift away from freshwater alone took longer to occur than originally projected in the ex-ante MCC economic rate of return.
There was initial concern that this shift to blended water would negatively impact farmers by affecting farm productivity; but fortunately, no negative impacts were found. Compact investments did not lead to consistent changes in total farm revenues in treatment areas using increasing proportions of blended to fresh irrigation water. In areas that had always used blended water but were experiencing increased flows as a result of the compact, overall output, revenue, and profits increased relative to other farming areas. The additional water consumption that led to these changes was not anticipated by compact designers and likely dampened positive effects observed further downstream in the Jordan Valley.
This shift in irrigation sources freed freshwater for urban water consumers: 3-5 million m3/year of additional water supply (net of water losses) reached urban consumers in Zarqa between 2014 and 2018 compared to a model-based counterfactual—an amount that may increase to 8 million m3/year by 2050.
Water Consumption
Water supply reliability improved as a result of the Jordan Compact, with duration of service increasing by 1.2-1.8 hours/day on days water is supplied relative to comparison areas in Amman. Metered consumption of utility water increased among households in WNP areas by about 2-3 m3/quarter compared to controls, though some of this increase was due to reduced meter error. There is no consistent evidence of changes in the quantity of vendor (shop or tanker) water consumed. Additionally, there is no evidence of increased water consumption among enterprises compared to controls.
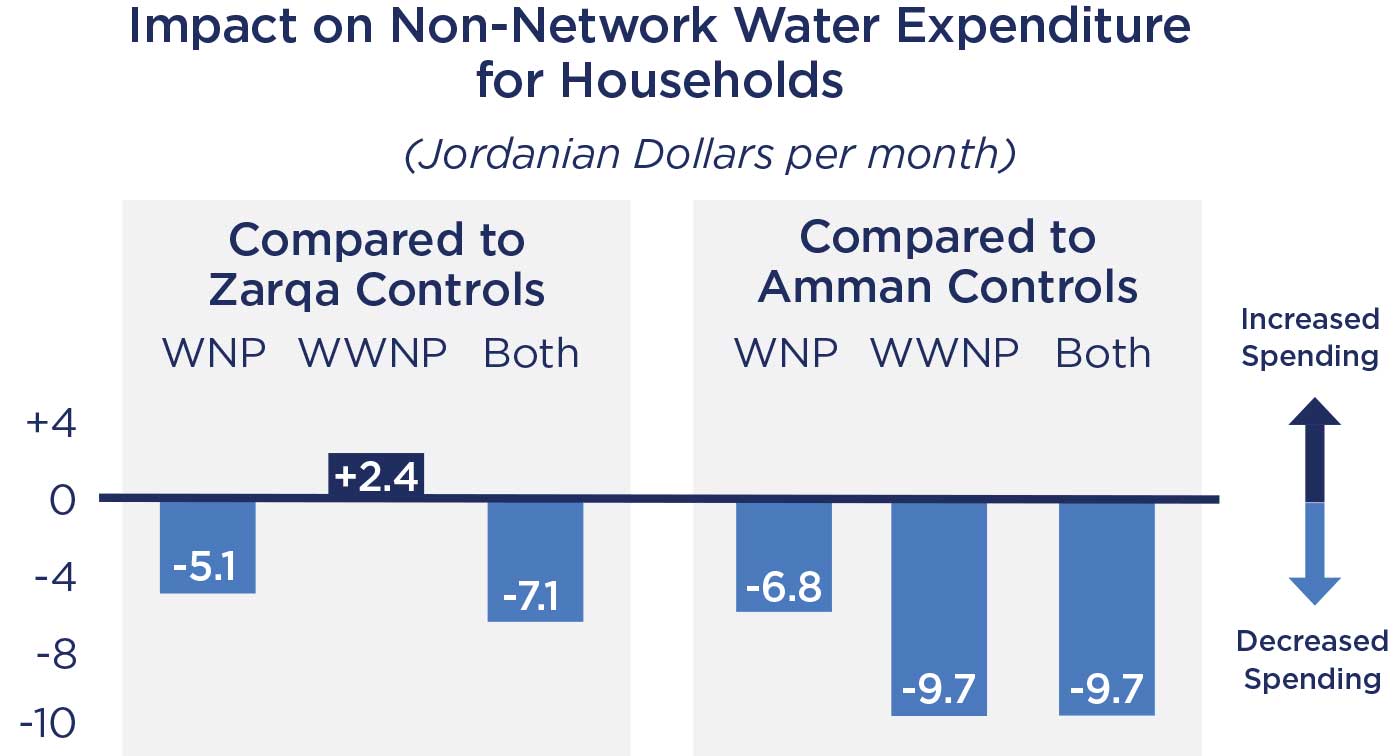
Vendor water is more expensive than utility water, and it was theorized that households would shift away from this source and towards cheaper utility water as a result of improved supply, thereby saving money. However, there is only weak evidence that expenditures on vendor and network water declined. Measured declines are mostly not statistically significant, and cannot be clearly attributed to the compact, since quantities of shop and tanker water consumed did not decline. Even though the evaluation did not find evidence of unsafe microbial contamination in network water, consumers expressed a preference for vendor water.
There was no evidence of time savings from improved water supply, thus the theory that using more network water and less vendor water would save consumers shopping time did not hold true.
Utility Performance
Operating cost recovery initially improved sharply in 2014-2016 (from 60 percent to close to 90 percent) as revenues increased with sewer subscriptions and meter replacement. Despite decreasing non-revenue water, cost recovery has since declined (back to about 70 percent in 2018), likely due to increased energy costs, the continued need for pumping for network water supply, and the costs of wastewater management and pumping of water to Zarqa from the Disi aquifer.
There was no evidence of consumer savings on wastewater management thus far, although this impact may take longer to materialize given the infrequency of cesspit maintenance. There were inconsistent results for diarrheal disease (mixed evidence of increases in WWNP areas), but the evaluation samples were not large enough to detect such changes as it would have required a prohibitively large sample size to detect the effect size modeled in the ex-ante MCC cost benefit analysis, therefore these increases were likely spurious.
MCC Learning
Engagement in the M&E Plan drafting process and the Evaluation Management Process is critical to ensuring relevant and accurate results measurement.
Learning for Future MCC Economic Models: Substitution of blended wastewater for freshwater among farmers takes longer than anticipated, and substitution of utility water for vendor water by households did not occur.
Ensure the compact objectives (Section 1.2 and Section 1.3 of the compact agreement), logic diagrams, economic models and other communications about what the compact intends to do all align.
Key personnel changes to the evaluation contract may need evaluation management committee review.
Evaluation Methods
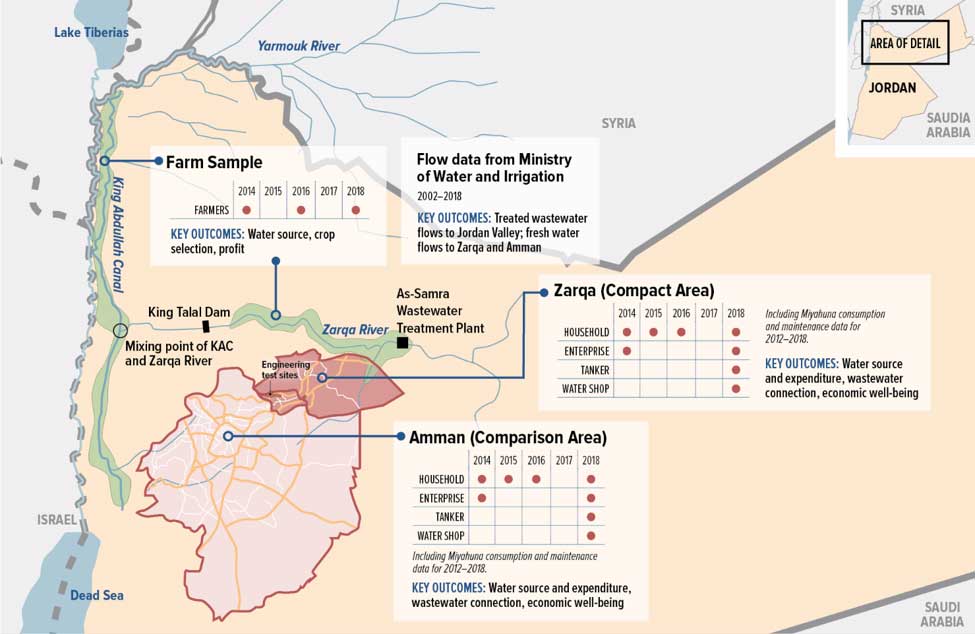
The results targeted to the Jordan Valley were measured through an impact evaluation, specifically a difference-in-differences approach that uses variations across time and space in the usage of freshwater and blended water.
The results targeted to Zarqa households and enterprises were also measured through an impact evaluation, specifically a differences-in-differences matching design. Intervention (treatment) and non-intervention (control) zones in Zarqa were matched based on pre-project characteristics. Treatment zones in Zarqa were also matched with controls in Amman to distinguish impacts from spillover effects within Zarqa.
To assess benefits to the Zarqa water utility, the evaluation compared utility performance indicators over time in Zarqa against those in Amman and Aqaba. The evaluation also drew on the impact evaluation framework to conduct zonal analysis of billing and maintenance events in the compact areas and matched comparison areas.
Exposure Period: Depending on the evaluation question and evaluation data source, the total period of exposure to the intervention being evaluated ranged from 27 – 50 months.
Data Collection:
- Zarqa Households, Enterprises, and Water Vendors: 3,359 household interviews were conducted at baseline in 2014. Two waves of interim data collection were conducted, the first in late 2015 resulting in 3,416 interviews, and the second in mid-2016 resulting in 3,596 interviews. The endline was conducted in mid-2018 resulting in 3,662 interviews. 345 enterprise interviews were conducted at interim in 2014 and 418 at endline in mid-2018. 320 water vendor interviews were conducted in 2018.
- Jordan Valley: 551 farm interviews were conducted at baseline in mid-2014. Interim data was collected in 2015 and endline data was collected in mid-2018, both with 539 interviews.
- Zarqa Water Utility: Mainly secondary data was used for this analysis, but primary data was collected on water loss and meter accuracy. Key informant interviews also took place at endline.
2019-002-2290