

Program Overview
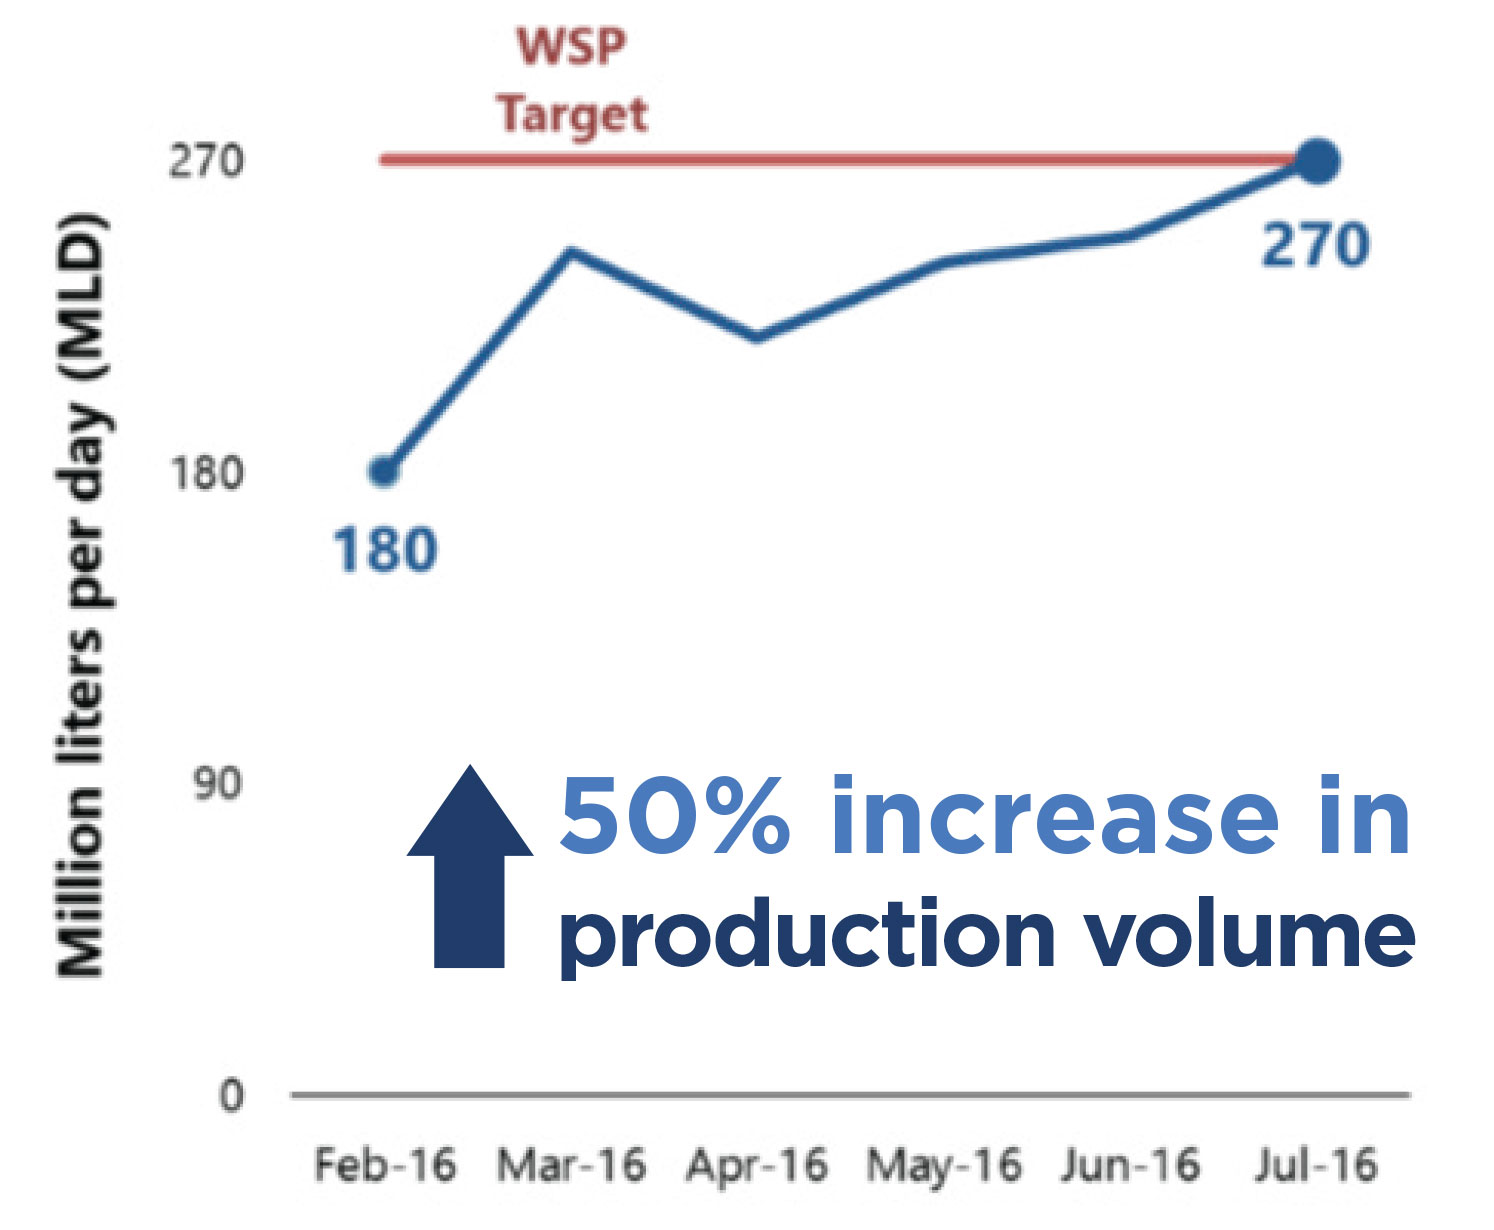
MCC’s $695 million Tanzania Compact (2008-2013) funded the $39.9 million Lower Ruvu Plant Expansion Activity in Dar es Salaam, which was part of the $54.6 million Water Sector Project (WSP). The objective of the project was to increase investment in human and physical capital and reduce prevalence of water-related diseases. The activity aimed to increase production and quality of water in Dar es Salaam by rehabilitating the Lower Ruvu (LR) Water Treatment Plant (WTP). The activity increased water production by 50% with the plant producing 270 million liters per day (MLD).
Evaluator Description
MCC commissioned Social Impact (SI) to conduct an independent impact evaluation of the Tanzania WSP. Full report results and learning: https://data.mcc.gov/evaluations/index.php/catalog/86.
Key Findings
Program Implementation
- The infrastructure was in good condition at the time of the evaluation, though an unreliable power supply to the Lower Ruvu (LR) Water Treatment Plant (WTP) threatened sustainability.
- While the expansion of the LR WTP was completed in 2014, the increased water volume could not flow to Dar es Salaam until 2016, after the delayed completion of a new water transmission main funded by the Government of Tanzania.
Supply, Reliability, Quality and Access
- The LR WTP is now producing 50% more water, significantly improving the reliability of water supply for customers.
- Access to piped water increased overall in Dar es Salaam. There is still considerable demand for new connections among unconnected households.
Household Impacts
- The impact analysis found that newly connected households significantly increased water consumption compared to unconnected households, and are now able to consume at levels recommended for maintaining good health.
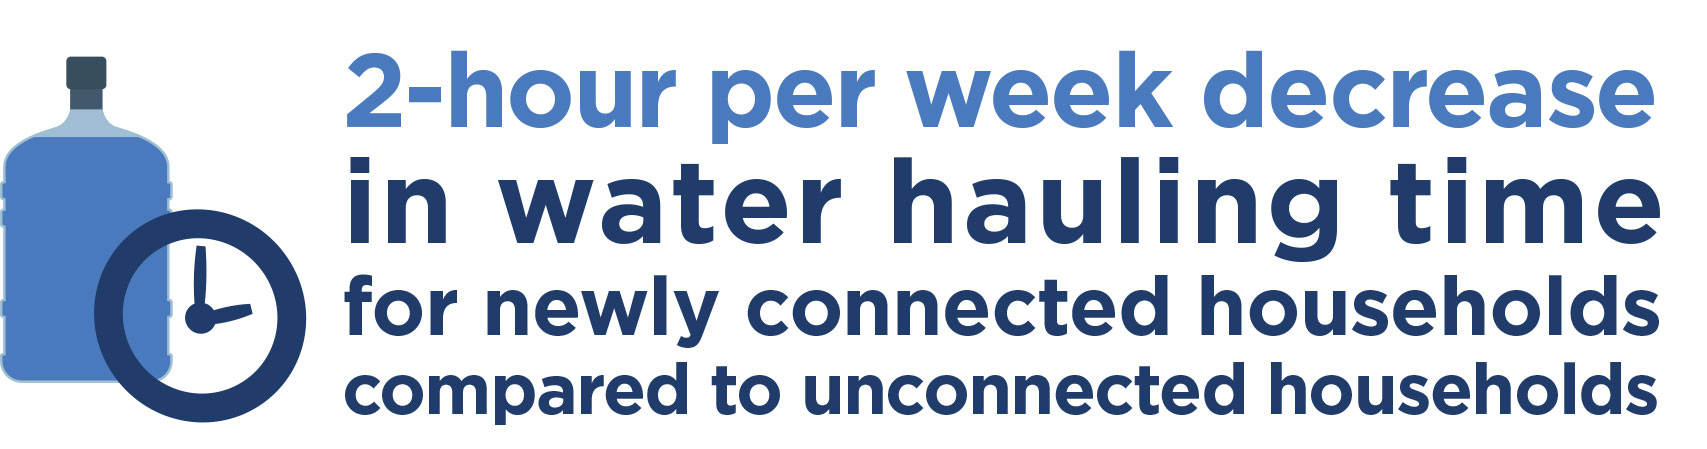
- Supply improvements and new connections led to statistically significant reductions in water hauling compared to baseline for households that always had a connection, and for newly connected households compared to unconnected households.
Evaluation Questions
The final impact evaluation was designed to answer the following questions.- 1 Implementation: Was the MCC investment implemented according to plan? What challenges were encountered and how were they addressed?
- 2 Outputs & Outcomes: Did the project lead to improvements in supply, access to and availability of water, water quality, and water consumption patterns?
- 3 Objectives: Did the project impact human and physical investment and health (under five diarrheal illness)?
- 4 Goal: What was the project’s impact on poverty and income?
- 5 Cross-Cutting: How did the benefits differ by sub-groups? Did the project produce any unintended results? Was the project cost-effective?
- 6 Lessons Learned & Sustainability: What lessons were learned and what is the likelihood that results will be sustained?
Detailed Findings
Litres of Water Production Volume Per Day
Program Implementation
- Water production volume reached its target of 270 MLD in July 2016, after a ramp-up period starting in March 2016. Overall, the works are in good condition and the plant has sustained its targeted level of production to date.
- The plant continues to have high turbidity in treated water.
- Sustainability is threatened by an unreliable power supply that leads to frequent shutdowns and damage to machinery, for which spare parts have not been readily available.
Supply, Reliability, Quality and Access
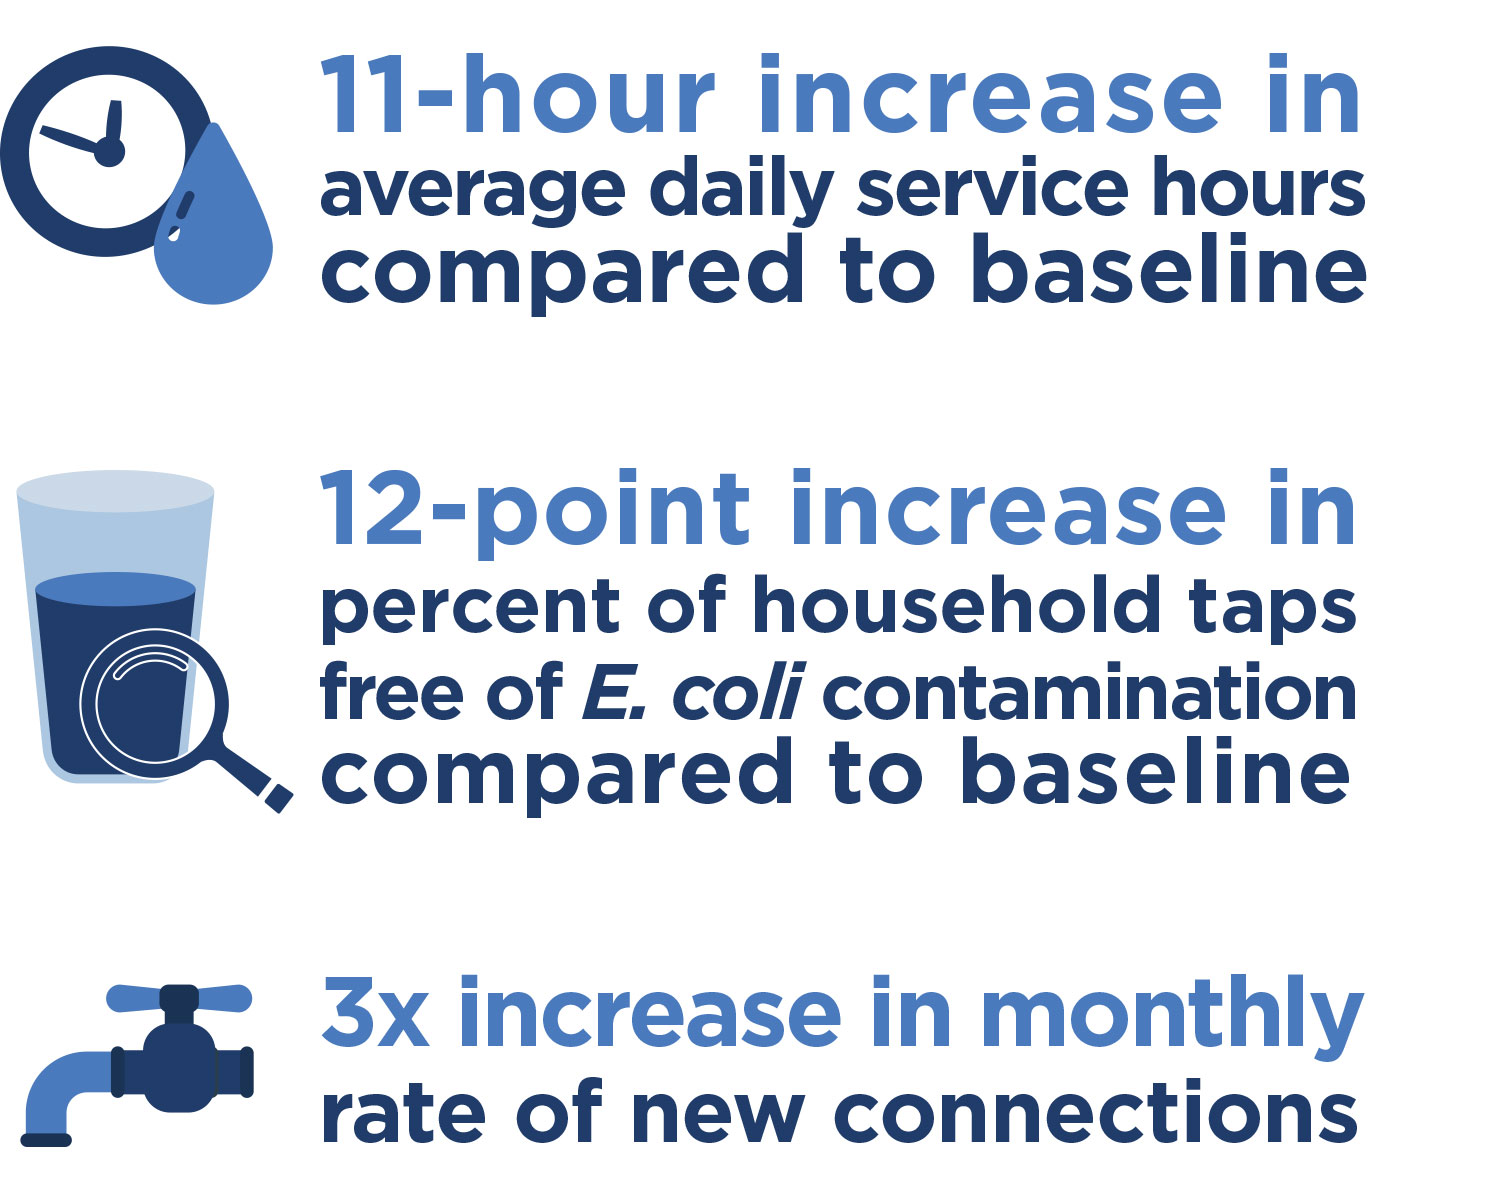
- Customers now receive an average of about 20 hours of supply per day, compared to about 9 hours per day before the program. However, intermittent service persists in some areas of the city, particularly at higher elevations.
- Water quality at household taps improved due to increased production and reduced intermittency. 64% of household taps were free of E. coli compared to 52% two years prior at baseline. However, point-of-consumption water quality did not improve implying contamination during water storage.
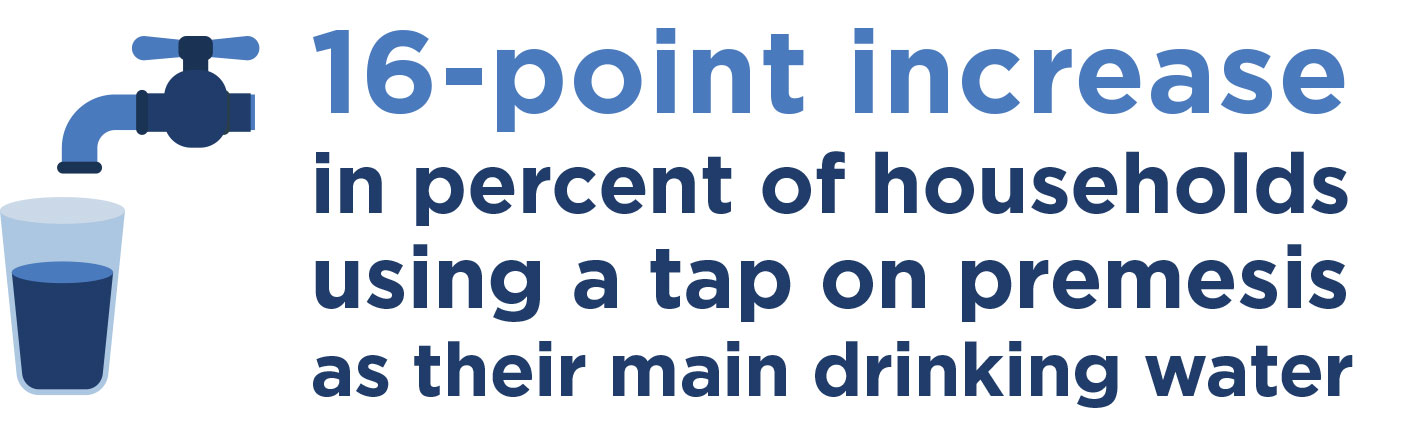
- The rate of new connections increased from an average of about 260 per month pre-intervention to 980 post-intervention. In areas served by Lower Ruvu, households reported significant increases in access to improved drinking water (63 to 85%); 39% of households use a tap on premises as their main drinking water, compared to 23% pre-intervention.
- All households, regardless of connection status have increased their use of DAWASCO water for domestic activities, demonstrating positive spillover effects to unconnected households.
Household Impacts
Consumption
- Supply improvements are associated with increases in consumption. However, other factors appear to be driving overall reductions in consumption for always-connected households, such as new meters and tariff increases.
- For newly connected households, a new connection is associated with a statistically significant increase in total consumption, by about 83 liters per capita per day (LPCD), allowing households to consume at levels recommended for good health.
Hauling
- In the dry season, time spent hauling water significantly decreased to 1.5 hours per week thanks to supply improvements for always connected households compared to baseline. Newly connected households water hauling time decreased by 2 hours per week compared to unconnected households. The evaluation found smaller (but still significant) reductions in the rainy season, potentially due to households’ aversion to increased turbidity at taps and their resulting use of alternative sources in the rainy season.
- As the burden of water hauling falls disproportionately on women, reductions in time spent hauling specifically benefits women as well as children who assist in water hauling.
Water Treatment
- Drinking water treatment has declined among always-connected households compare to baseline. Results show that supply improvements are associated with small but statistically significant reductions in the likelihood of treating drinking water before consuming. This is likely due to increased trust in the system, but the result is not desirable for health, given continued intermittency.
Diarrheal Illness (Objective)
- During the post-intervention period, the prevalence of acute diarrheal illness was 5.4% among all connected households, compared to 14.2% among unconnected households. Among all panel households, prevalence among children under five in the last two weeks did not change, at 11% both pre- and post-intervention.
MCC Learning
- Process evaluations that incorporate an ex-post inspection of the use and maintenance of infrastructure can significantly enhance the usefulness of evaluations of infrastructure interventions. Learning from the Tanzania experience, MCC evaluations are taking a more detailed approach to process evaluations and have incorporated ex-post inspections of infrastructure investments.
- To ensure sustainability of infrastructure investments, utility staff need to be trained adequately on equipment operations and maintenance as part of the handover of infrastructure.
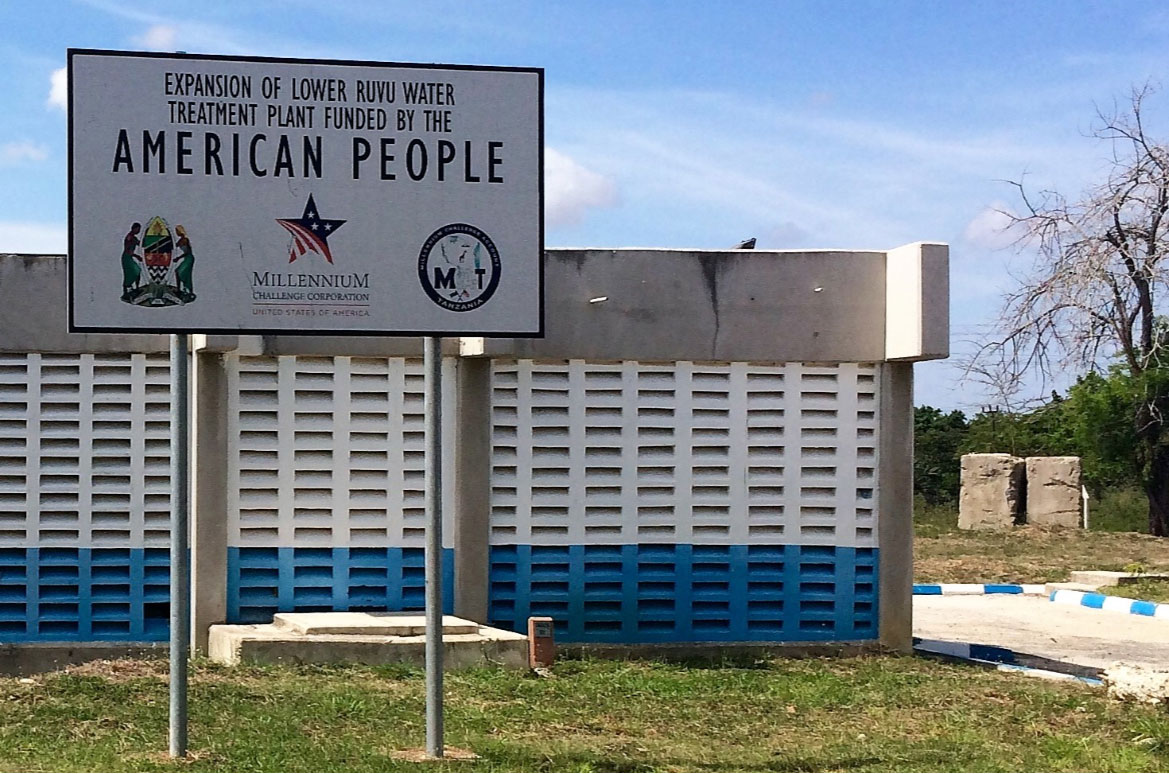
Sign Marking MCC-funded Treatment Plant
Evaluation Methods
The evaluation consisted of a pre-post performance evaluation and a quasi-experimental impact evaluation to measure how water supply changes affected outcomes of interest at the household level. The performance evaluation included a process study that examined project implementation, outputs, and sustainability. The performance and impact evaluations measured one-year impacts of the project at the system and household levels. To determine impacts of supply improvements, the performance evaluation employed two-way fixed effects panel regression to measure household fixed effects, controlling for time-invariant characteristics, and time fixed effects to measure changes between 2015 to 2017 (pre and post intervention). To measure impacts of improved access, the impact evaluation employed coarsened exact matching (CEM) to identify comparable newly connected and still unconnected households. While the evaluation cannot directly measure attribution of the activity to the observed outcomes, due to the significant increases in water supply as a result of the intervention, the evaluator stated that the results are strongly attributable to MCC’s investment.Three rounds of data were collected for this evaluation. The original baseline occurred between April and September 2013, followed by an updated baseline conducted at the close of the Compact between August and November 2015, which was the baseline point of reference for the pre-post comparison. The endline was conducted from September to November 2017 and involved the following data sources:
- Household survey administered to 1481 households in areas served by Lower Ruvu WTP at pre- and post-intervention.
- Independent water quality testing of E. coli and free chlorine residuals at 430 system locations (including turbidity), 262 household taps, 111 public taps, 32 community sources, and 407 at point-of-consumption (407 FHR; 406 E. coli).
- Pressure logging sensors for direct measurement of supply hours placed on 41 household taps one week prior to the household survey and 4 network points for 6-7 weeks.
- Site visits and semi-structured interviews with utility and Lower Ruvu WTP staff.
- Focus group discussions with household beneficiaries, 8 with always-connected households, 4 with newly connected households and 4 with unconnected households.
- Administrative data from the utility collected from DAWSCO’s Monitoring & Evaluation department, the Tanzania Meteorological Agency (TMA), and the Ministry of Health.
2019-002-2230