

Program Overview
MCC’s $295.7 million Namibia Compact (2009-2014) funded the $18.3 Conservancy Support Activity. The activity aimed to build capacity of conservancies – areas where communities living on communal land manage and benefit from the area’s natural resources - to protect natural resources and to increase investment, employment, equitable revenue distribution, and incomes. Sub-activities included a needs assessment, training, and the Conservancy Development Support Grants Fund to support joint ventures with private sector firms and wild animal relocation.
Evaluator Description
MCA Namibia commissioned NORC to conduct an independent final performance evaluation of the Conservancy Support Activity. Full report results and learning: https://data.mcc.gov/evaluations/index.php/catalog/213.
Key Findings
Conservancy Governance
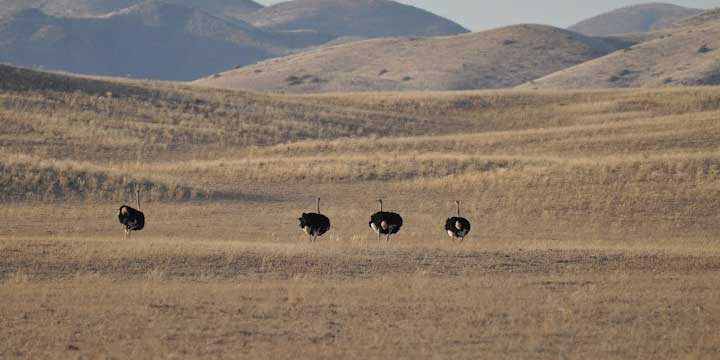
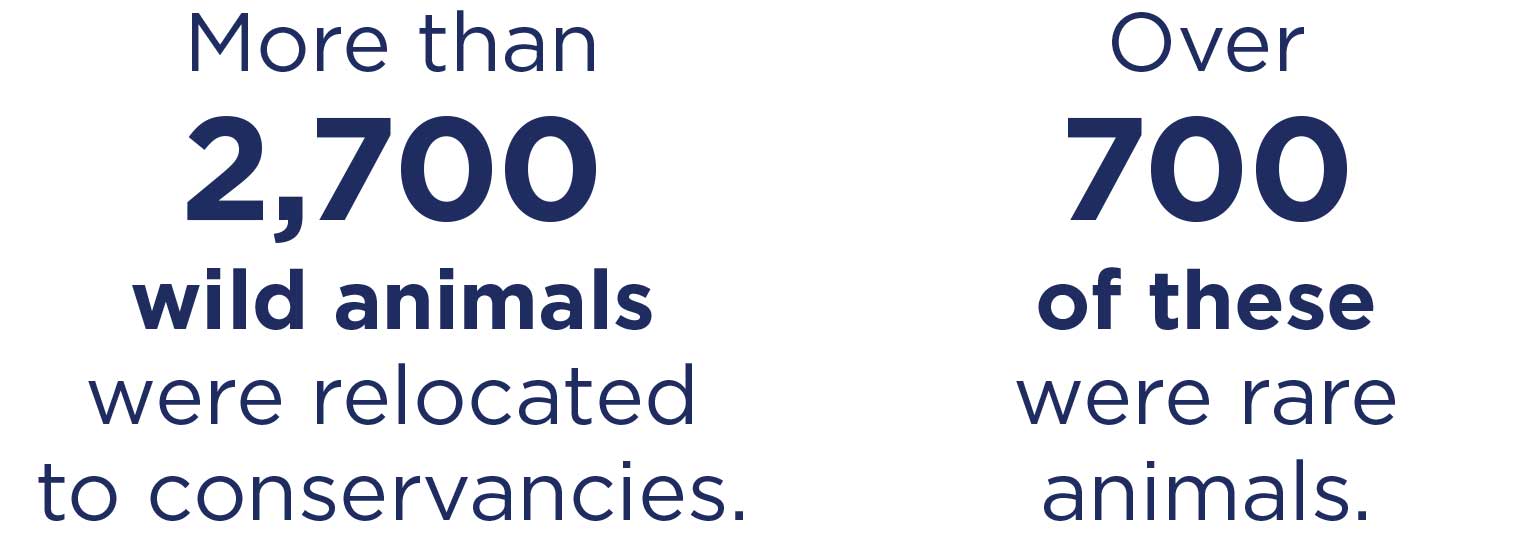
- More than 2,700 wild animals were relocated to conservancies, over 700 of which were rare animals.
- Conservancy management reported training improved financial accounting and reporting, but non-management members reported concerns, such as a lack of transparency on conservancy revenues to inform expected value of revenue distribution benefit.
Investment and Employment
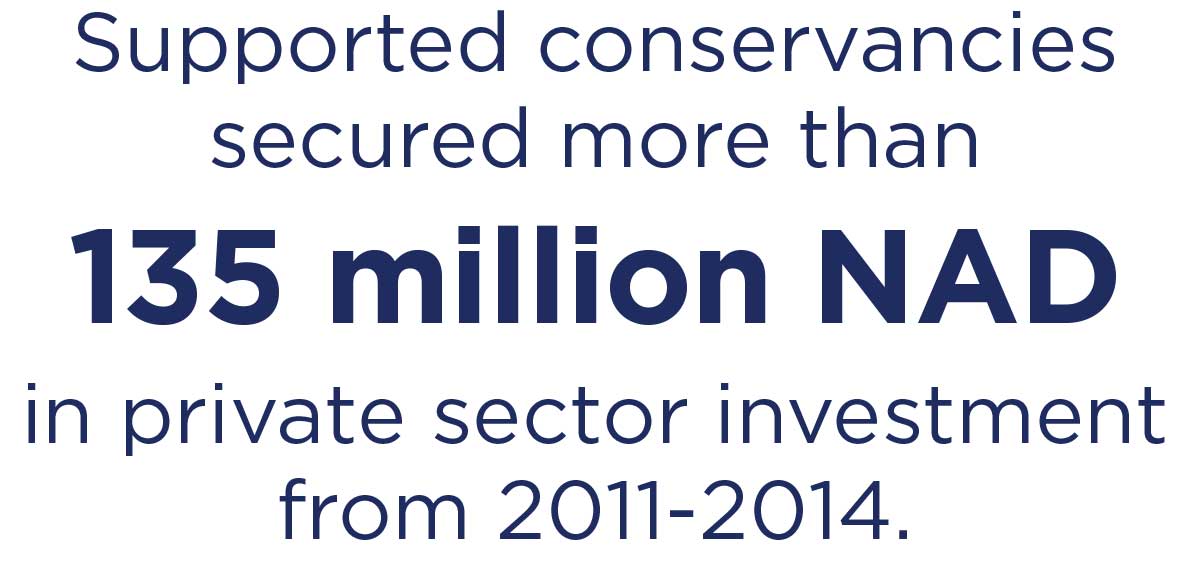
- Supported conservancies secured over 135 million Namibian Dollars (NAD) in private sector investment from 2011-2014.
- The increase in the number of joint ventures led to an increase in conservancy revenues which increased full-time employment.
Revenue Distribution
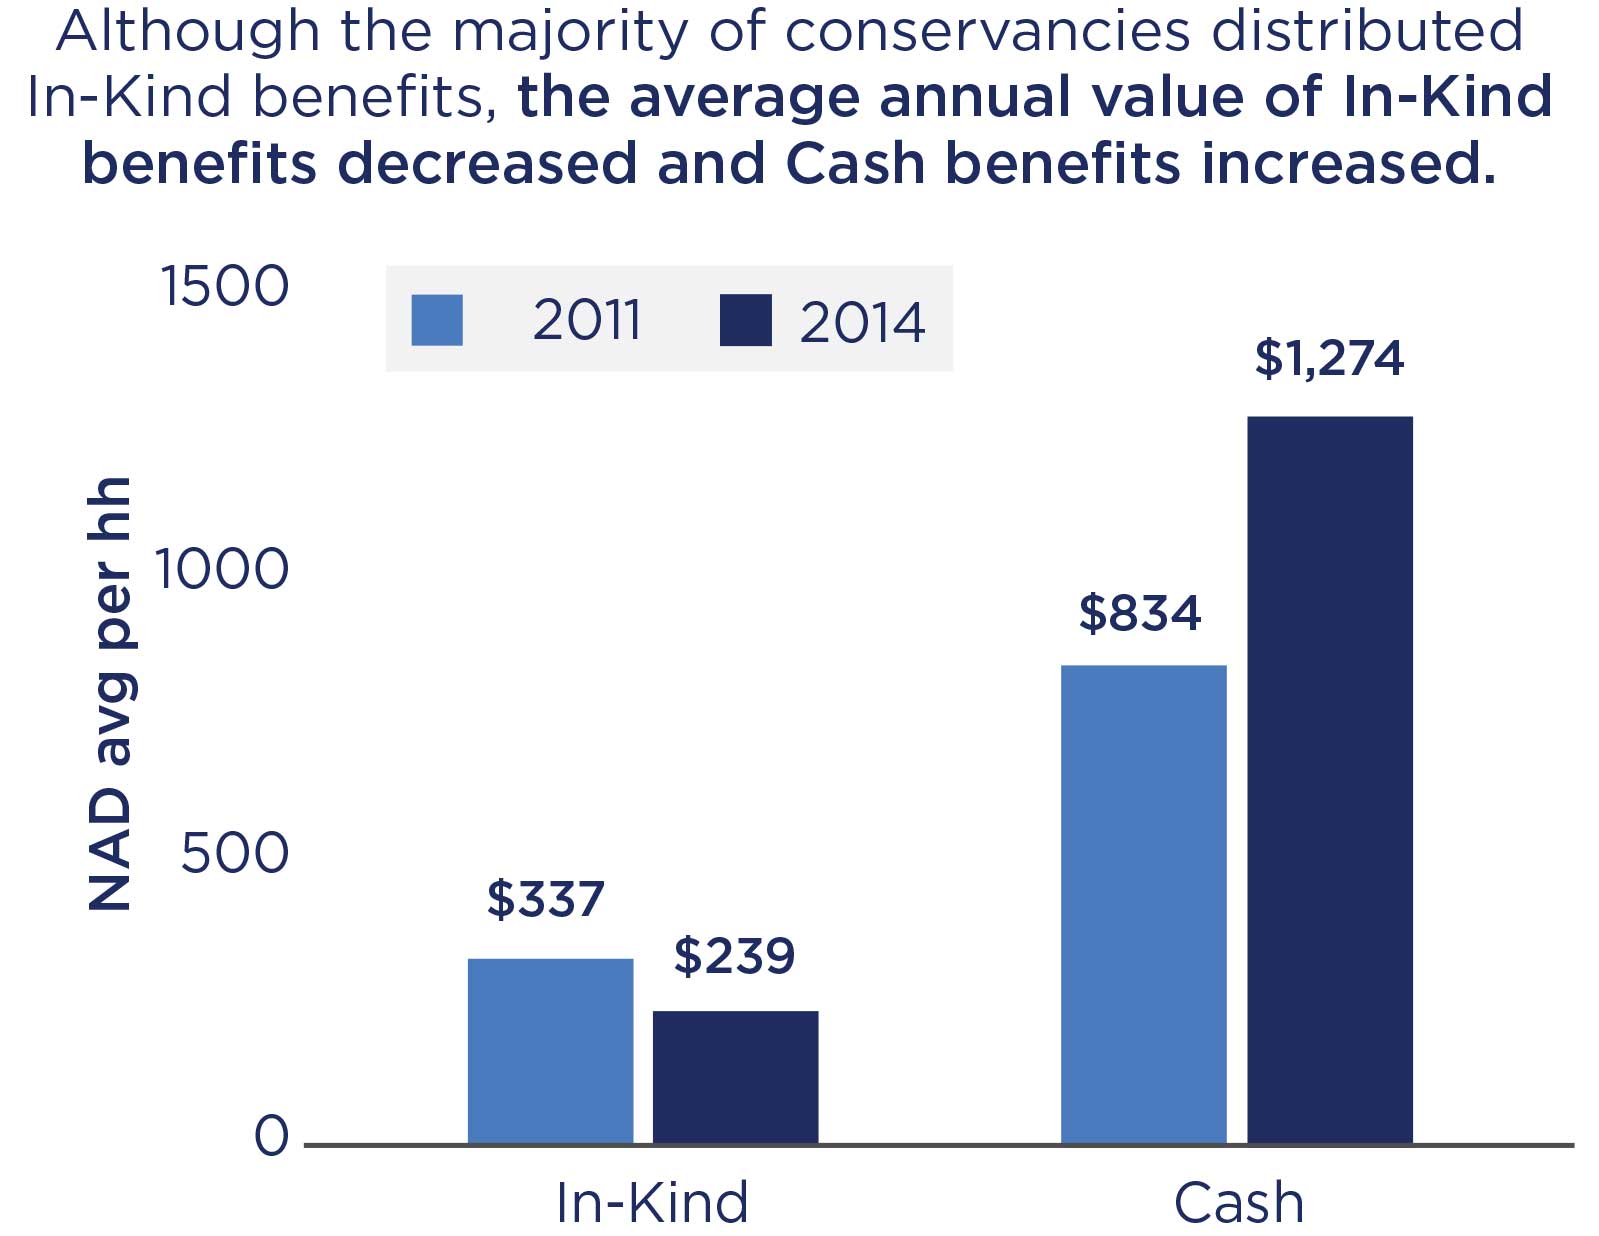
- Most conservancies provide revenue distribution to conservancy member households using cash and in-kind benefits (such as meat); however, the value of in-kind benefits was far lower than cash, and while in-kind values declined from 2011 to 2014, cash values increased substantially.
- The quantitative analysis indicates that conservancies with more members distributed in-kind benefits more equally, while those covering larger areas distributed them less equally.
Household Income and Sustainability
- Analysis suggests households generally did not experience major income or expenditure increases, though the female-headed households did.
- Ongoing conservancy support may be needed to sustain new business partnerships.
Evaluation Questions
This final performance evaluation was designed to answer if training and grant support:
- 1
Improved conservancy governance? - 2
Increased investment and employment? - 3
Increased equitable distribution of revenues? - 4
Increased household income? - 5
Demonstrated sustainability?
Detailed Findings
Conservancy Governance
The activity was implemented by the World Wildlife Fund and supported 31 of 76 conservancies, which are areas where community members living on communal land are empowered by the government to manage and benefit from the area’s natural resources. The training provided to conservancy management and non-management members covered a diverse range of topics based on relevance and perceived need. Animal relocations had multiple benefits for game viewing, tourism and hunting, and enhanced conservation. However, increased animal populations also increased the presence of predators, which could have negative implications for conservancy members.
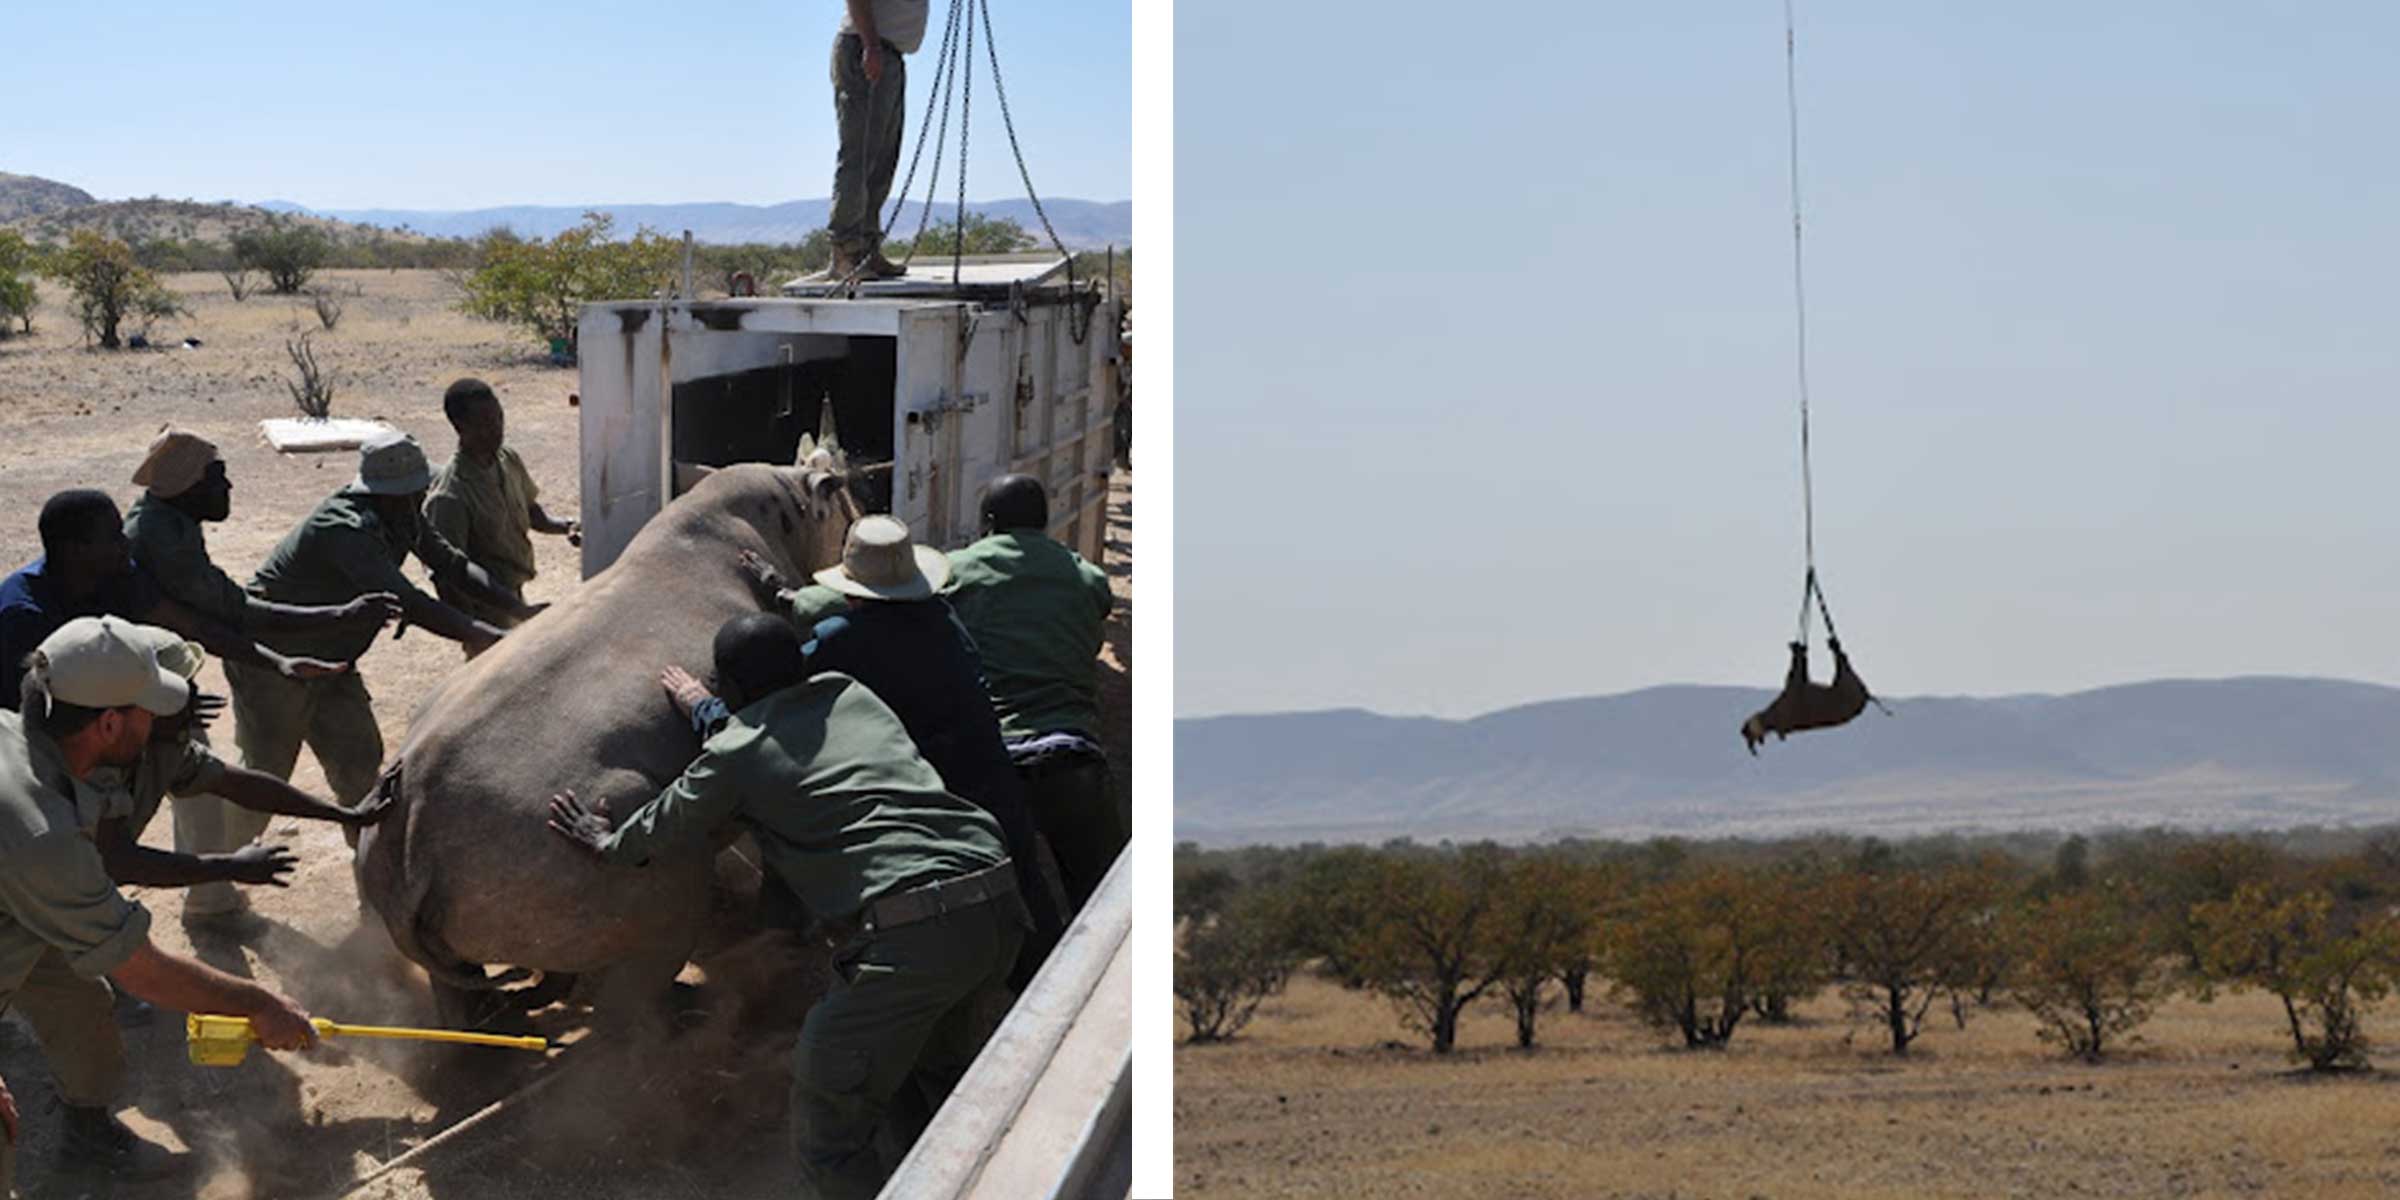
Relocation of rhinoceros.
Investment and Employment
The activity established 15 joint ventures and 13 new enterprises during the program. Qualitative results indicate joint-venture grants for lodges and animal relocations were important for business partnerships. Considered less critical to increasing business partnerships were the human wildlife conflict grants and technical assistance, which had high transaction costs. Both the number of joint ventures and the level of conservancy revenues were positively correlated with full-time employment separately, with the former operating through the later, while small- and medium-sized enterprise grants were not correlated with full- or part-time employment.
Revenue Distribution
20 percent of conservancy member households received revenue distribution through cash benefits, 40 percent received in-kind benefits, 15 percent received both, and 25 percent received none. For some conservancies, there was less meat distributed because the areas were zoned for tourism and wildlife management for the activity.
Household Income and Sustainability
Conservancy revenue distribution and employment did not yield major well-being improvements overall. Yet, the households that were female-headed did experience increased expenditure and income. However, women still have lower average incomes than men. The evaluation noted that conservancies would require ongoing support beyond the program for the indefinite future given the complexity of partnerships established.
MCC Learning
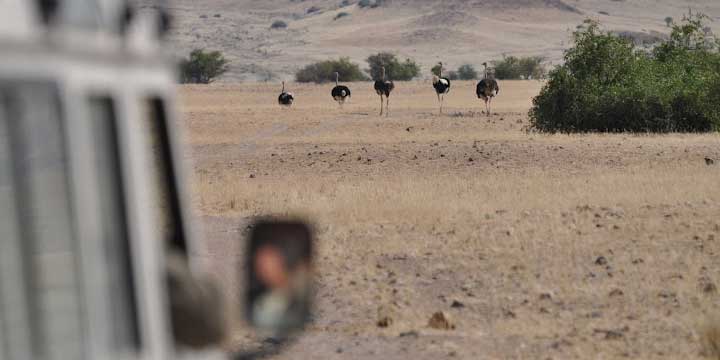
Ostrich relocation efforts.
To build sustainable business partnerships, separate the roles of conservancy managers from enterprise managers to help with continuity and increase capacity building on business skill development.
MCC-funded evaluations need to follow MCC’s evaluation standards. MCC’s Evaluation Management Guidance was developed after this evaluation started. The guidance aims to ensure MCC funded evaluations are worth their costs and protect against some challenges encountered here including, for example, issuing evaluation contracts that fail to consider or require measuring key outcomes at appropriate times and collecting primary data for an evaluation before an evaluator has been contracted.
Evaluation Methods
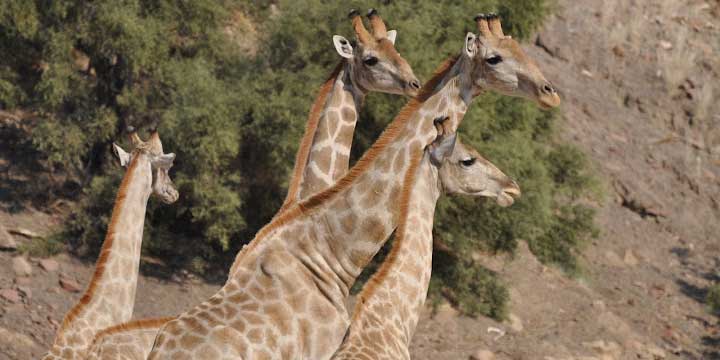
Giraffes in a communal conservancy.
Activities began in November 2010, giving an exposure period of 0-42 months.
The performance evaluation used pre-post methodology, relying on both qualitative and quantitative data collected in July 2011, July-August 2013, and May 2014:
- Quantitative analysis using household survey data collected on 1032 households in 2011 and 1024 households in 2014, which formed a panel of 783 households.
- 40 focus groups were conducted with conservancy members across 2013 and 2014.
- 20 key informant interviews were conducted with implementing entities, private sector, public sector, and conservation leaders across 2013 and 2014.
Due to timing and data limitations, the evaluation did not measure the following benefit streams that were modeled in the cost-benefit analysis of the program: (i) value of increases in animal populations; (ii) conservancy revenues; and (iii) total benefits from joint ventures.
2020-002-2434