

Program Overview
MCC’s $547 million Ghana Compact (2007–2012) funded the $228 million Transportation Project, which upgraded 14 km of the N1 highway in Accra and 75 km of the Agogo-Dome Trunk Road and constructed two ferries in the Afram Basin Zone. Additionally, the $71 million Feeder Road Activity (part of the $189 million Agriculture Project) rehabilitated 357 km of feeder roads across Ghana. The Transportation Project aimed to reduce transportation costs affecting agricultural commerce, and the Agriculture Project aimed to expand commercial agriculture for smallholder farmers.
Evaluator Description
MCC commissioned Mathematica to conduct an independent final performance evaluation of the Transportation Project and an independent final impact evaluation of the Feeder Roads Activity. Full report results and learning: https://data.mcc.gov/evaluations/index.php/catalog/219.
Key Findings
Transportation Costs and Traffic Growth
- Road upgrades reduced transportation costs for all MCC road investments in the Ghana Compact and substantially reduced traffic congestion on the N1 Highway.
- Traffic volume grew more in areas with high economic growth.
- Road users along the N1 Highway are mostly commuters; users of other roads include those traveling for work or leisure.
Transportation Markets
- There is some evidence of increased competition in freight and passenger transport, through an increase in the frequency of service and more modes of transport, leading to lower transport prices and generally better transportation outcomes.
- Regulation limits the extent to which transportation cost reductions are passed on to road users through lower fares, especially to bus riders.
Road Condition and Maintenance
- Road maintenance needs far exceed funds available for maintenance.
- The N1 Highway has remained in very good condition, whereas some feeder roads and sections of the Agogo-Dome Trunk Road have shown rapid deterioration.
Impact of Feeder Roads
- Communities along improved roads, where the majority of trips start and/or end, experienced greater asset growth compared to those along unimproved ones. This seems to be as a result of greater access to markets.
Evaluation Questions
This final impact and performance evaluation was designed to answer the following questions:- 1 Were transportation costs reduced? How is the road being used, and how has this changed since before the investment? What is the current traffic on the ferries?
- 2 What is the likelihood that VOC savings will be passed on to consumers of transportation services?
- 3 What is the likelihood that the roads will be maintained?
- 4 What was the impact of the feeder road improvements on income?
Detailed Findings
Transportation Costs and Traffic Growth
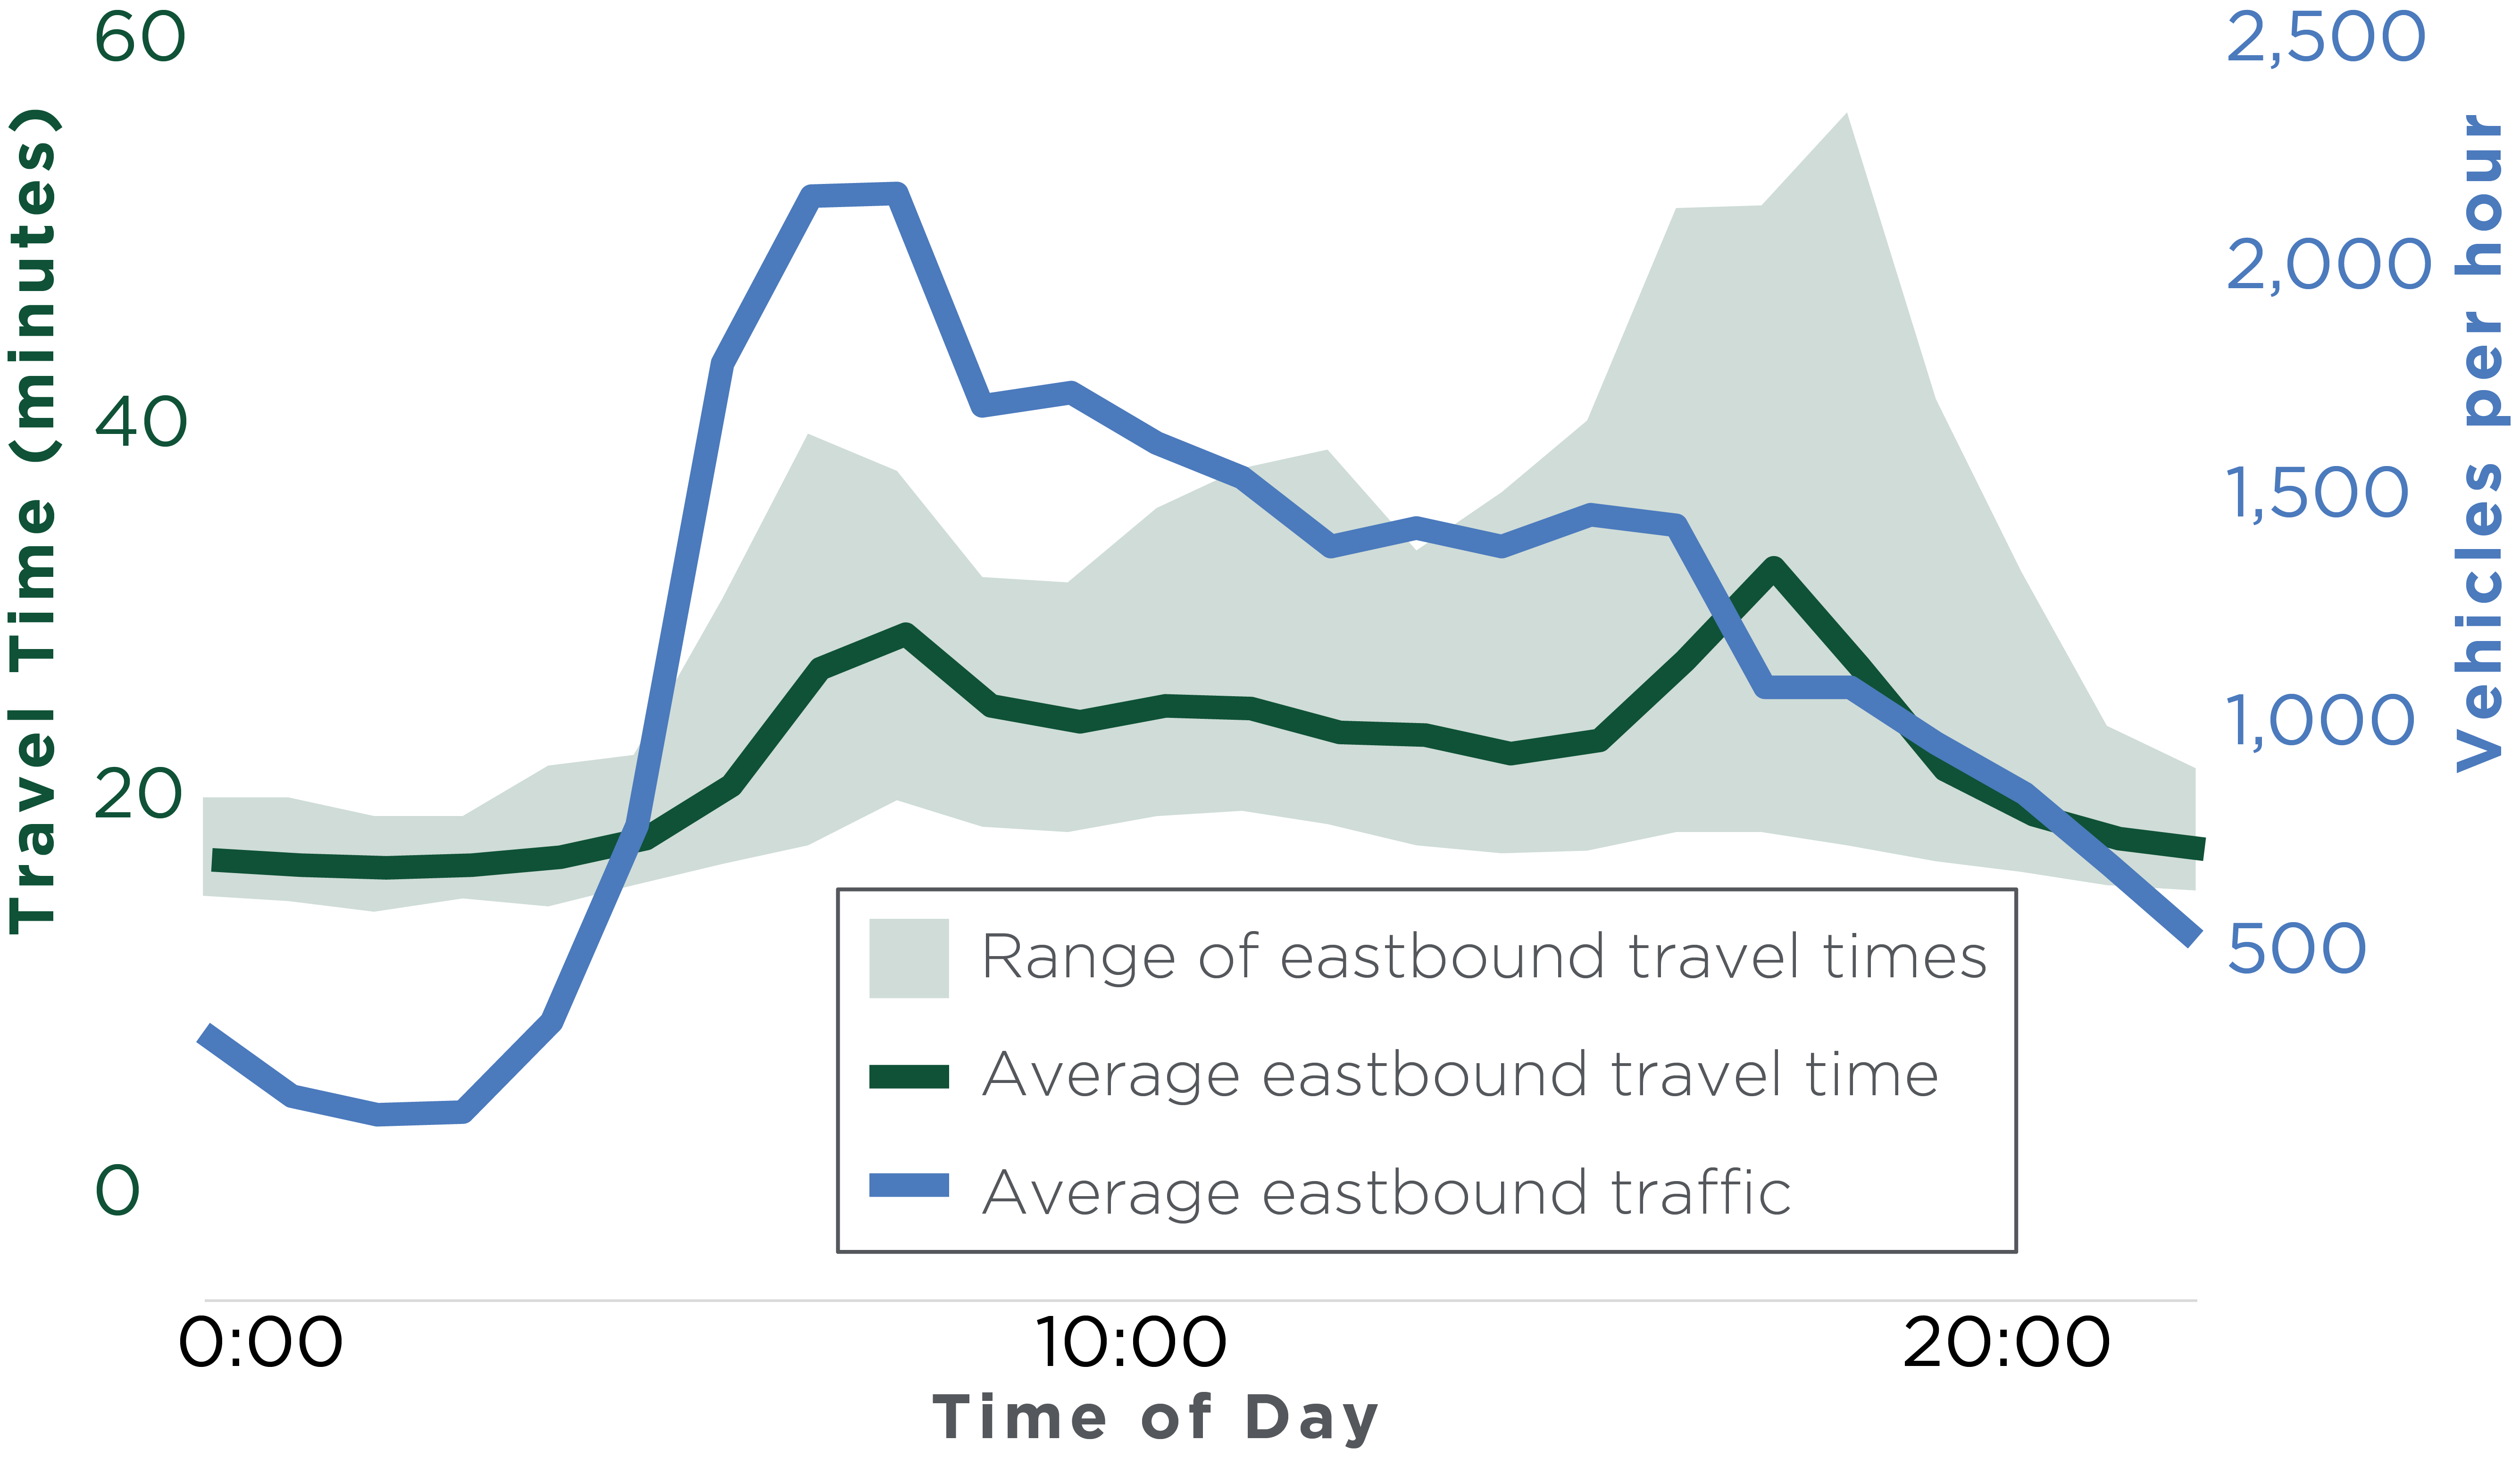
Travel times on N1 Highway
The upgrade increased the width of the Agogo-Dome Trunk Road from 3–7 meters to 10 meters and reduced the roughness from 9–12 m/km to 4.8 m/km. Survey respondents reported that traveling the 16 kilometers between Agogo and the town of Ananekrom takes between 15 and 30 minutes by car or motorcycle, compared with about two hours before the road was improved. Furthermore, road users can now travel on the road year-round. Although travel time remains faster than before the upgrade, it has slowed since 2013 at points near Dome due to premature road deterioration. Traffic increased immediately after the road’s completion and has continued to increase since. The most dramatic increases have been in motorcycle traffic. Interestingly, bus traffic decreased, possibly because more individualized transportation options such as motorcycles and cars became more affordable alternatives. More than two-thirds of road users were traveling for work, with goods, and/or for passenger transport, and 16 percent were traveling for leisure or social activities.
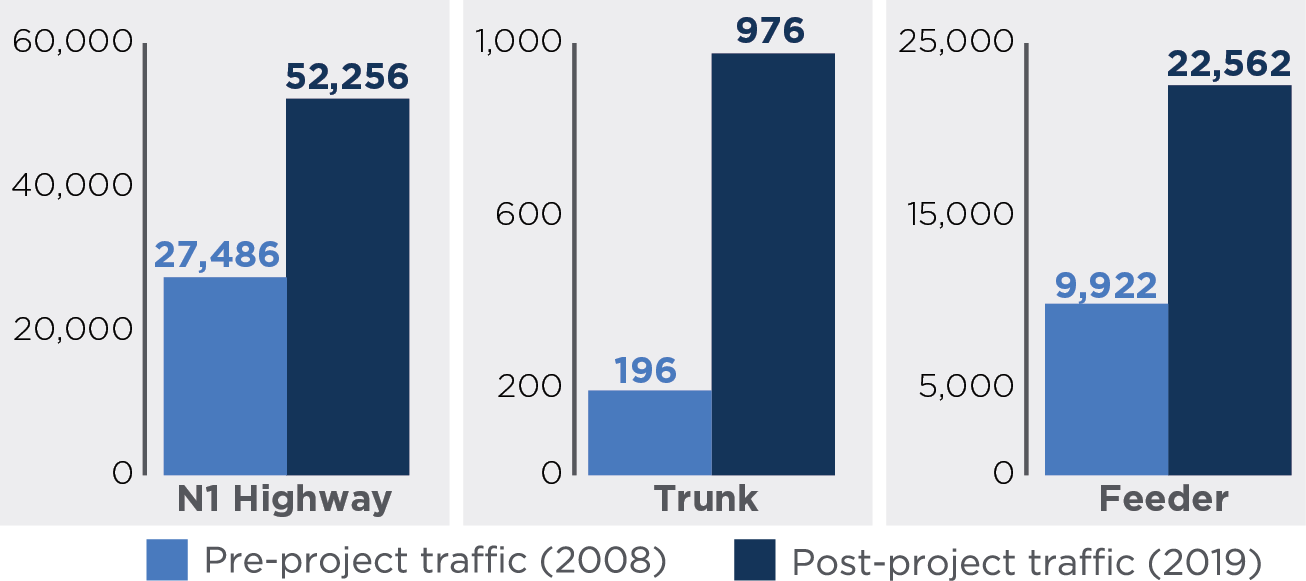
Traffic growth along N1 Highway, Agogo-Dome Trunk Road and sampled feeder roads
Transportation Markets
Bus fares are set by the Ministry of Transportation, limiting the extent to which transportation cost reductions are passed down to bus riders through fares. Instead, they are likely passed down through reduced wait times and increased frequency of service. The cost of individual transport services (taxi, motorcycle taxi, Uber) and freight transport remained more stable as competition grew. Across all the roads, there are more types of vehicles and more modes of transportation serving the freight and passenger markets. More than two-thirds of road users across the different types of roads reported having more transportation options now than before the road was improved.Road Condition and Maintenance
In Ghana, roads maintenance is funded through the Ghana Road Fund, which meets around 65 percent of maintenance needs across the entire Ghanaian road network each year. This means that the government needs to prioritize some roads over others. The Ghana Highway Authority (GHA) maintains the N1 Highway and the Agogo-Dome Trunk Road. The N1 Highway’s status as a major priority of the Ghanaian government, evidence of routine and emergency maintenance implemented so far, and its current condition indicate that the road will likely be maintained well and the reductions in transportation costs sustained. GHA did not take over maintenance of the Agogo-Dome Trunk Road until 2017. The road has deteriorated in some parts. Approximately 17 km of the total 75 km are in poor or very poor condition, defined as having a roughness greater than 5.5 m/km, though this may be the result of localized construction challenges such as weak soil as opposed to a lack of maintenance. The Department of Feeder Roads has not been able to adequately maintain the improved roads, resulting in deterioration on some feeder roads. Currently, approximately 43 percent are in poor or very poor condition, defined as having roughness greater than 5.5 m/km for a paved road and roughness greater than 9.5 m/km for a gravel road.Impact of Feeder Roads
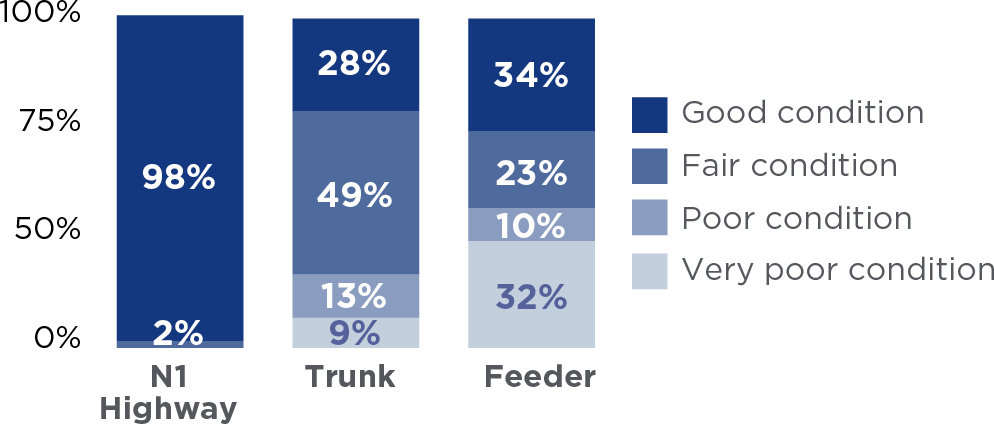
Percent of road length by project and condition in 2018
Economic Rate of Return
MCC considers a 10 percent economic rate of return (ERR) as the threshold to proceed with investment.- 36% (N1) 17% (Trunk) 18% (Feeder) Original ERR
- 22.6% (N1) 4.9% (Trunk) .4% (Feeder) Evaluation-Based ERR
MCC Learning
- Do not force investments to fit into one stated objective and associated project or theory of change when they logically do not—separate into a different project.
- Manage projects carefully during implementation to avoid cost increases.
- Use caution when relying on complementary investments from funding sources external to MCC.
- Do not expect full maintenance to occur, especially on roads that are not high priority/high profile for the country.
Evaluation Methods
The performance evaluation included modeling (using HDM-4), pre-post, and ex-post methodologies. Quantitative data collection included surveys of axle loading (1,385 vehicles), vehicle intercept (5,015 drivers and 497 passengers), road roughness (all 446 km), surface condition (all 446 km network level, 10 percent in detail), vehicle operation cost (64 businesses), a geotechnical survey of at least one location per road, and traffic counts (15 locations). Qualitative data collection included 36 focus group discussions with road users and 15 key informant interviews. Administrative data on road maintenance funds and ferry traffic were also used. The impact evaluation of the feeder roads used a difference-in-differences methodology using daytime and nighttime lights satellite imagery data from the Defense Meteorological Satellite Program, the Ghanaian Demographic and Health Survey, and geospatial location data of the road network. The exposure period was 84–96 months (six to seven years).2020-002-2345