

Program Overview
MCC’s $177.7 million Armenia Compact (2006–2011) funded the $153.7 million Irrigated Agriculture Project, which included the $121.5 million Irrigation Infrastructure Activity to improve the quantity and reliability of irrigation water. The activity was designed on the theory that improved irrigation infrastructure coupled with the Water-to-Market Activity (training in agricultural practices, increased access to credit, improved capacity of the water user associations, and improved marketing opportunities) would prepare and encourage farmers to shift production to higher-value agriculture, thereby increasing profits and income.
Evaluator Description
MCC commissioned Mathematica to conduct an independent final impact and performance evaluation of the Irrigation Infrastructure Activity and components of the Water-to-Market Activity. Full report results and learning: https://data.mcc.gov/evaluations/index.php/catalog/116.
Key Findings
Quantity and Reliability of Irrigation Water
- Farmers whose tertiary canals were rehabilitated reported timeliness and quantity of irrigation water had improved relative to the comparison group, but farmers whose large infrastructure, such as pumping stations and main canals, was rehabilitated did not.
Use of New Practices and Agricultural Productivity
- Rehabilitating irrigation infrastructure did not increase the amount of land that was irrigated, nor did it lead to increased agricultural production relative to the comparison group. However, there were modest impacts on irrigation intensity for some types of land.
- For communities that received Water-to-Market training, there was no evidence that initially low adoption rates of on-farm water management or high-value agriculture practices increased over time.
Income and Poverty
Sustainability of Irrigation Improvements
Evaluation Questions
This final impact and performance evaluation was designed to answer the following questions.
- 1
Did the program affect the quantity and reliability of irrigation water provided to Armenian farmers? - 2
Did farmers adopt new agricultural practices as a result of the program? Did the program affect agricultural productivity? - 3
Did the program improve household well-being for farmers served by the rehabilitated infrastructure, especially income and poverty? - 4
Is there evidence that the infrastructure investments will be sustained after rehabilitation was complete?
Detailed Findings
These findings build upon the Water-to-Market evaluation report final results published in 2013.
Quantity and Reliability of Irrigation Water
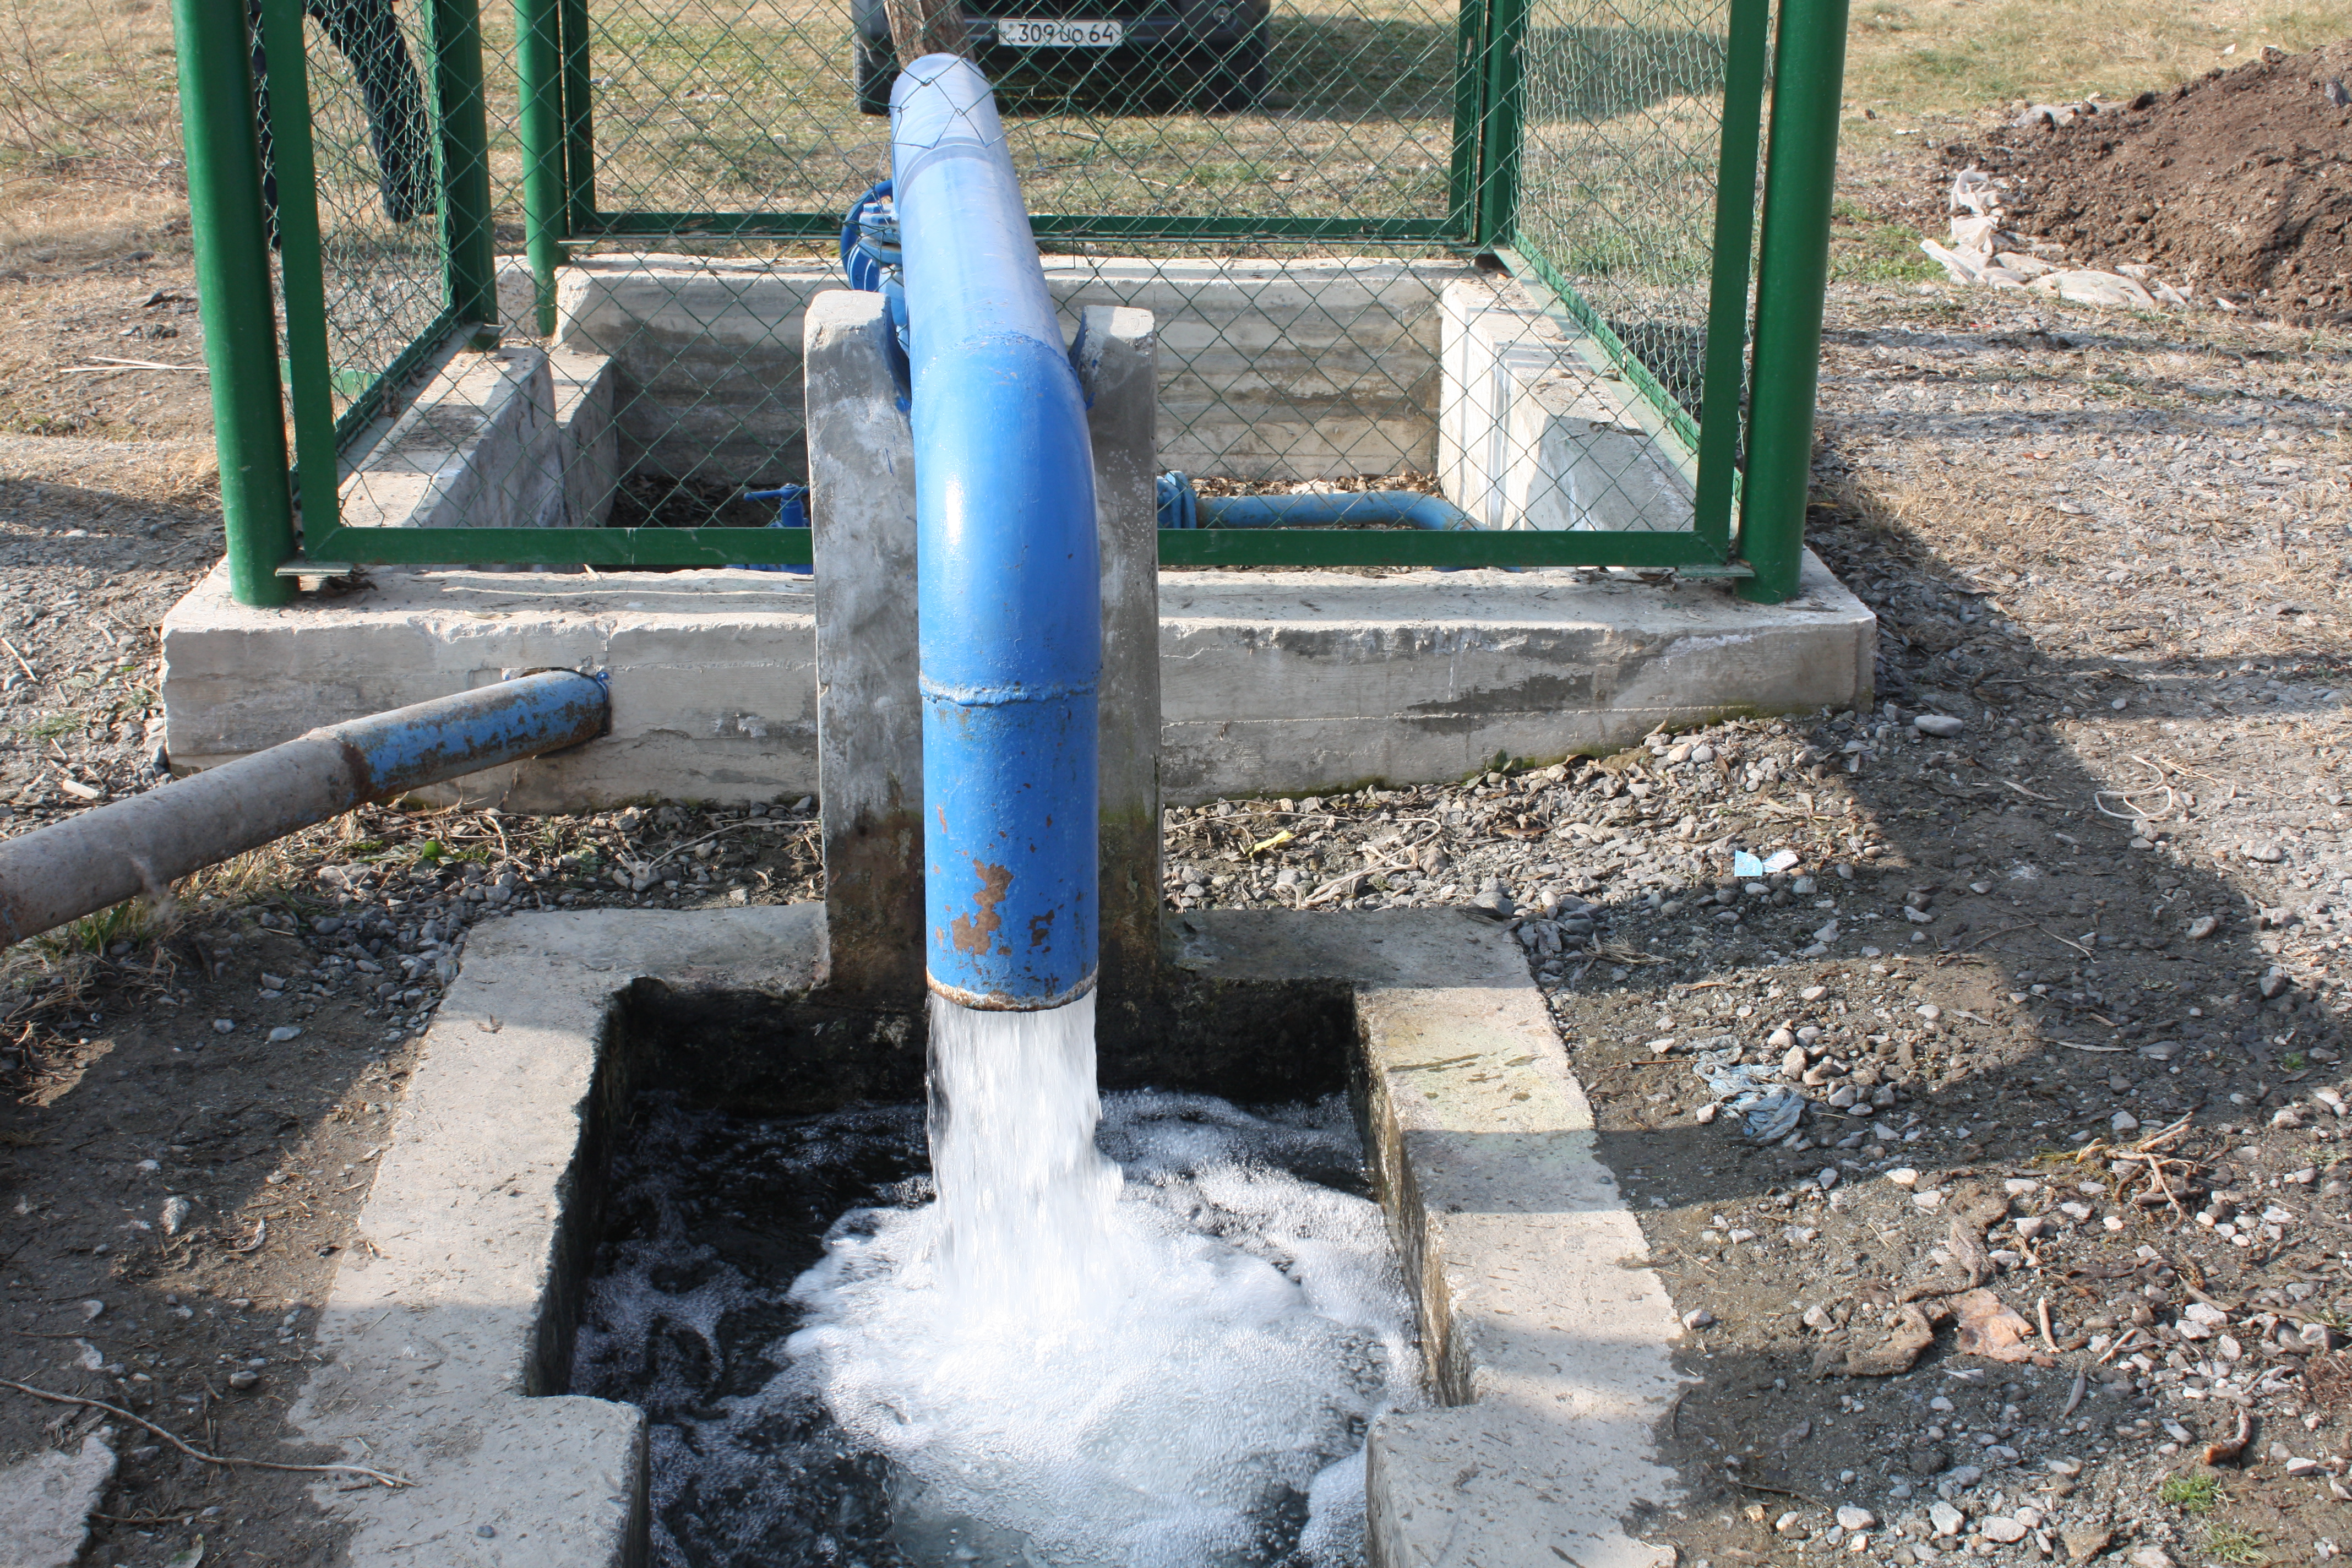
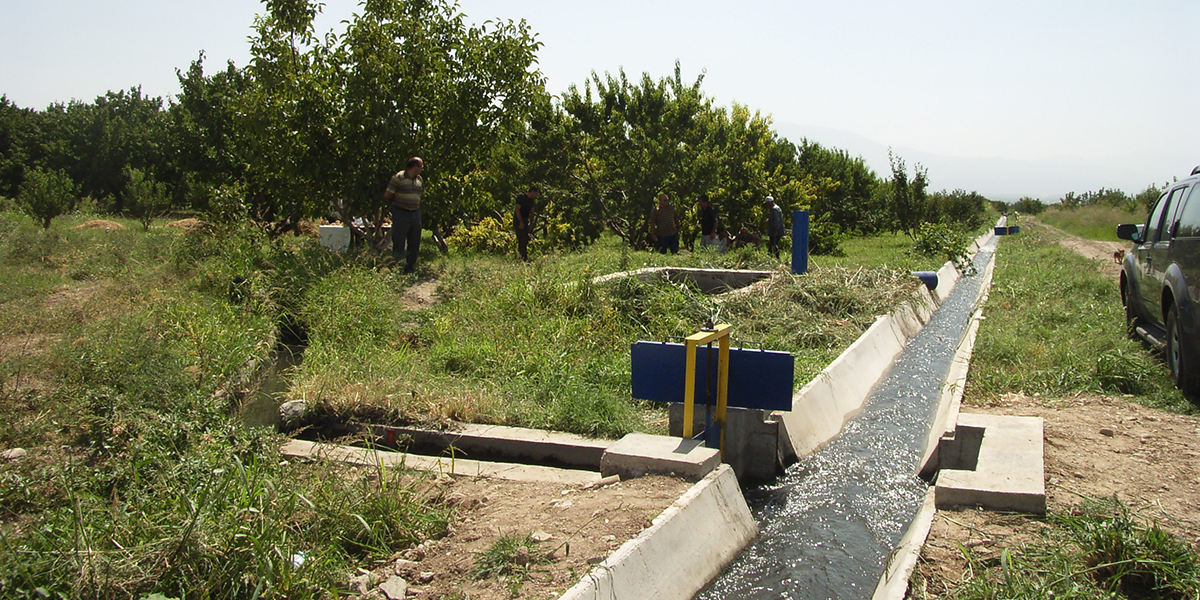
Water flowing into an improved irrigation system
By September 2011, 220 km of tertiary canals, 42 km of main canals, 17 pumping stations, five gravity schemes, and 13 drainage systems were rehabilitated, affecting around 300 communities and more than 420,000 rural household members.
For the tertiary canal analysis, farmers in the treatment group were 13 percentage points more likely than farmers in the comparison group to report the system’s condition to be good or very good. For large infrastructure such as pumping stations and main canals, there was no reported difference in irrigation system conditions between farmers in the treatment and comparison groups.
Forty-one percent of farmers in the tertiary canal treatment group reported that timeliness or quantity of irrigation water had improved over the past five years, compared with 19 percent of the tertiary canal comparison group. Tertiary canal farmers were also significantly less likely than the comparison group to report that the timeliness and quantity had become worse. By contrast, for the large infrastructure, the treatment group was significantly less likely to report that timeliness or quantity of irrigation water had improved relative to the comparison group.
Use of New Practices and Agricultural Productivity
Relative to the comparison group, rehabilitating irrigation infrastructure did not increase the amount of land that was irrigated. For some types of land, there were modest impacts on duration and irrigation intensity. Arable land and kitchen plots received 4.6 and 2.6 more hours, respectively, of irrigation per week from improved tertiary canals relative to the comparison group, but there was no detectable increase in yields.
Rehabilitating irrigation infrastructure did not increase agricultural production relative to the comparison group. The average annual tonnage of production and the market value of production were similar for the tertiary canal treatment and comparison group, and for the large infrastructure analysis, the estimate was negative.
In 2010, there was no evidence of an increase in the adoption of on-farm water management and high-value agriculture practices in communities that received Water-to-Market training in 2008. Possible reasons for lower-than-expected impacts could be that farmers had behavioral inertia, farmers lacked funds to invest in new crops or technologies, farmers viewed investments as too risky, and/or system functionality was not as good as expected.
Income and Poverty
On average, farmers earn more than twice as much from nonagricultural work compared with net agricultural profits. Farmers did not adopt new practices or change crops as expected. Changing crops or investing in new technologies is a bigger behavioral change because it entails deciding to place greater emphasis on farming as a main activity.
Sustainability of Irrigation Improvements
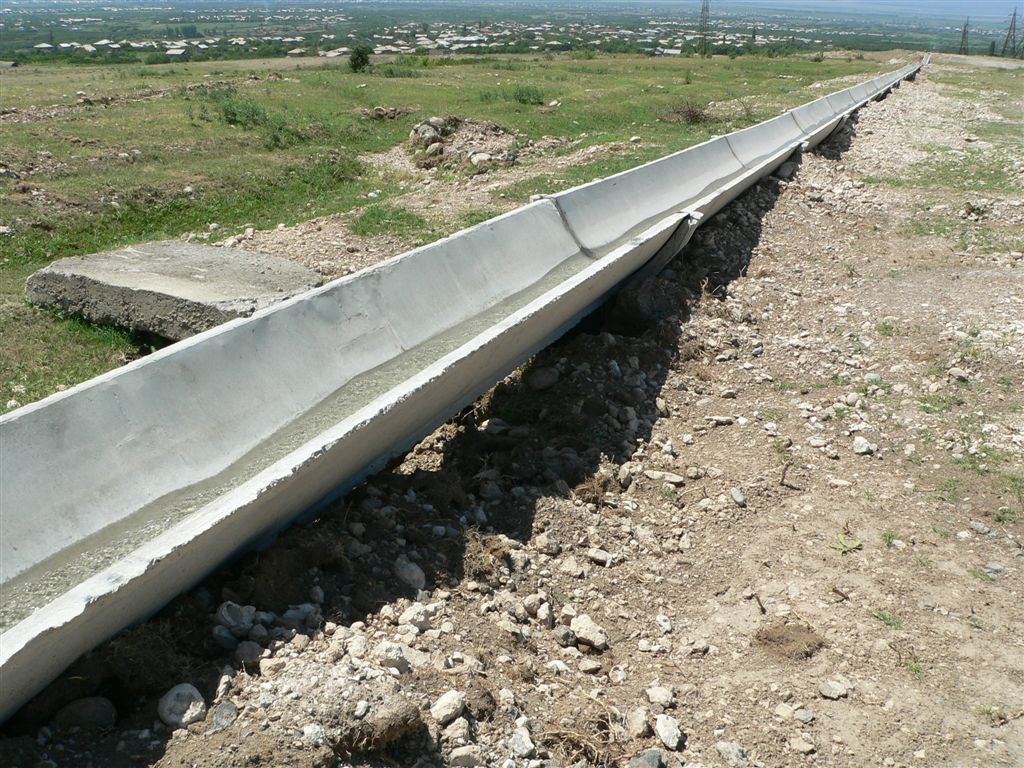
An improved tertiary canal
Forty-four percent of water user association directors believed that the MCC-funded projects lowered their operation costs. Water user association directors reported that no additional repairs were required for the MCC-funded infrastructure.
The analysis of the time trends suggests that water user associations are unlikely to become financially self-sufficient in the near future without additional intervention. Revenues and expenditures have shown modest improvements since 2007, but the service fee collection rates and cost recovery rates appear to have plateaued after 2009.
Economic Rate of Return
MCC considers a 10 percent economic rate of return (ERR) as the threshold to proceed with investment.
Although the evaluator did not recalculate the ERR, they provided feedback on the validity of the Irrigation Infrastructure Activity ERR produced by MCC in 2008 in light of the evaluation findings.
MCC’s 2008 ERR of 24 percent projected immediate impacts of the irrigation rehabilitation on households’ agricultural income due to greater access to and reliability of irrigation water, but this was not detected by the evaluation. In addition, there was no significant evidence of changing water use behavior, adoption of new agricultural practices, or planting of new crops. This suggests that the actual ERR was not as large as the 2008 prediction.
MCC Learning
Root cause analysis is critical to successful project design, especially where behavior change is integral to the program logic.
Supporting the development of new institutions such as water user associations is inherently difficult and can be a long-term undertaking. MCC projects should account for the five-year timeline and anticipate necessary follow-on activities.
During a project rescoping, the program logic, economic analysis, potential beneficiaries, and evaluation plan should be reassessed cohesively by a coordinated project team.
Better water monitoring tools could help water user associations while providing a better measurement of outcomes.
Evaluation Methods
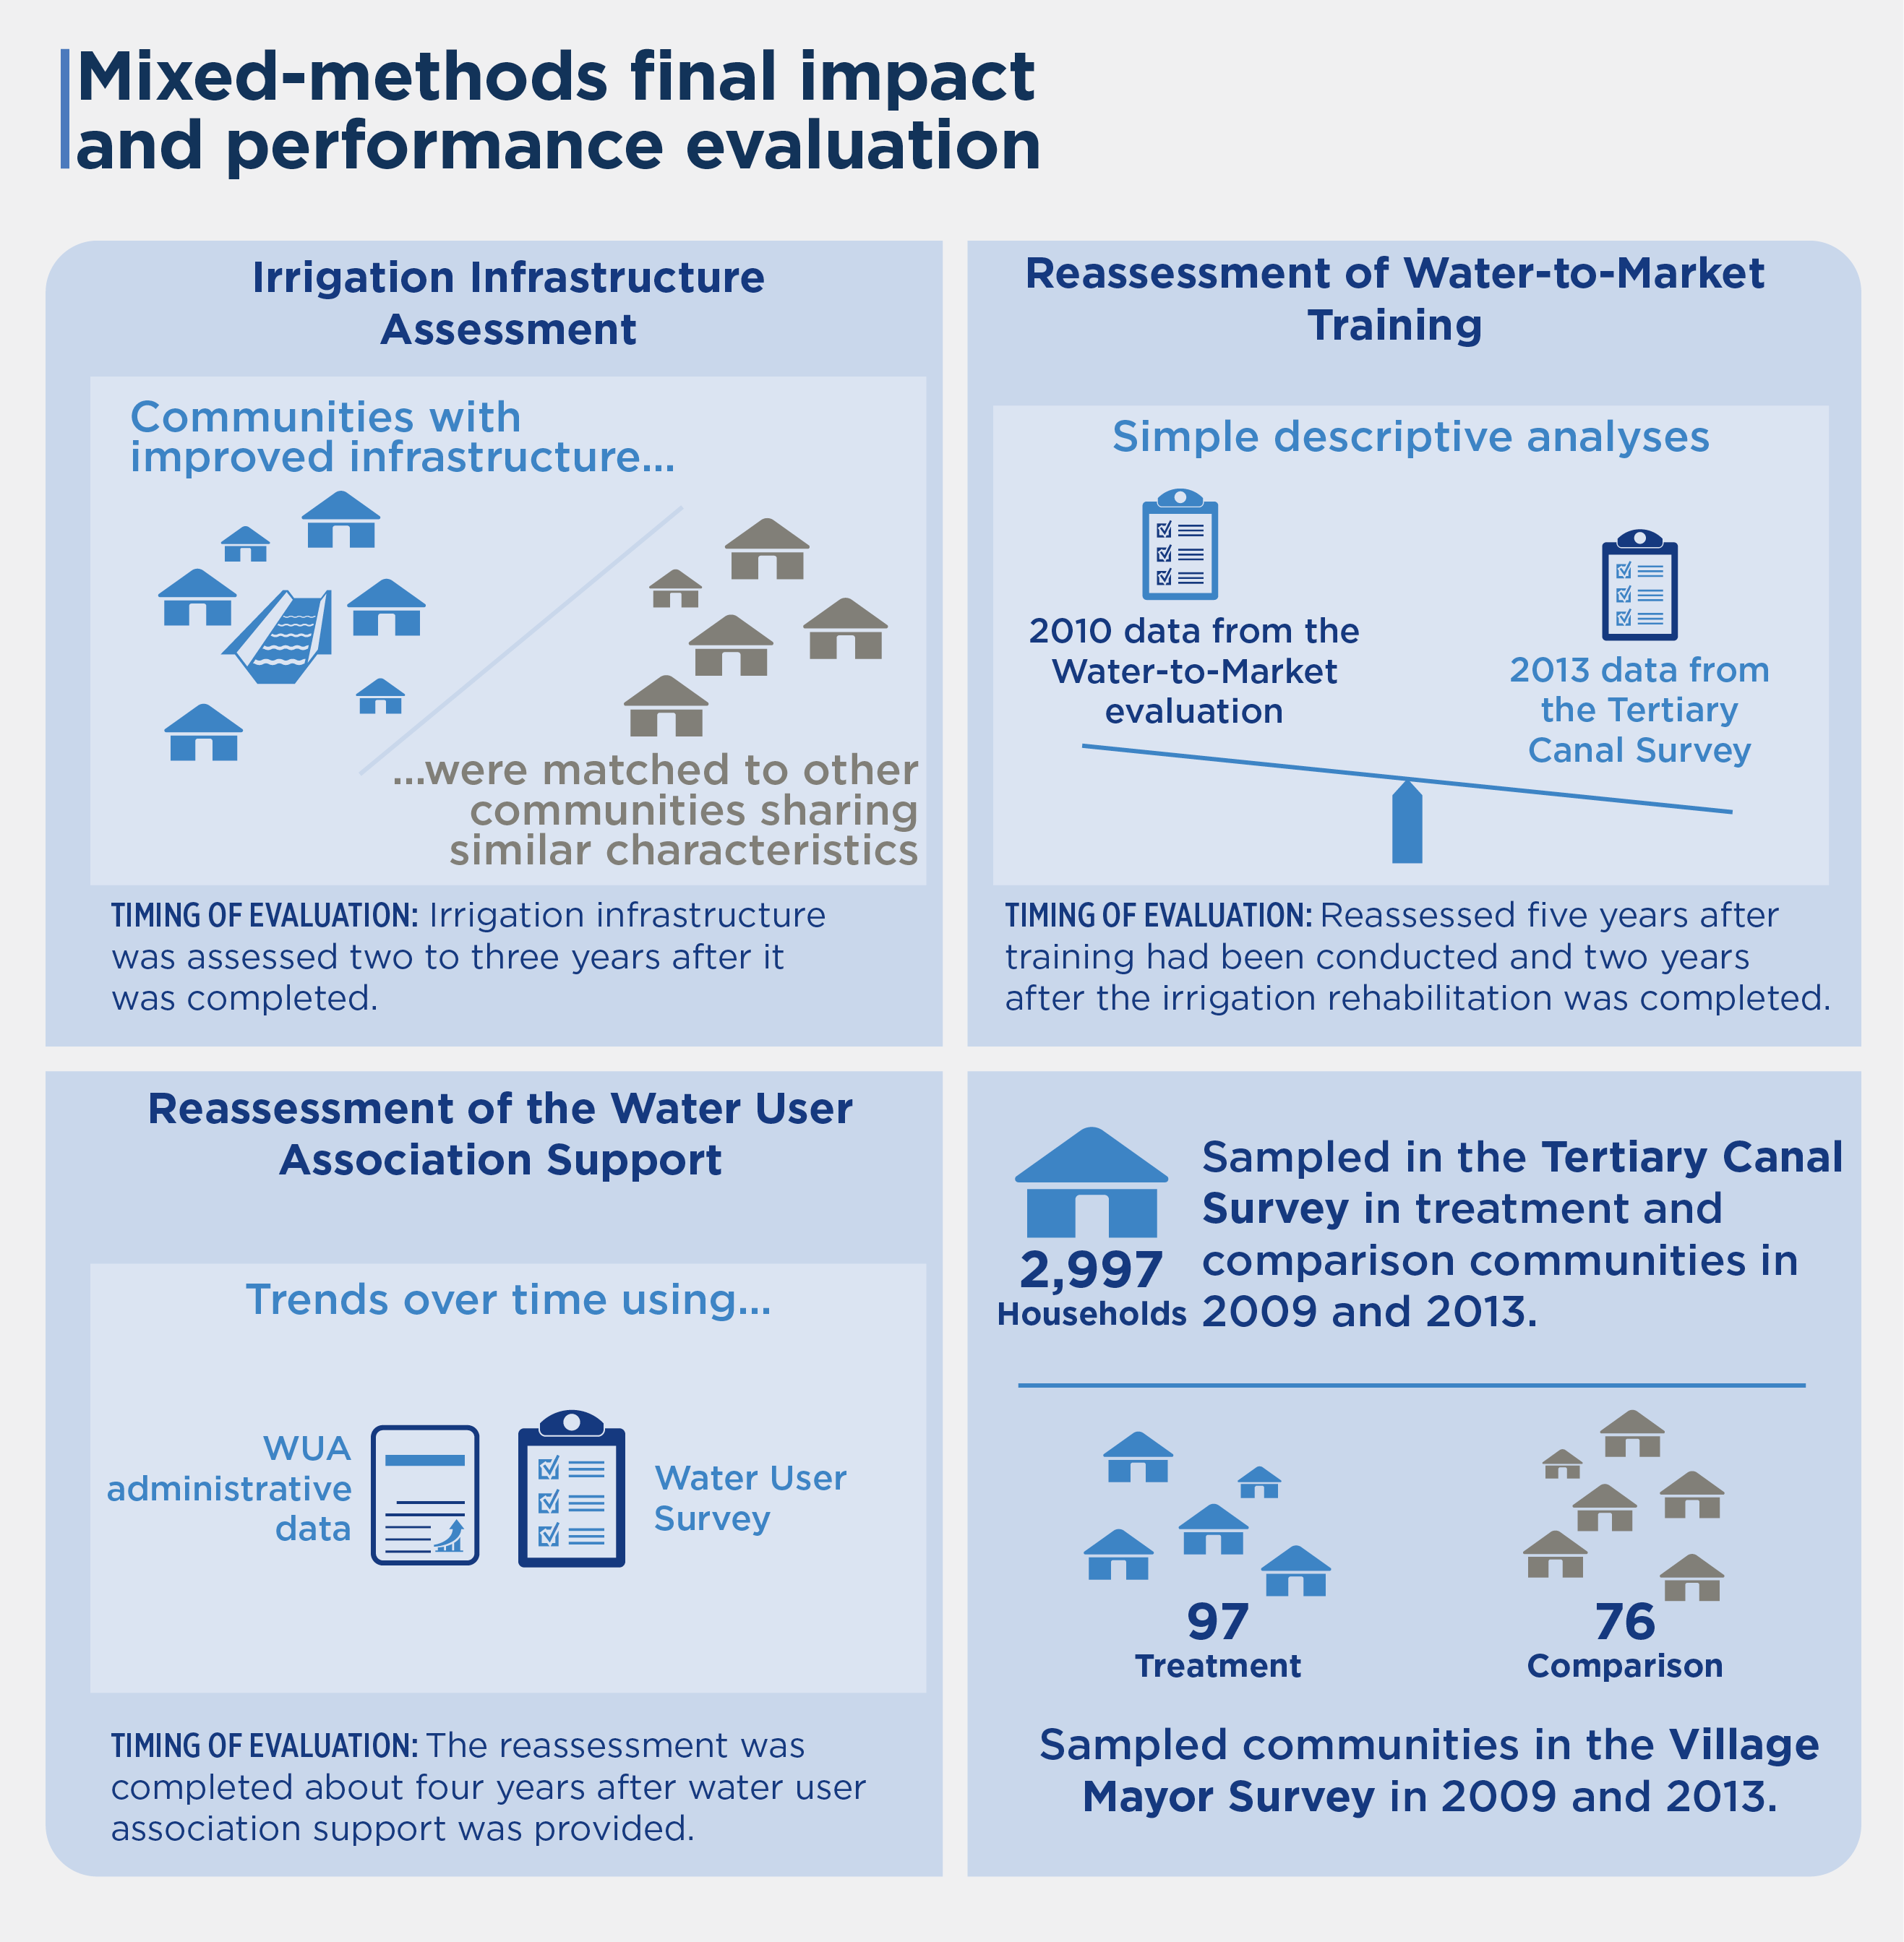
This mixed-methods final impact and performance evaluation included multiple methodologies. For the irrigation infrastructure, communities with improved infrastructure were matched to other communities sharing similar characteristics. Then post-rehabilitation outcomes for these communities were compared to estimate the impact, controlling for prerehabilitation outcomes, the rehabilitation of other types of irrigation infrastructure, and Water-to-Market training. Irrigation infrastructure was assessed two to three years after it was completed.
The reassessment of Water-to-Market training used simple descriptive analyses comparing 2010 data from the Water-to-Market evaluation with the 2013 data from the tertiary canal survey. The training group was reassessed five years after training had been conducted and two years after the irrigation rehabilitation was completed. The reassessment of the water user association support analyzed trends over time using water user association administrative data. The reassessment was completed about four years after water user association support was provided.
2020-002-2470