


Program Overview
MCC’s $332 million Zambia Compact (2013–2018) rehabilitated and expanded the water, sanitation, and drainage systems in peri-urban Lusaka, Zambia. The Municipal Utility Operations Monitoring Sub-Activity was built on the theory that short-term outcomes for water supply and sanitation would result in improved water quality, which ultimately, could lead to a decrease in the prevalence of water-related diseases in the long term.Evaluator Description
MCC commissioned the United States Centers for Disease Control and Prevention (CDC) to conduct an independent interim performance evaluation of the subactivity. Full report results and learning: https://data.mcc.gov/evaluations/index.php/catalog/215.
Key Findings
Water Quality Results
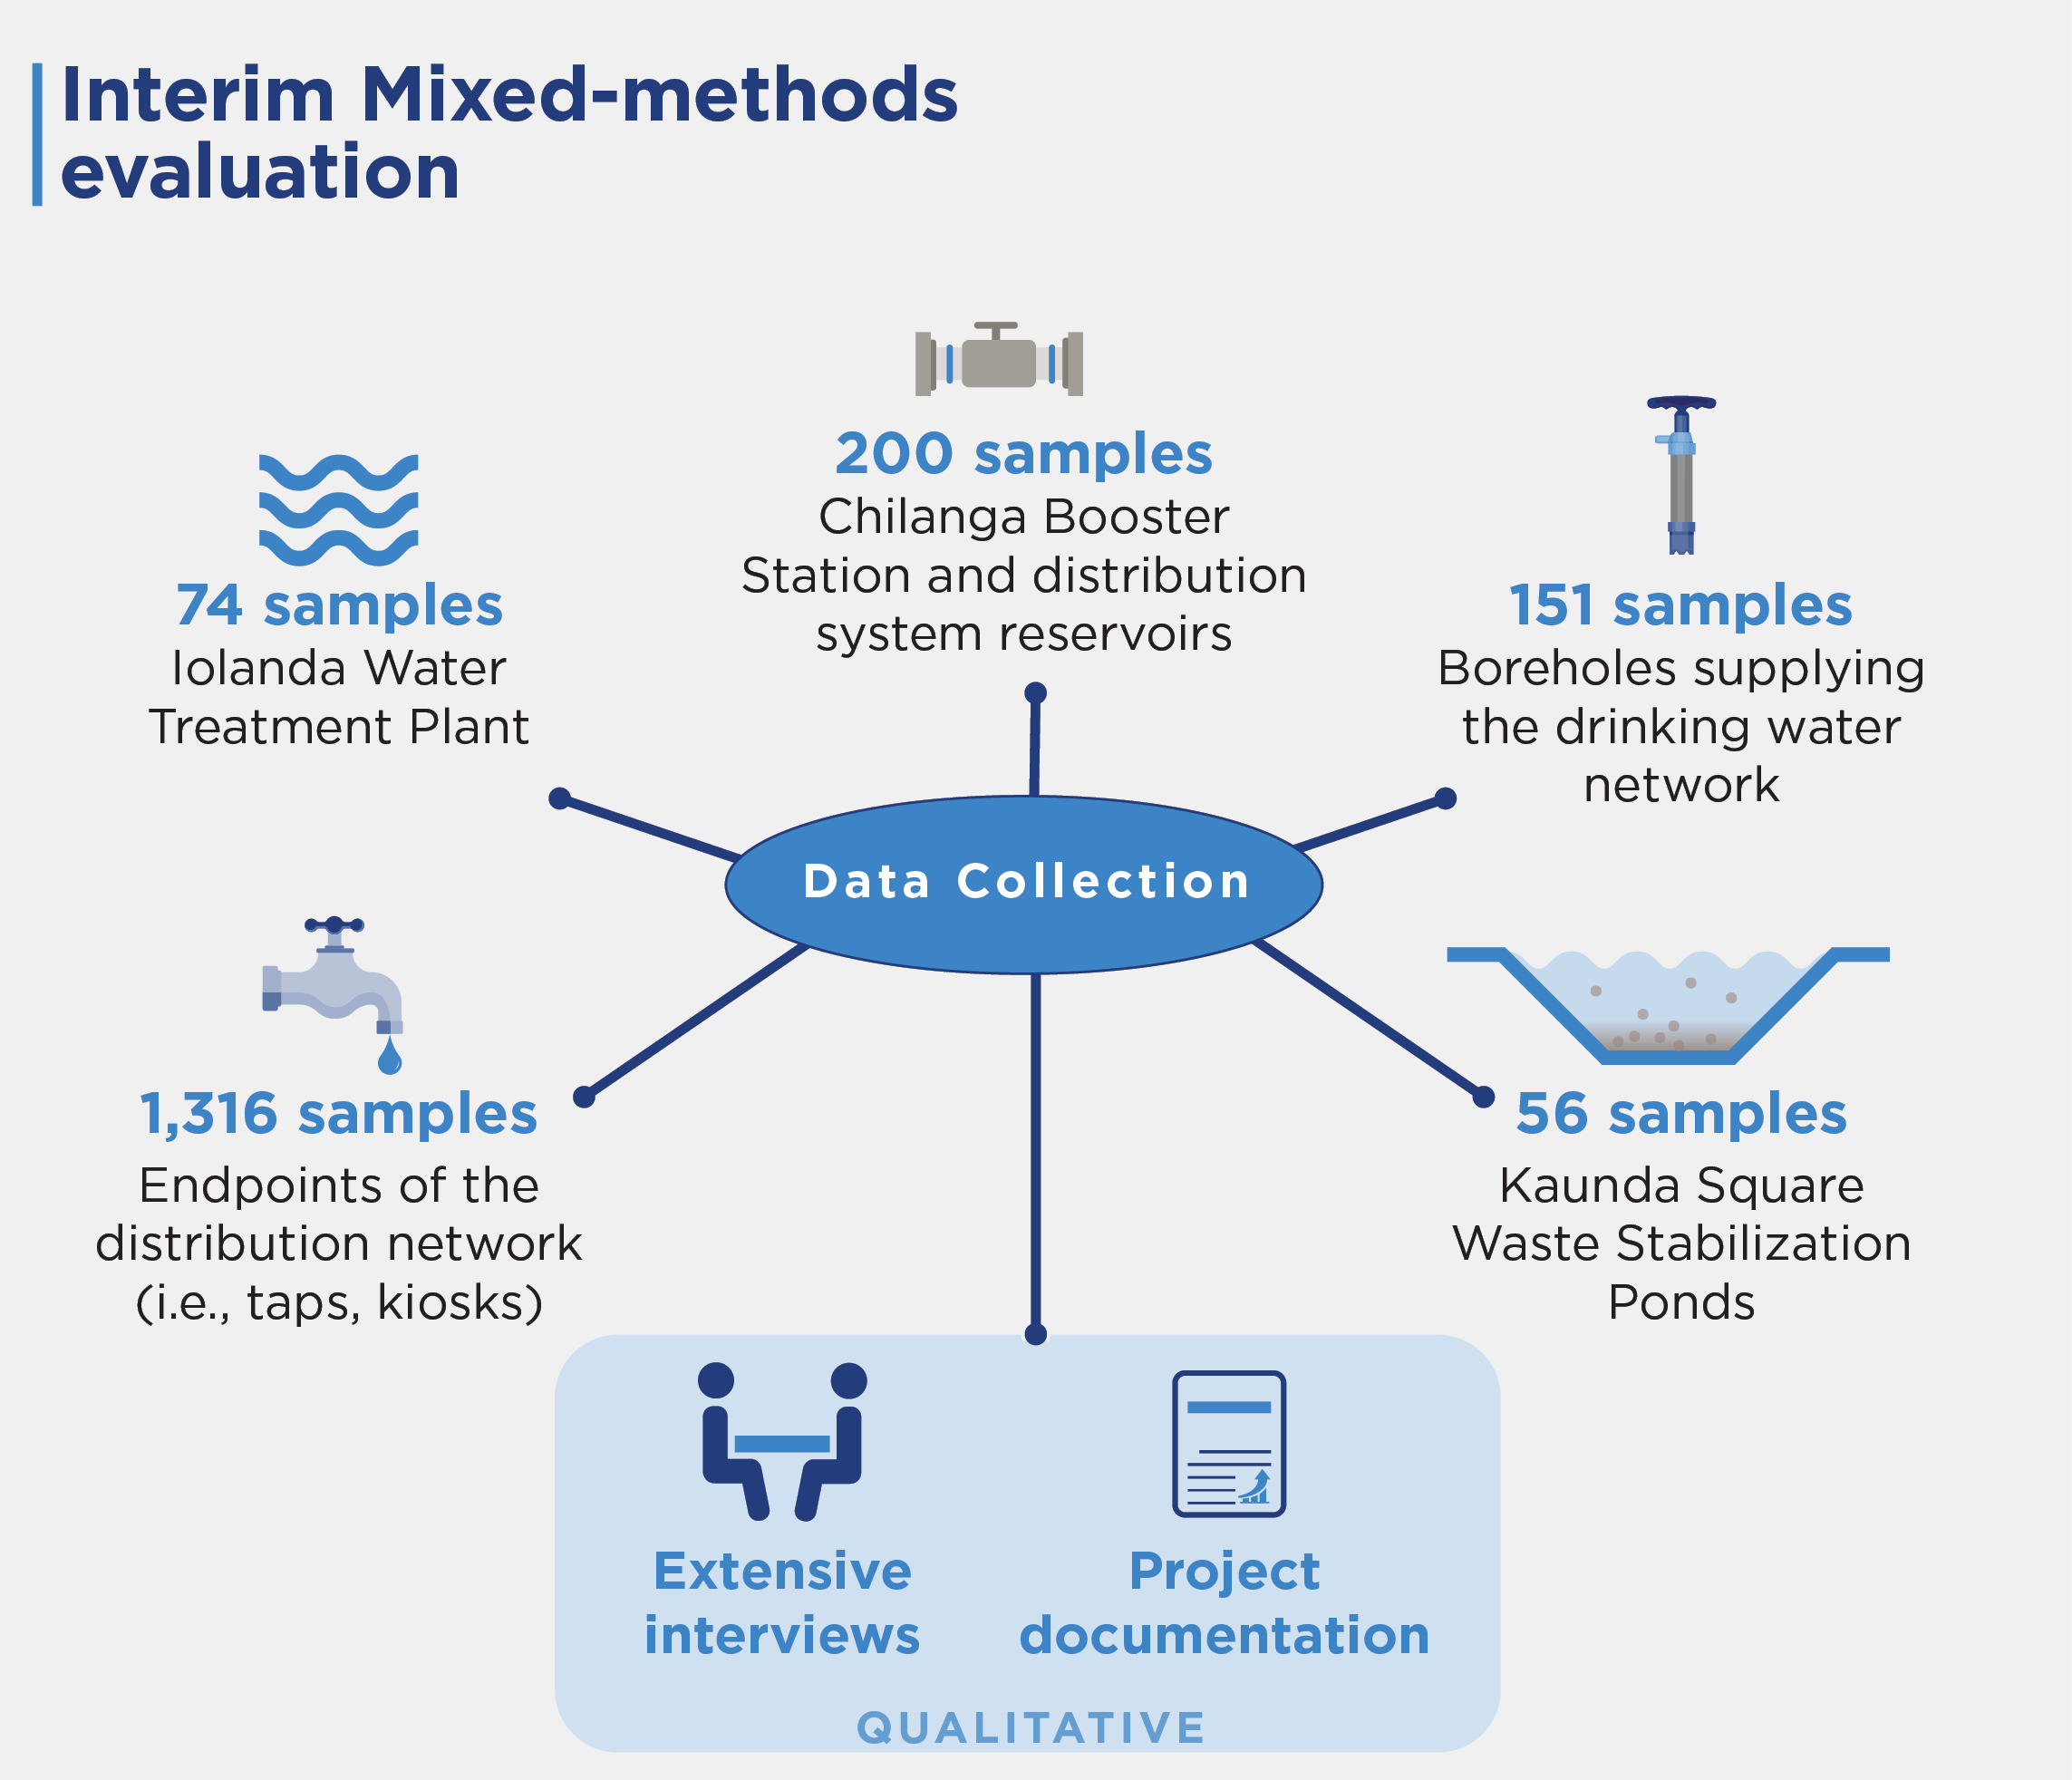
- Few water samples from program areas (Iolanda Water Treatment Plant and Chilana Booster Station) met the WHO E. coli guideline. However, most reservoir samples met the guideline.
- The percentage of samples that met the WHO free chlorine recommendation was low following completion of improvement programs, though there was a slight increase in the percentage of samples that met the recommendation in some system components.
Groundwater vs. Surface Water Contamination
- Data suggest that groundwater (borehole) is the main source of nitrate contamination in distribution system water in Lusaka.
- Improperly constructed and maintained pit latrines likely contaminate groundwater that supplies boreholes.
Wastewater Treatment Facility Improvements
- Kaunda Square Waste Stabilization Ponds achieved an overall 99.997 percent reduction in E. coli concentration from inflows of raw sewage to the system’s outflows, or effluent.
- Though some measures did not meet country standards, the quality of effluent released into the environment improved over time.
Evaluation Questions
This study was designed to answer the following research questions:- 1 Have improvements to the core water infrastructure (Iolanda Water Treatment Plant, seven main distribution system reservoirs, and some boreholes) contributed to improved water quality?
- 2 Has water quality improved in consumer taps that receive water from pipelines that were replaced to reduce water losses?
- 3 Has water quality improved in consumer taps that receive water from new or extended pipeline networks?
- 4 Are pit latrines the source of nitrates in drinking water from boreholes (groundwater)?
- 5 Have the Kaunda Square Waste Stabilization Ponds treated sewage effectively?
Detailed Findings
Water Quality Results
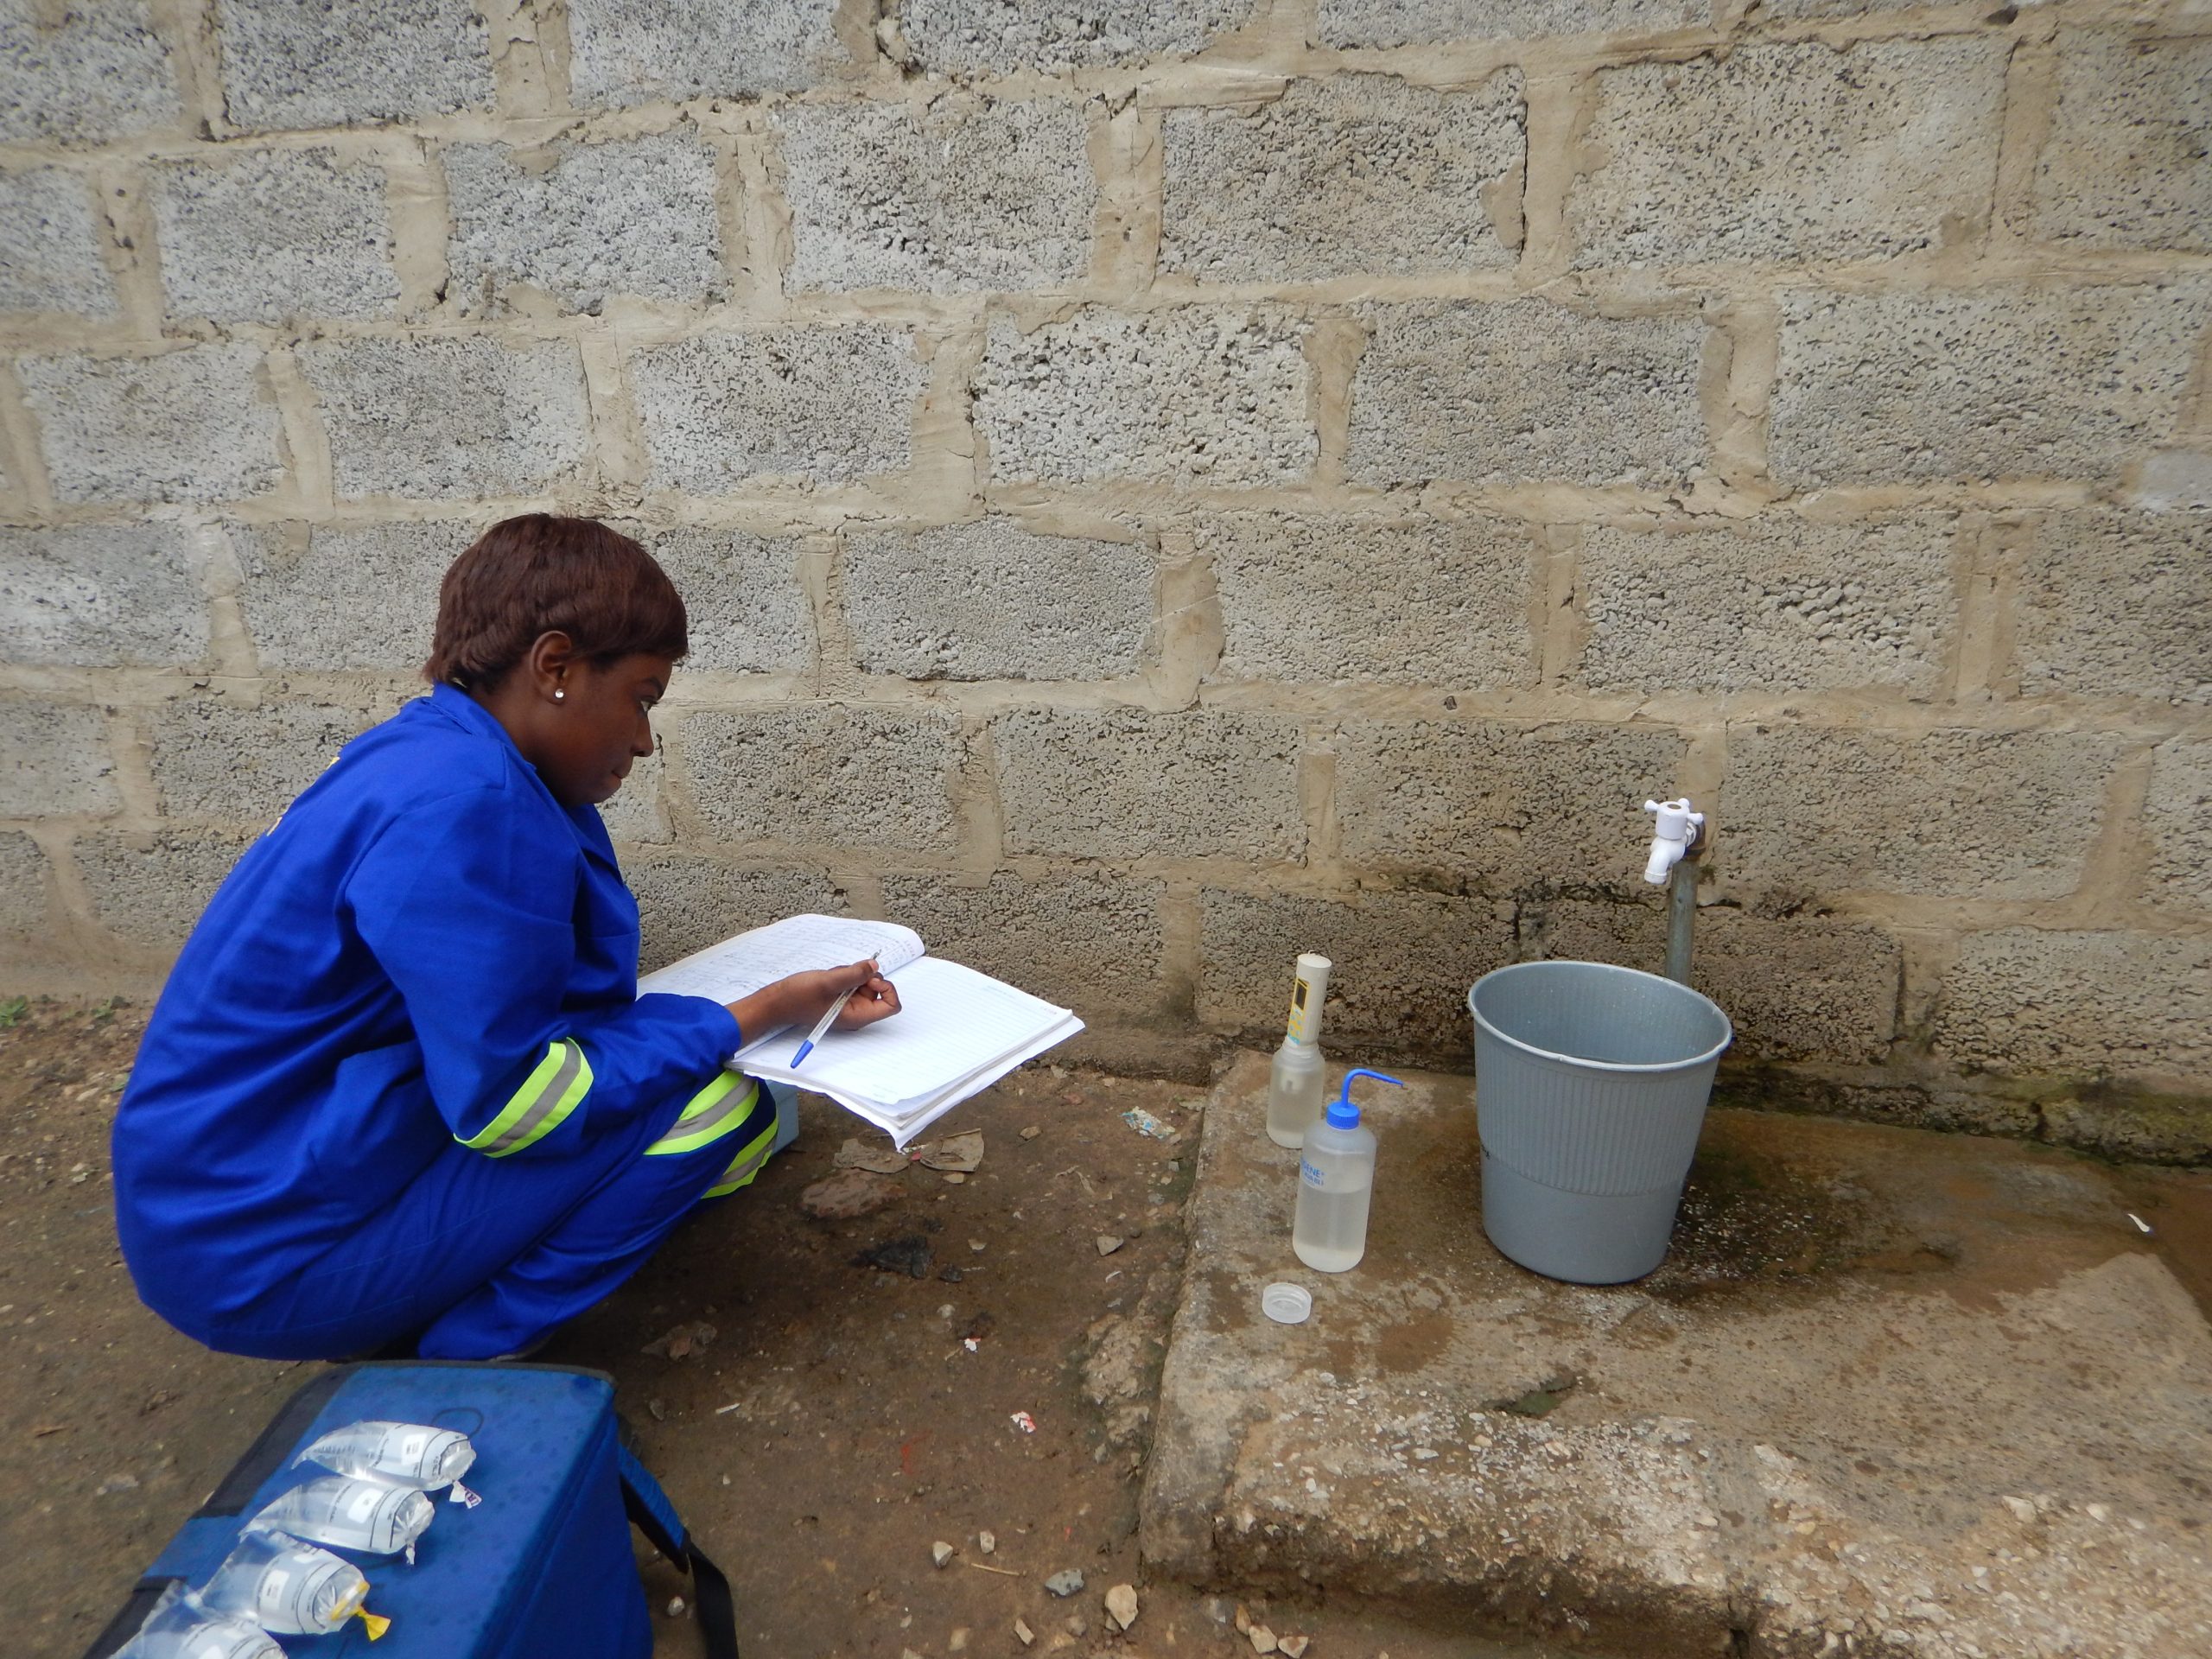
Field staff recording water test results from finished (treated) water exiting a drinking water distribution center reservoir in Lusaka, Zambia in 2018.
Overall, consistent achievement of the WHO chlorine residual recommendation proved challenging. The percentages of samples that met with WHO’s recommendation often decreased or no free chlorine was detected, even after interventions were complete. However, compared with pre-intervention, a higher percentage of samples from the Iolanda Water Treatment Plant met WHO turbidity recommendations post-intervention (pre: 44 percent, post: 57 percent).
Collectively, 93 percent of taps in areas scheduled to receive nonrevenue water pipeline replacement met the WHO E. coli guideline, and 67 percent met the WHO free chlorine recommendation. The evaluation was unable to assess changes over time because these interventions were not completed during the study period.
Contamination Levels of Groundwater versus Surface Water
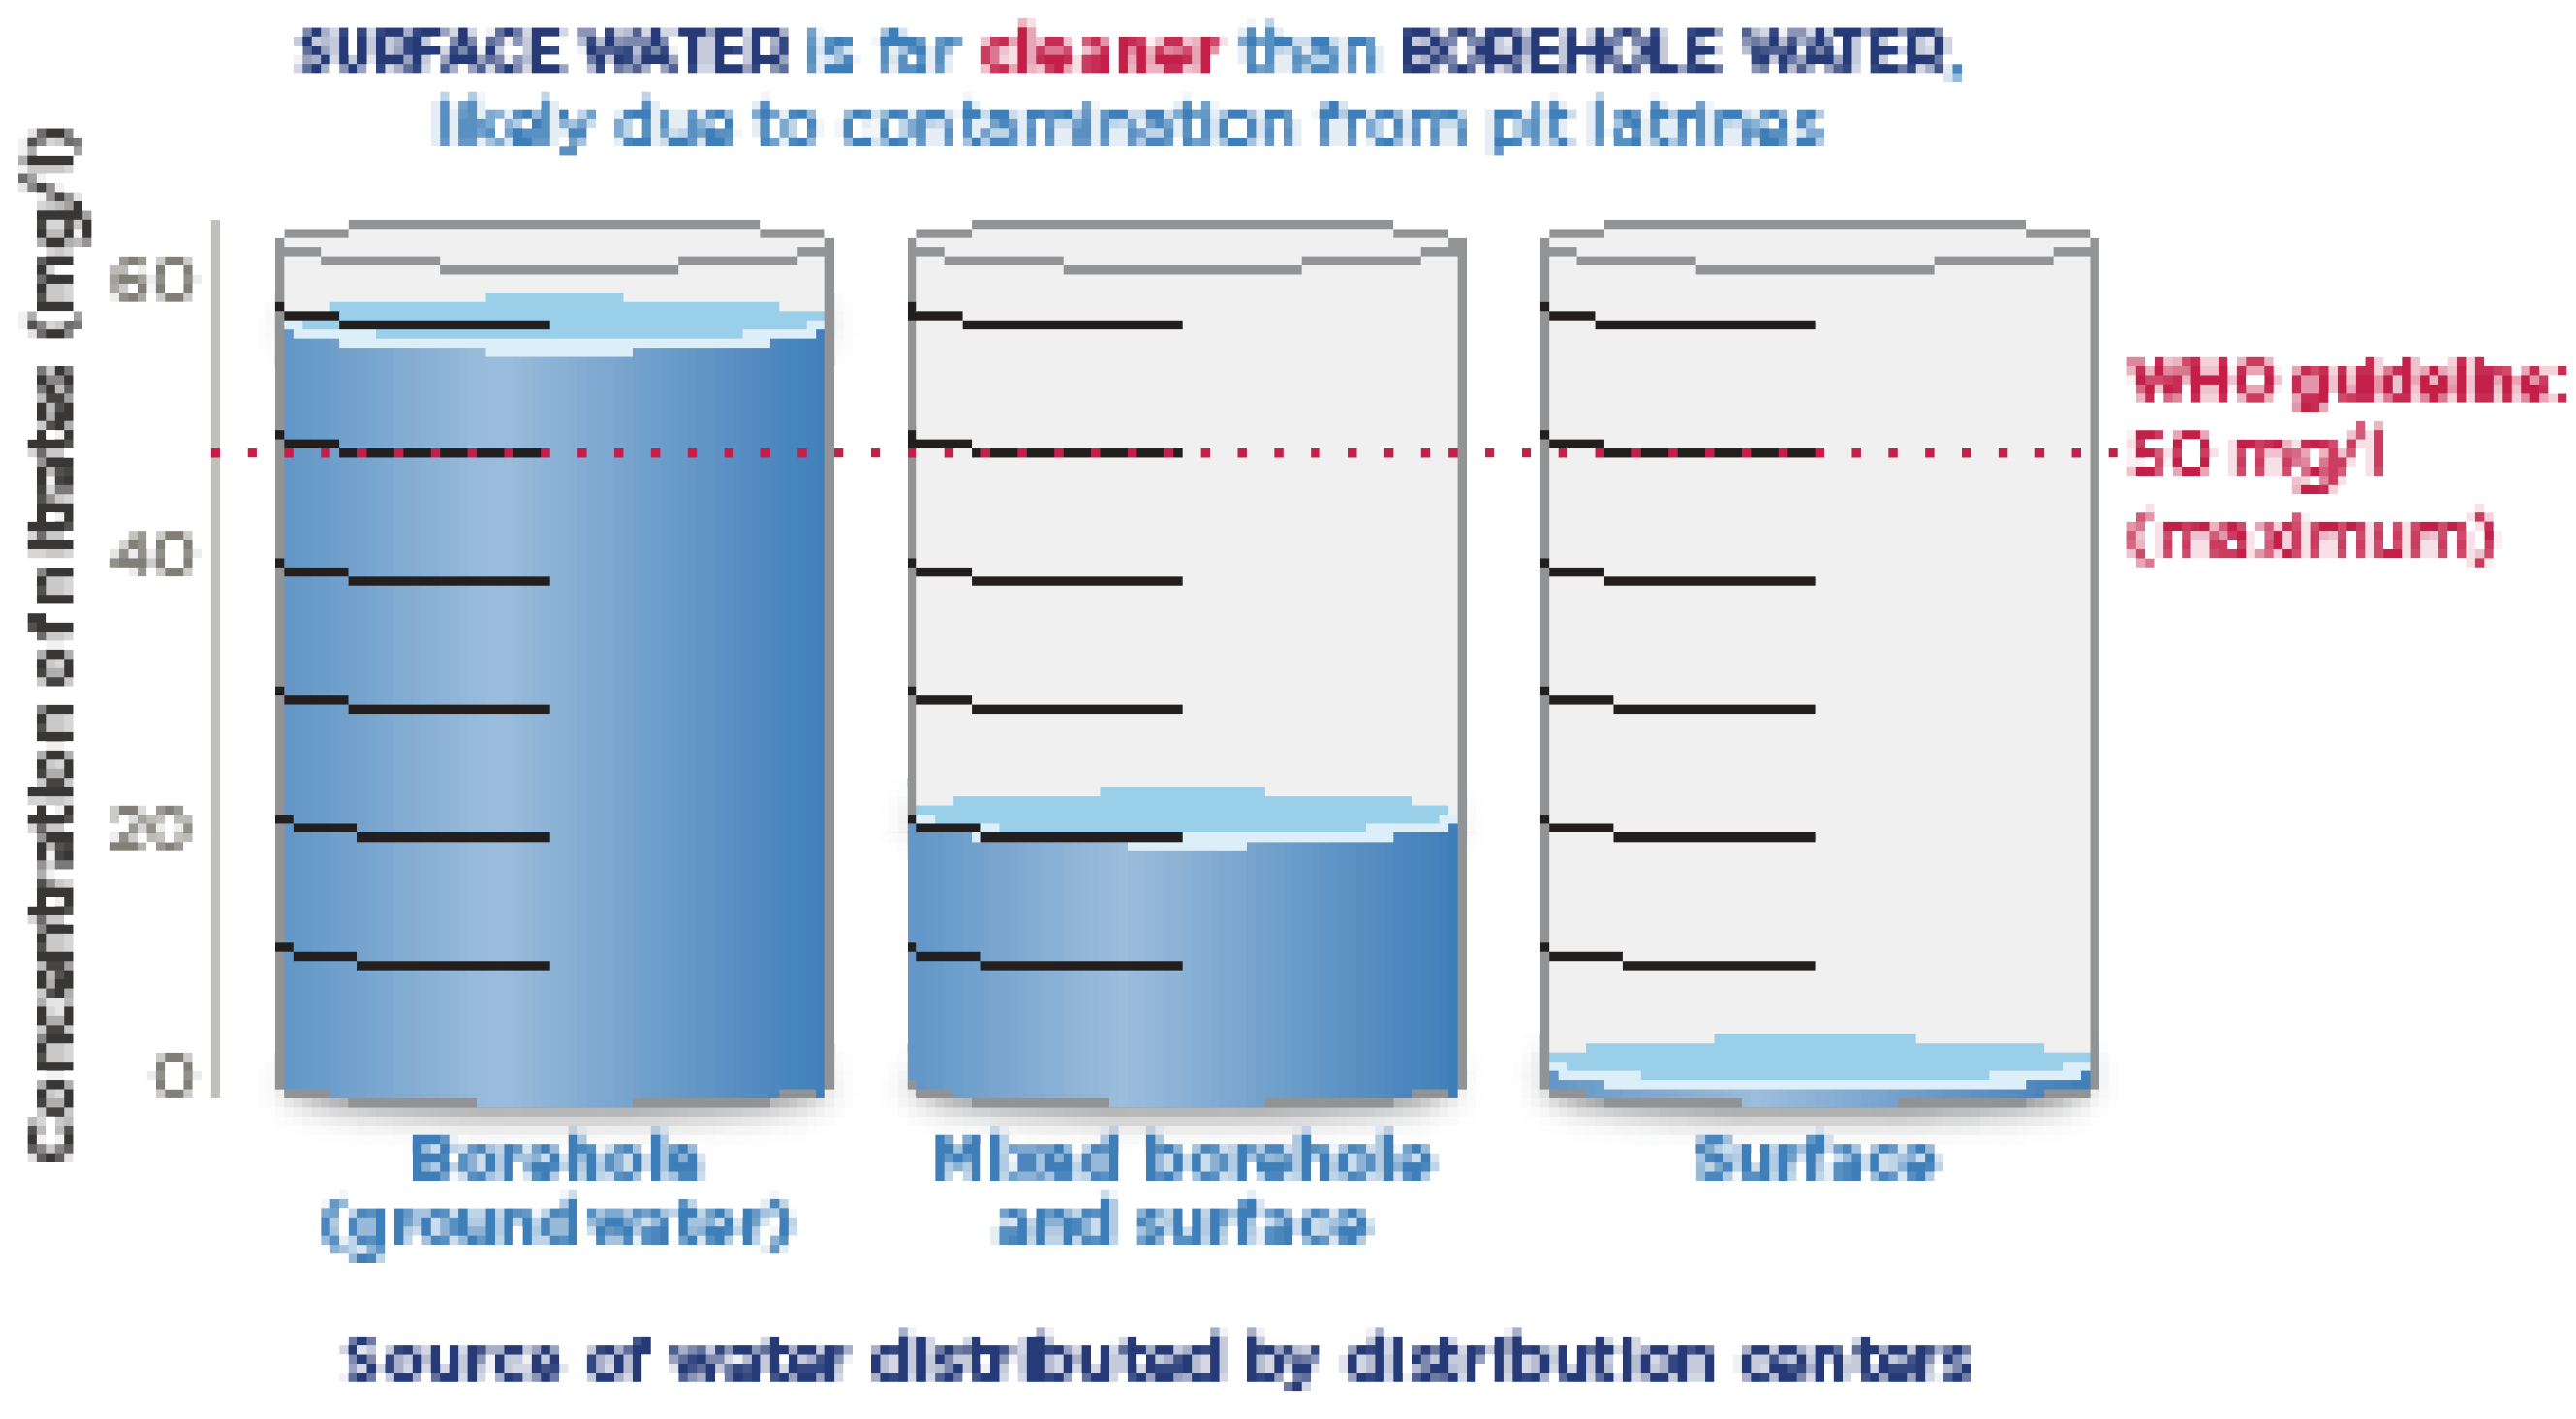
Both the median nitrate concentration (16 mg/L) and the percentage of samples greater than the WHO guideline (7 percent) were lower in boreholes located in areas with a low density of pit latrines than in areas with a high density of pit latrines (39 mg/l and 40 percent, respectively).
Waste Treatment Facility Improvements
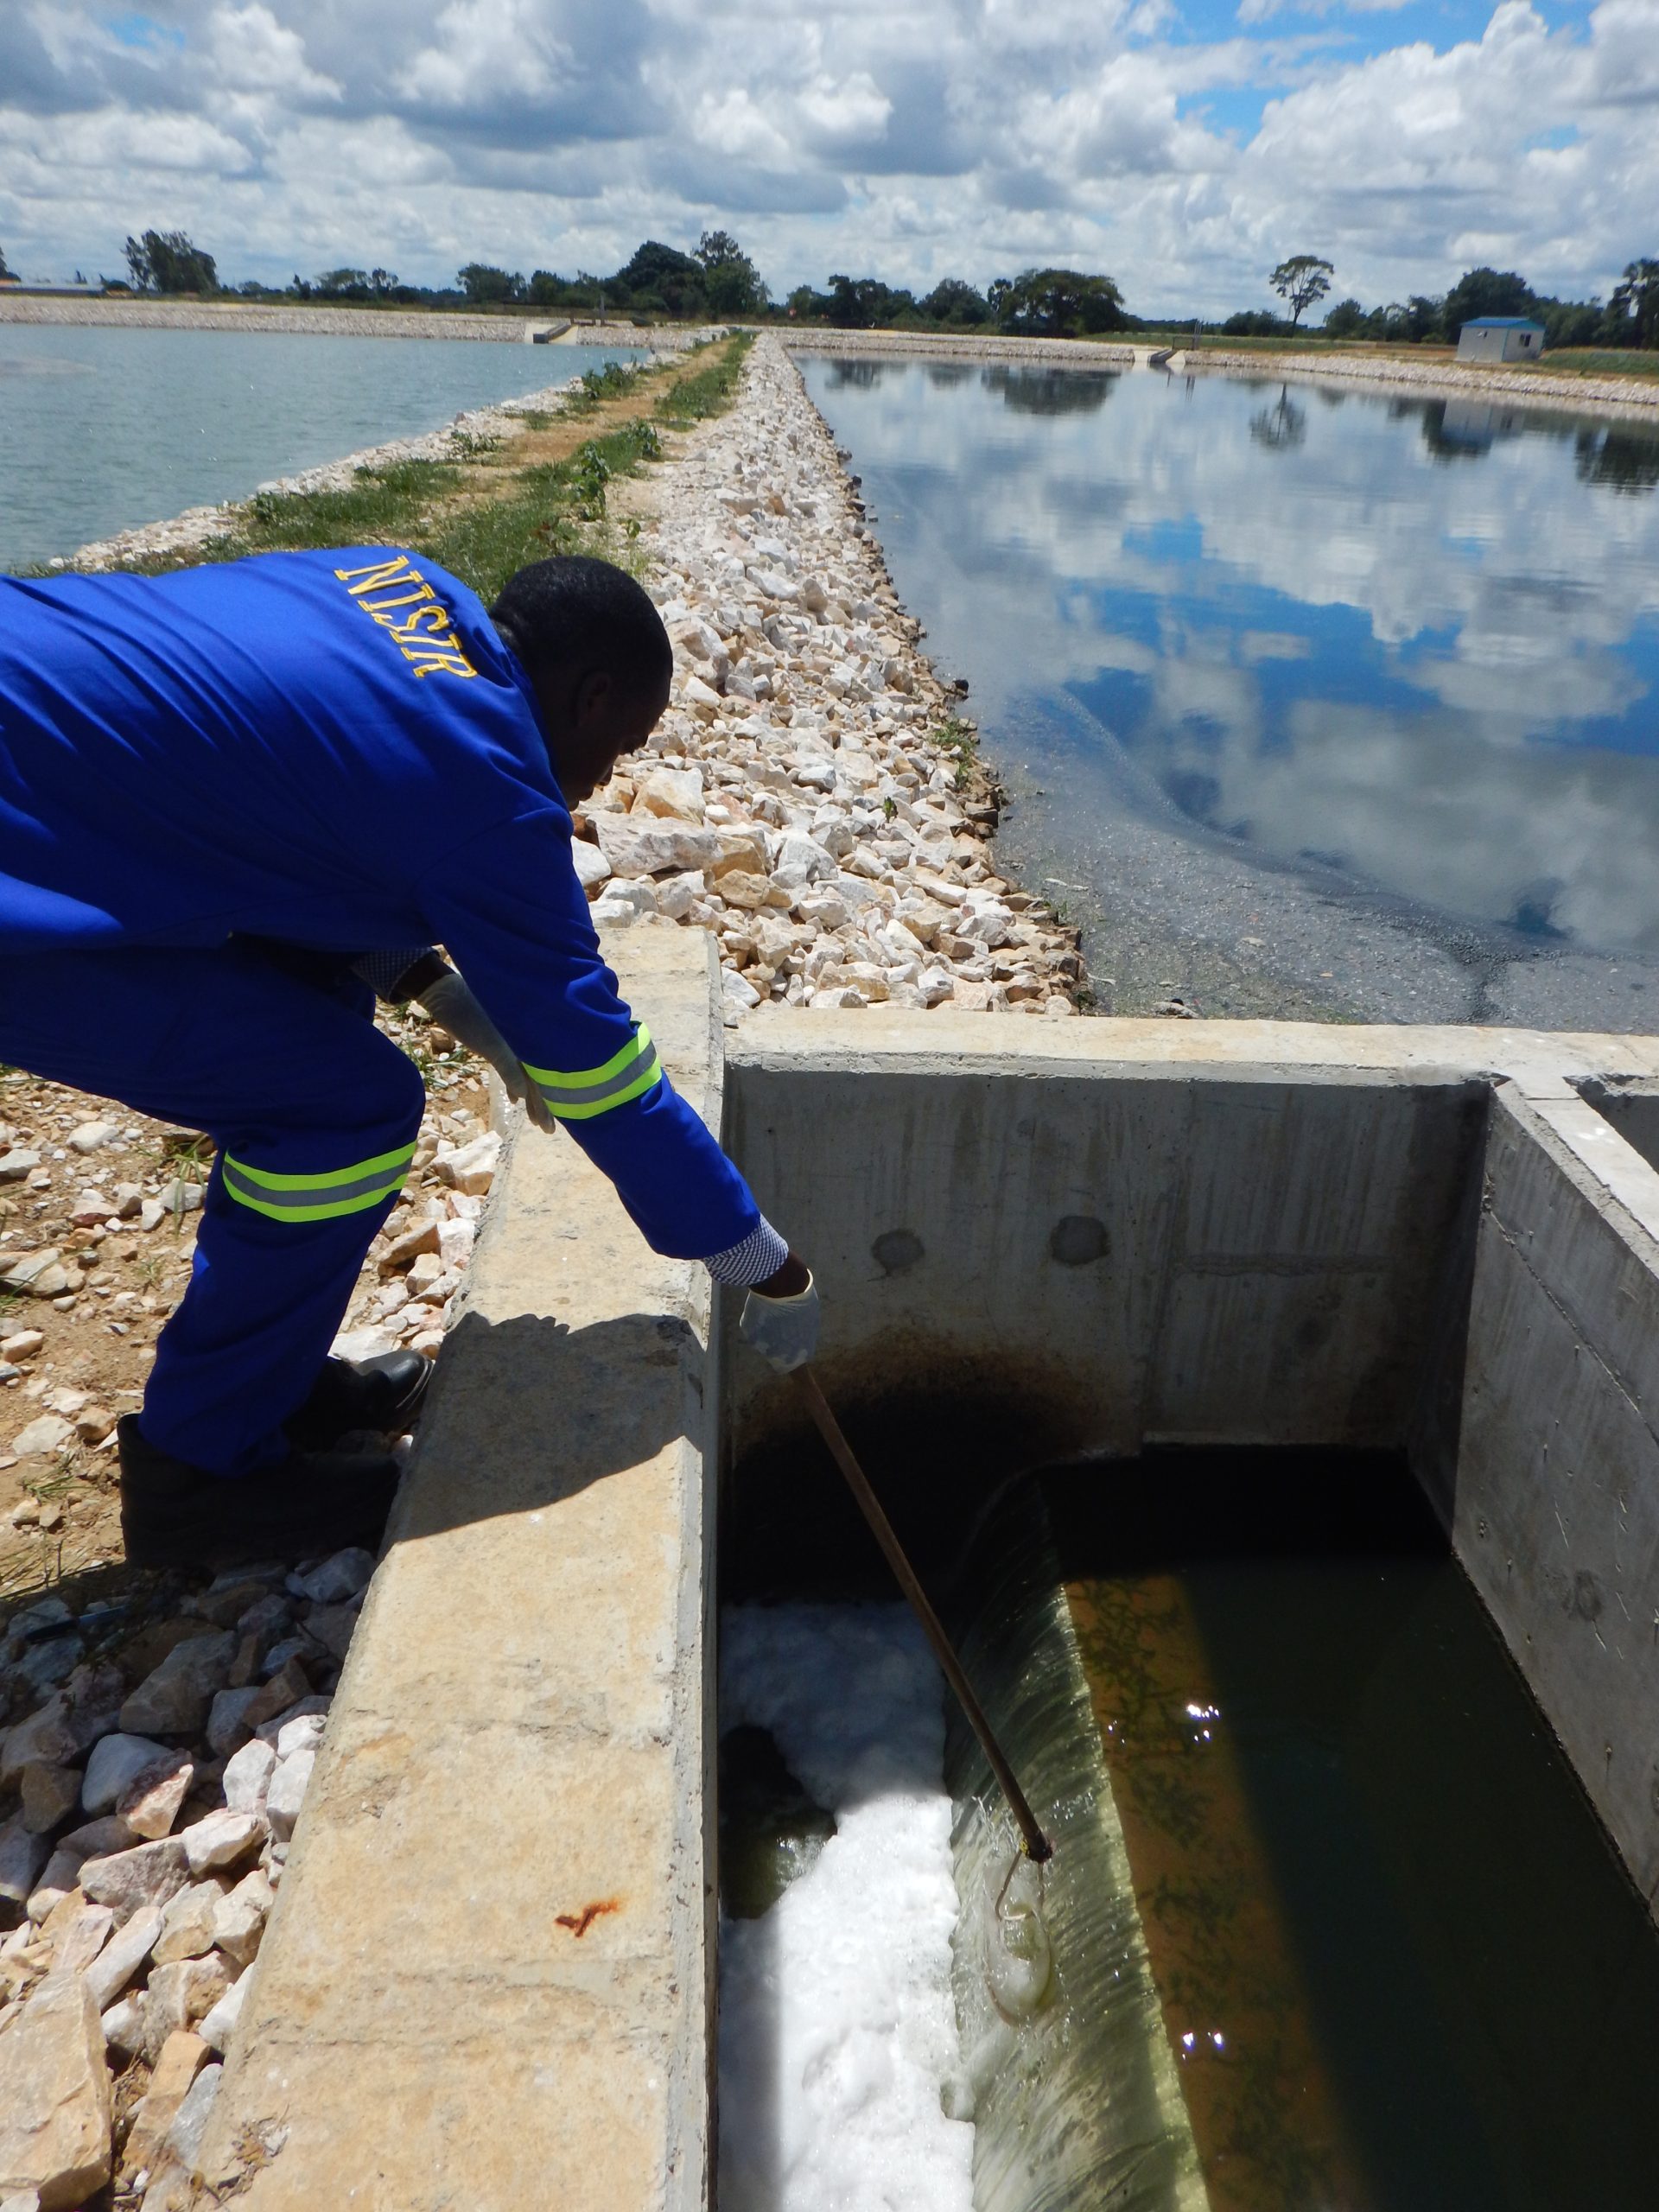
Field staff collecting samples from a waste stabilization pond in Lusaka, Zambia in 2018.
MCC Learning
- Infrastructure investments are more likely to achieve sustainable results when related behavioral and institutional capacity constraints are also addressed. Connecting the two is especially challenging to achieve within a limited program timeframe.
- Understanding the key sources of nitrate contamination in the distribution system is critical to addressing water quality challenges. Although specific factors affecting water quality are often unavailable before significant testing, key assumptions should be verified as early as possible during compact due diligence. Specifically, the continued reliance on groundwater will continue to affect water quality in Lusaka.
- Adequate infrastructure maintenance after project completion is critical for the accrual of project benefits. MCC should support its partners in the development and funding of their maintenance operations which are necessary to sustain the benefits of infrastructure interventions.
Evaluation Methods
The exposure period varied for each infrastructure activity. Rehabilitation of the Kaunda Square Waste Stabilization Ponds was the earliest completed activity (completed in April 2018) and provided an exposure period of approximately 16 months. The Iolanda Water Treatment Facility, Chilanga Booster Station, and reservoirs had an exposure period of approximately one year.
Next Steps
A final performance evaluation of the full set of compact interventions is under way, and results will be available in 2023.2021-002-2646