

Program Overview
MCC’s $540 million Senegal Compact (2010–2015) funded the $324 million Roads Rehabilitation Project. The Roads Rehabilitation Project improved 372 kilometers of strategic highways and river crossings in the north and south of the country. The project was based on the theory that improvements in road infrastructure would reduce travel times and vehicle operating costs for road users, improving access to markets and services, which would in turn support economic growth and improve outcomes for local people.
Evaluator Description
MCC commissioned CH2M HILL, Inc. to conduct an independent final performance evaluation of the Roads Rehabilitation Project. Full report results and learning: https://data.mcc.gov/evaluations/index.php/catalog/253.
Key Findings
Economic Rate of Return
- The original economic rates of return (ERRs) were significantly higher than those of the evaluator, due to optimistic assumptions on traffic growth and baseline road roughness conditions.
- Ongoing improvements to the RN2, a main highway, and the new Senegambia bridge serving the RN6 may increase ERRs in the long term
Road Usage Patterns
- Over 88% of drivers and two-thirds of passengers are males
- Most trips are made locally for business purposes, with agricultural products transported the most frequently.
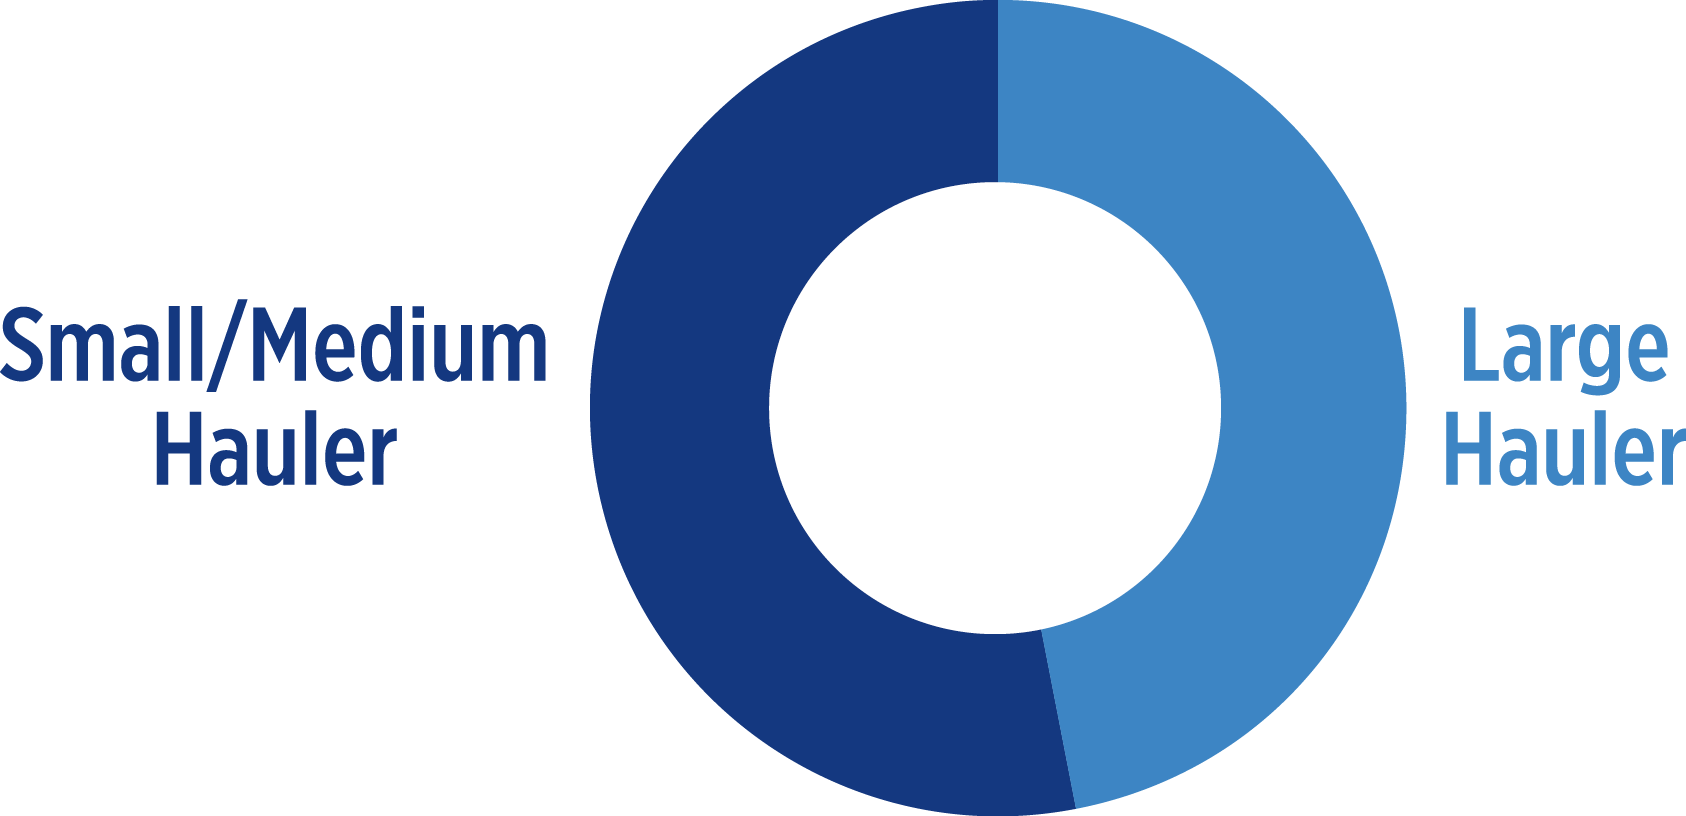
Transportation Market
- Larger firms are less likely than smaller operators to reduce fares, but may improve the quality and frequency of services.
- While travel times have improved, prices charged for transport have not reduced significantly.
Maintenance
- AGEROUTE, the government’s maintenance agency, is perceived as following proper maintenance procedures.
- External maintenance challenges may include funding uncertainty, vehicle overloading and security.
Evaluation Questions
This final performance evaluation was designed to answer the following questions with regard to the rehabilitation of the RN2 and RN6:- 1 What is the economic return in terms of vehicle operating cost-savings and travel time-savings?
- 2 What are the road usage patterns on the RN2 and RN6?
- 3 How likely are transport cost-savings to be passed on to transport service customers?
- 4 What is the likelihood that MCC’s investment remains adequately maintained?
Detailed Findings
Economic Rate of Return
On the RN2, the original ERR was greater than the evaluator’s estimate by a margin of 5.6 percentage points (10.9 percent vs. 5.3 percent). On the RN6, MCC’s ex-ante, the original estimated rate was nearly six times greater than the evaluator’s estimate. More recently, a number of transport infrastructure projects have taken place on or around the RN2 and RN6, which may lead to increased traffic growth and user benefits, hence an increase in their longer-term ERRs. Projects include African Development Bank-funded improvements to the RN2 (Ndioum–Bakel section) and the recently constructed Senegambia bridge serving the RN6.Road Usage Patterns
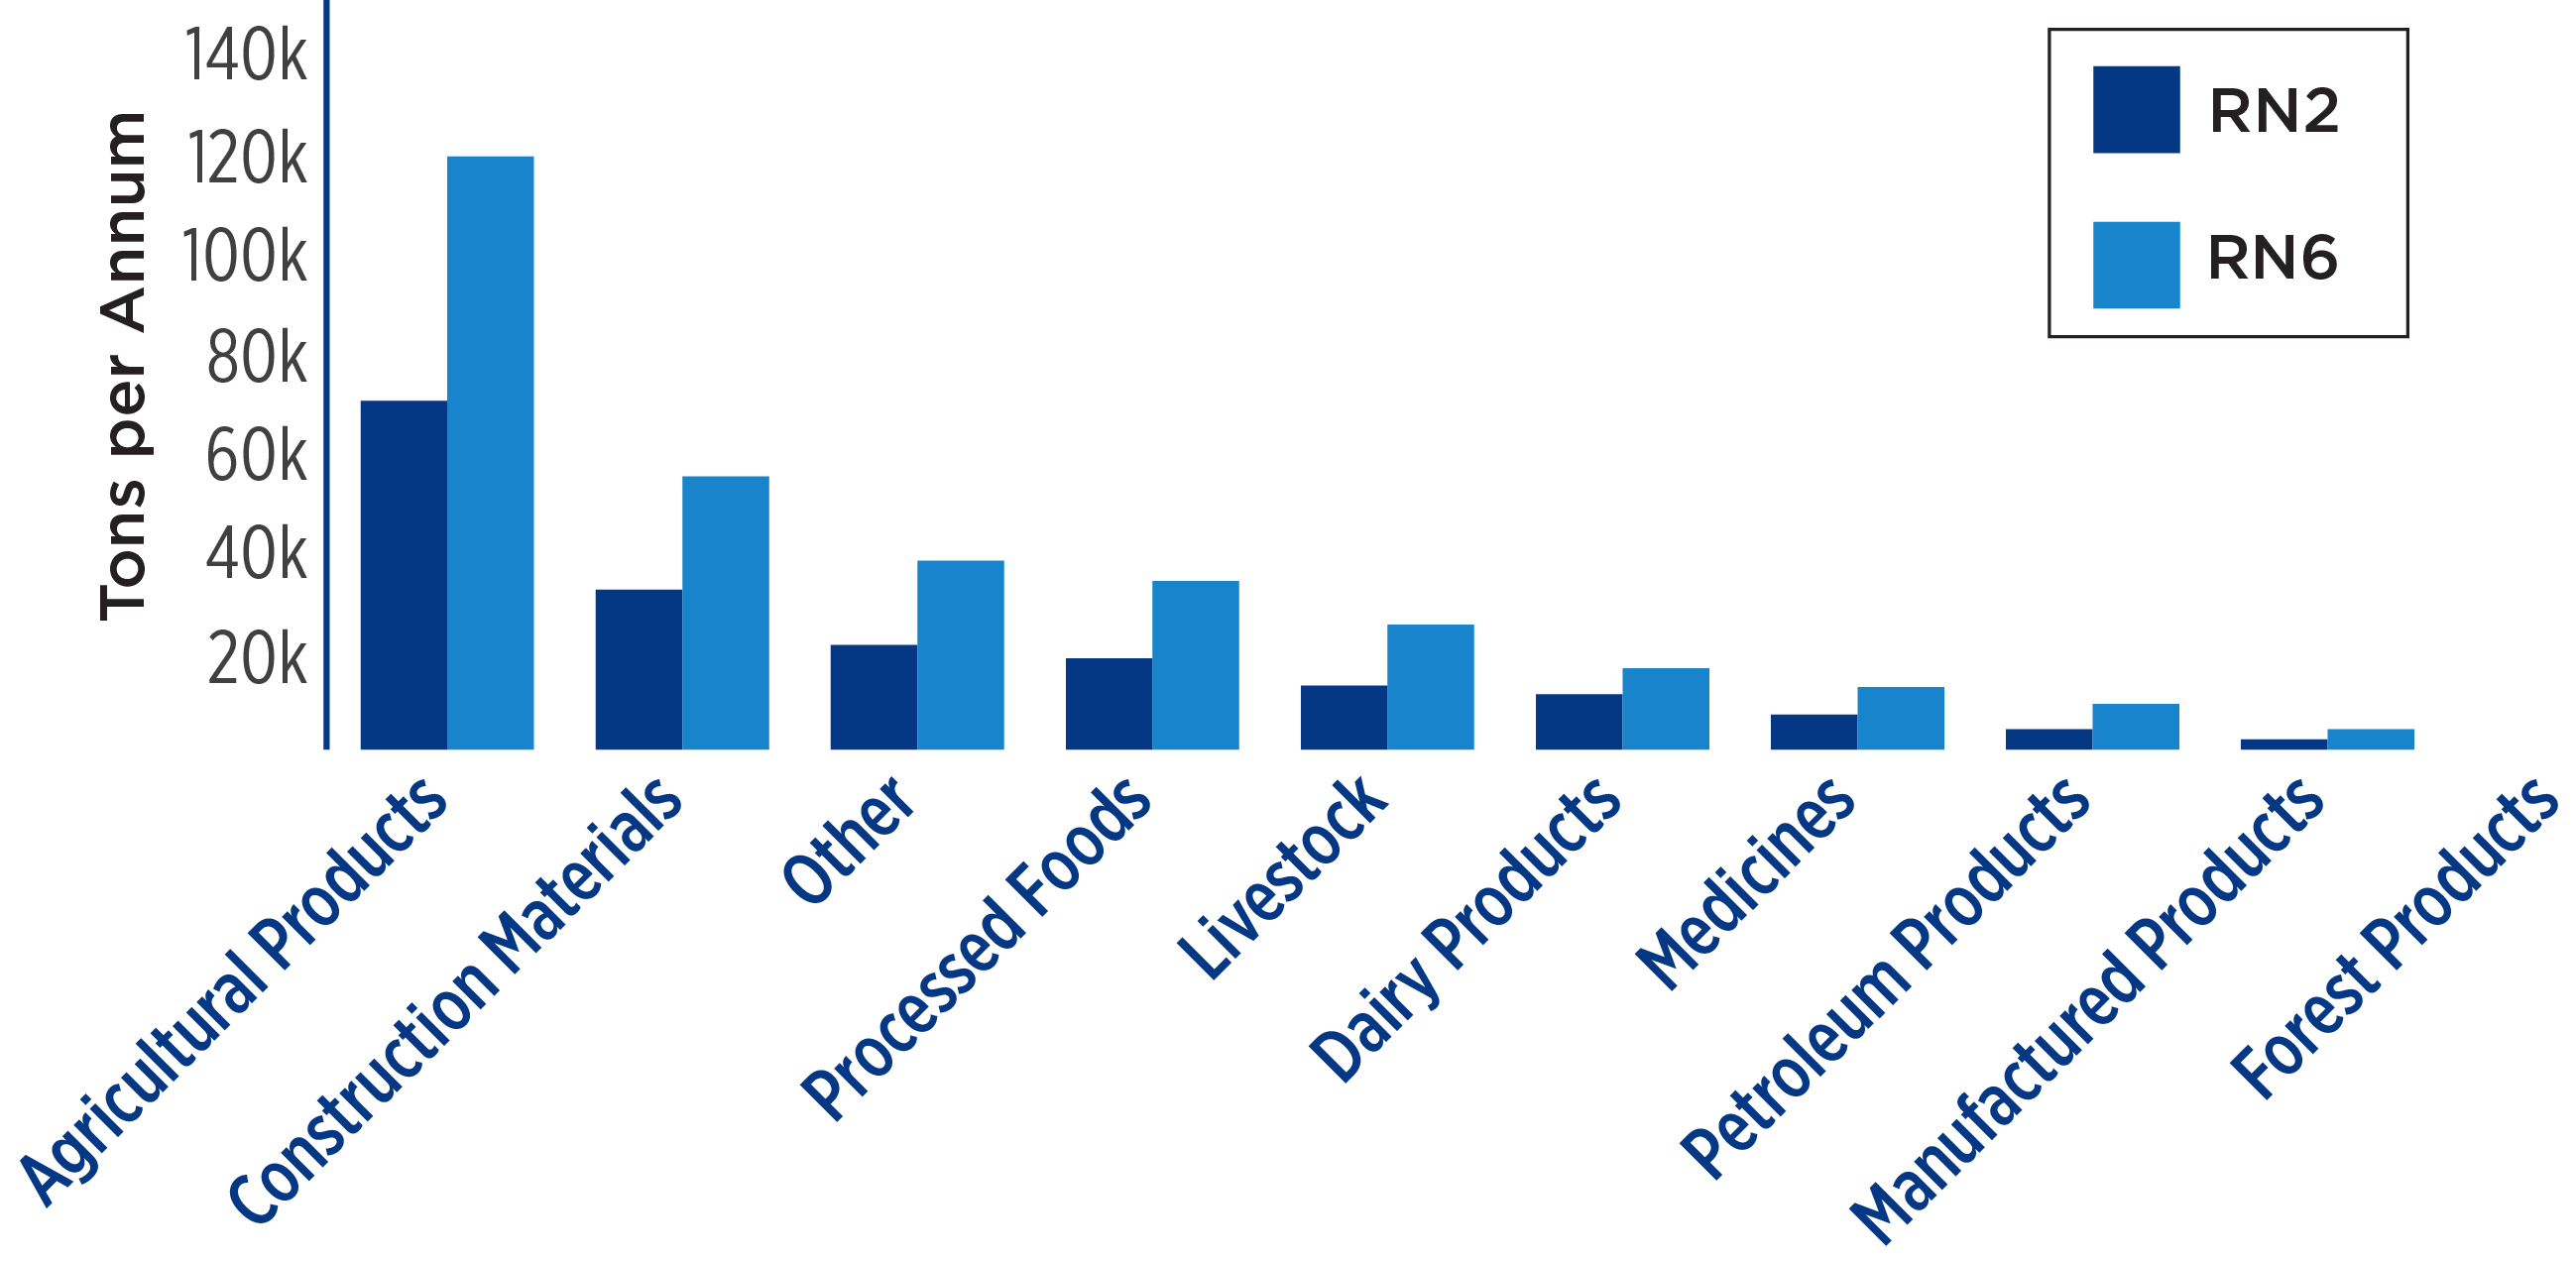
Annualized volume of goods by type
Transportation Market
Maintenance
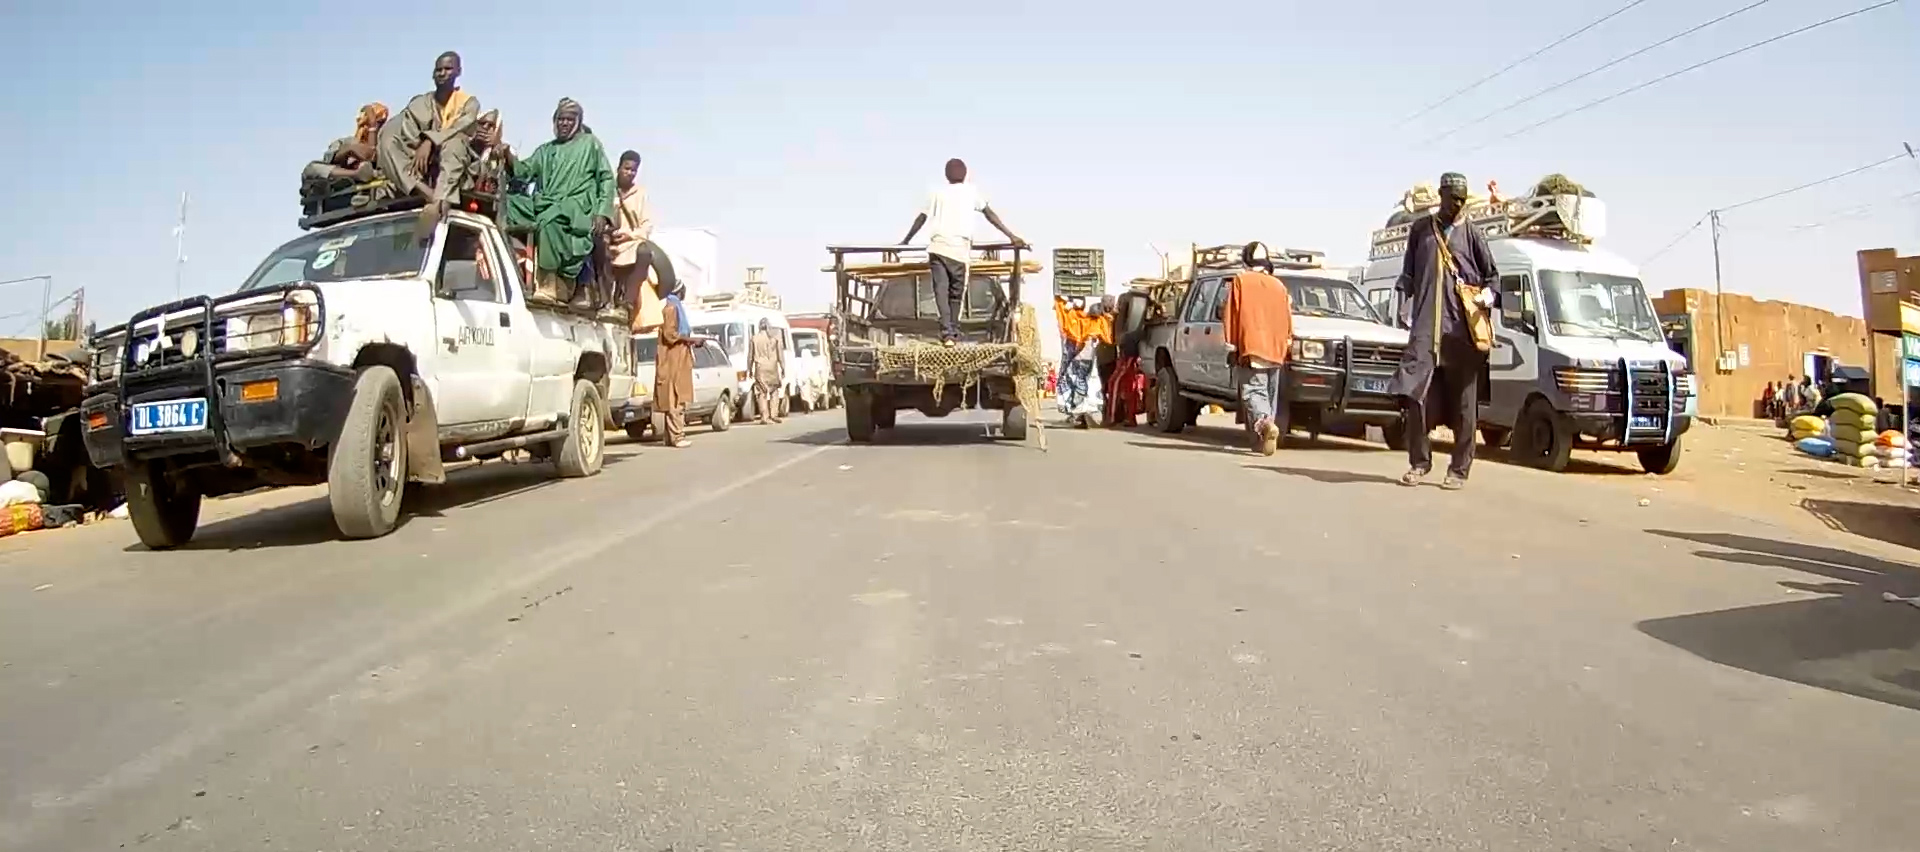
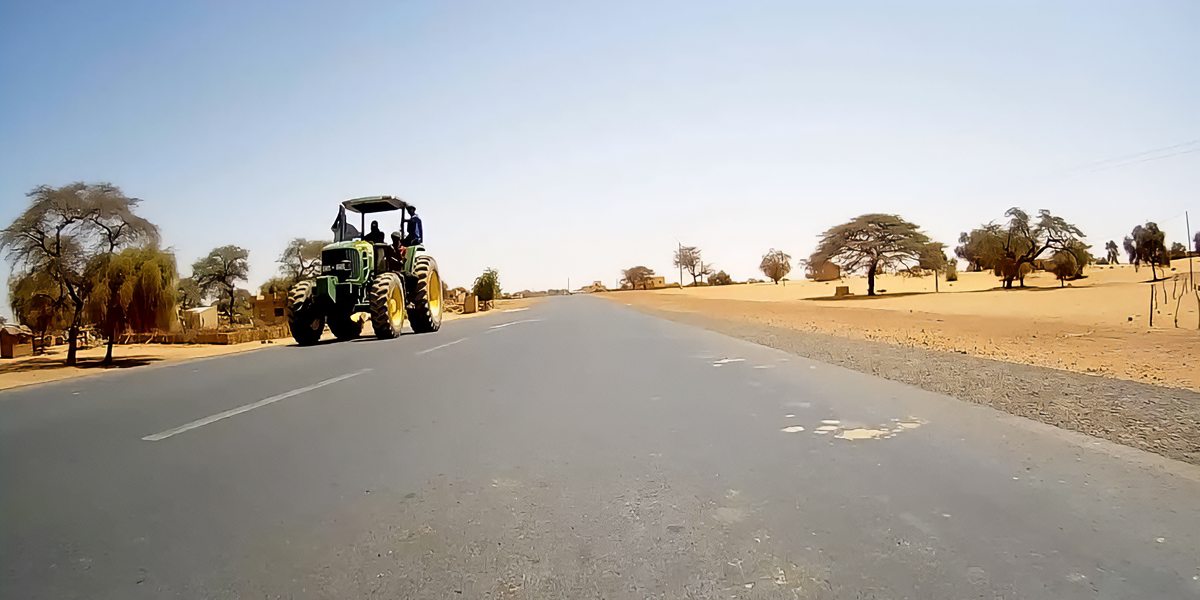
RN2 on a typical day in a market
Economic Rate of Return
MCC considers a 10% economic rate of return (ERR) as the threshold to proceed with investment.- RN2: 10.9% RN6: 11.3% Original ERR (2009)
- RN2: 5.3% RN6: 2% Evaluator ERR (2020)
MCC Learning
- Having more reliable data sources on road conditions, traffic counts and traffic growth could have improved the design during compact development.
- Building road maintenance into the compact through capacity building and the reform of existing policies/procedures could strengthen the maintenance agency’s ability to weather eventual management and funding challenges.
- Standardizing the content and quality of road data collection sources across the project could help improve data quality controls and the credibility of findings.
Evaluation Methods
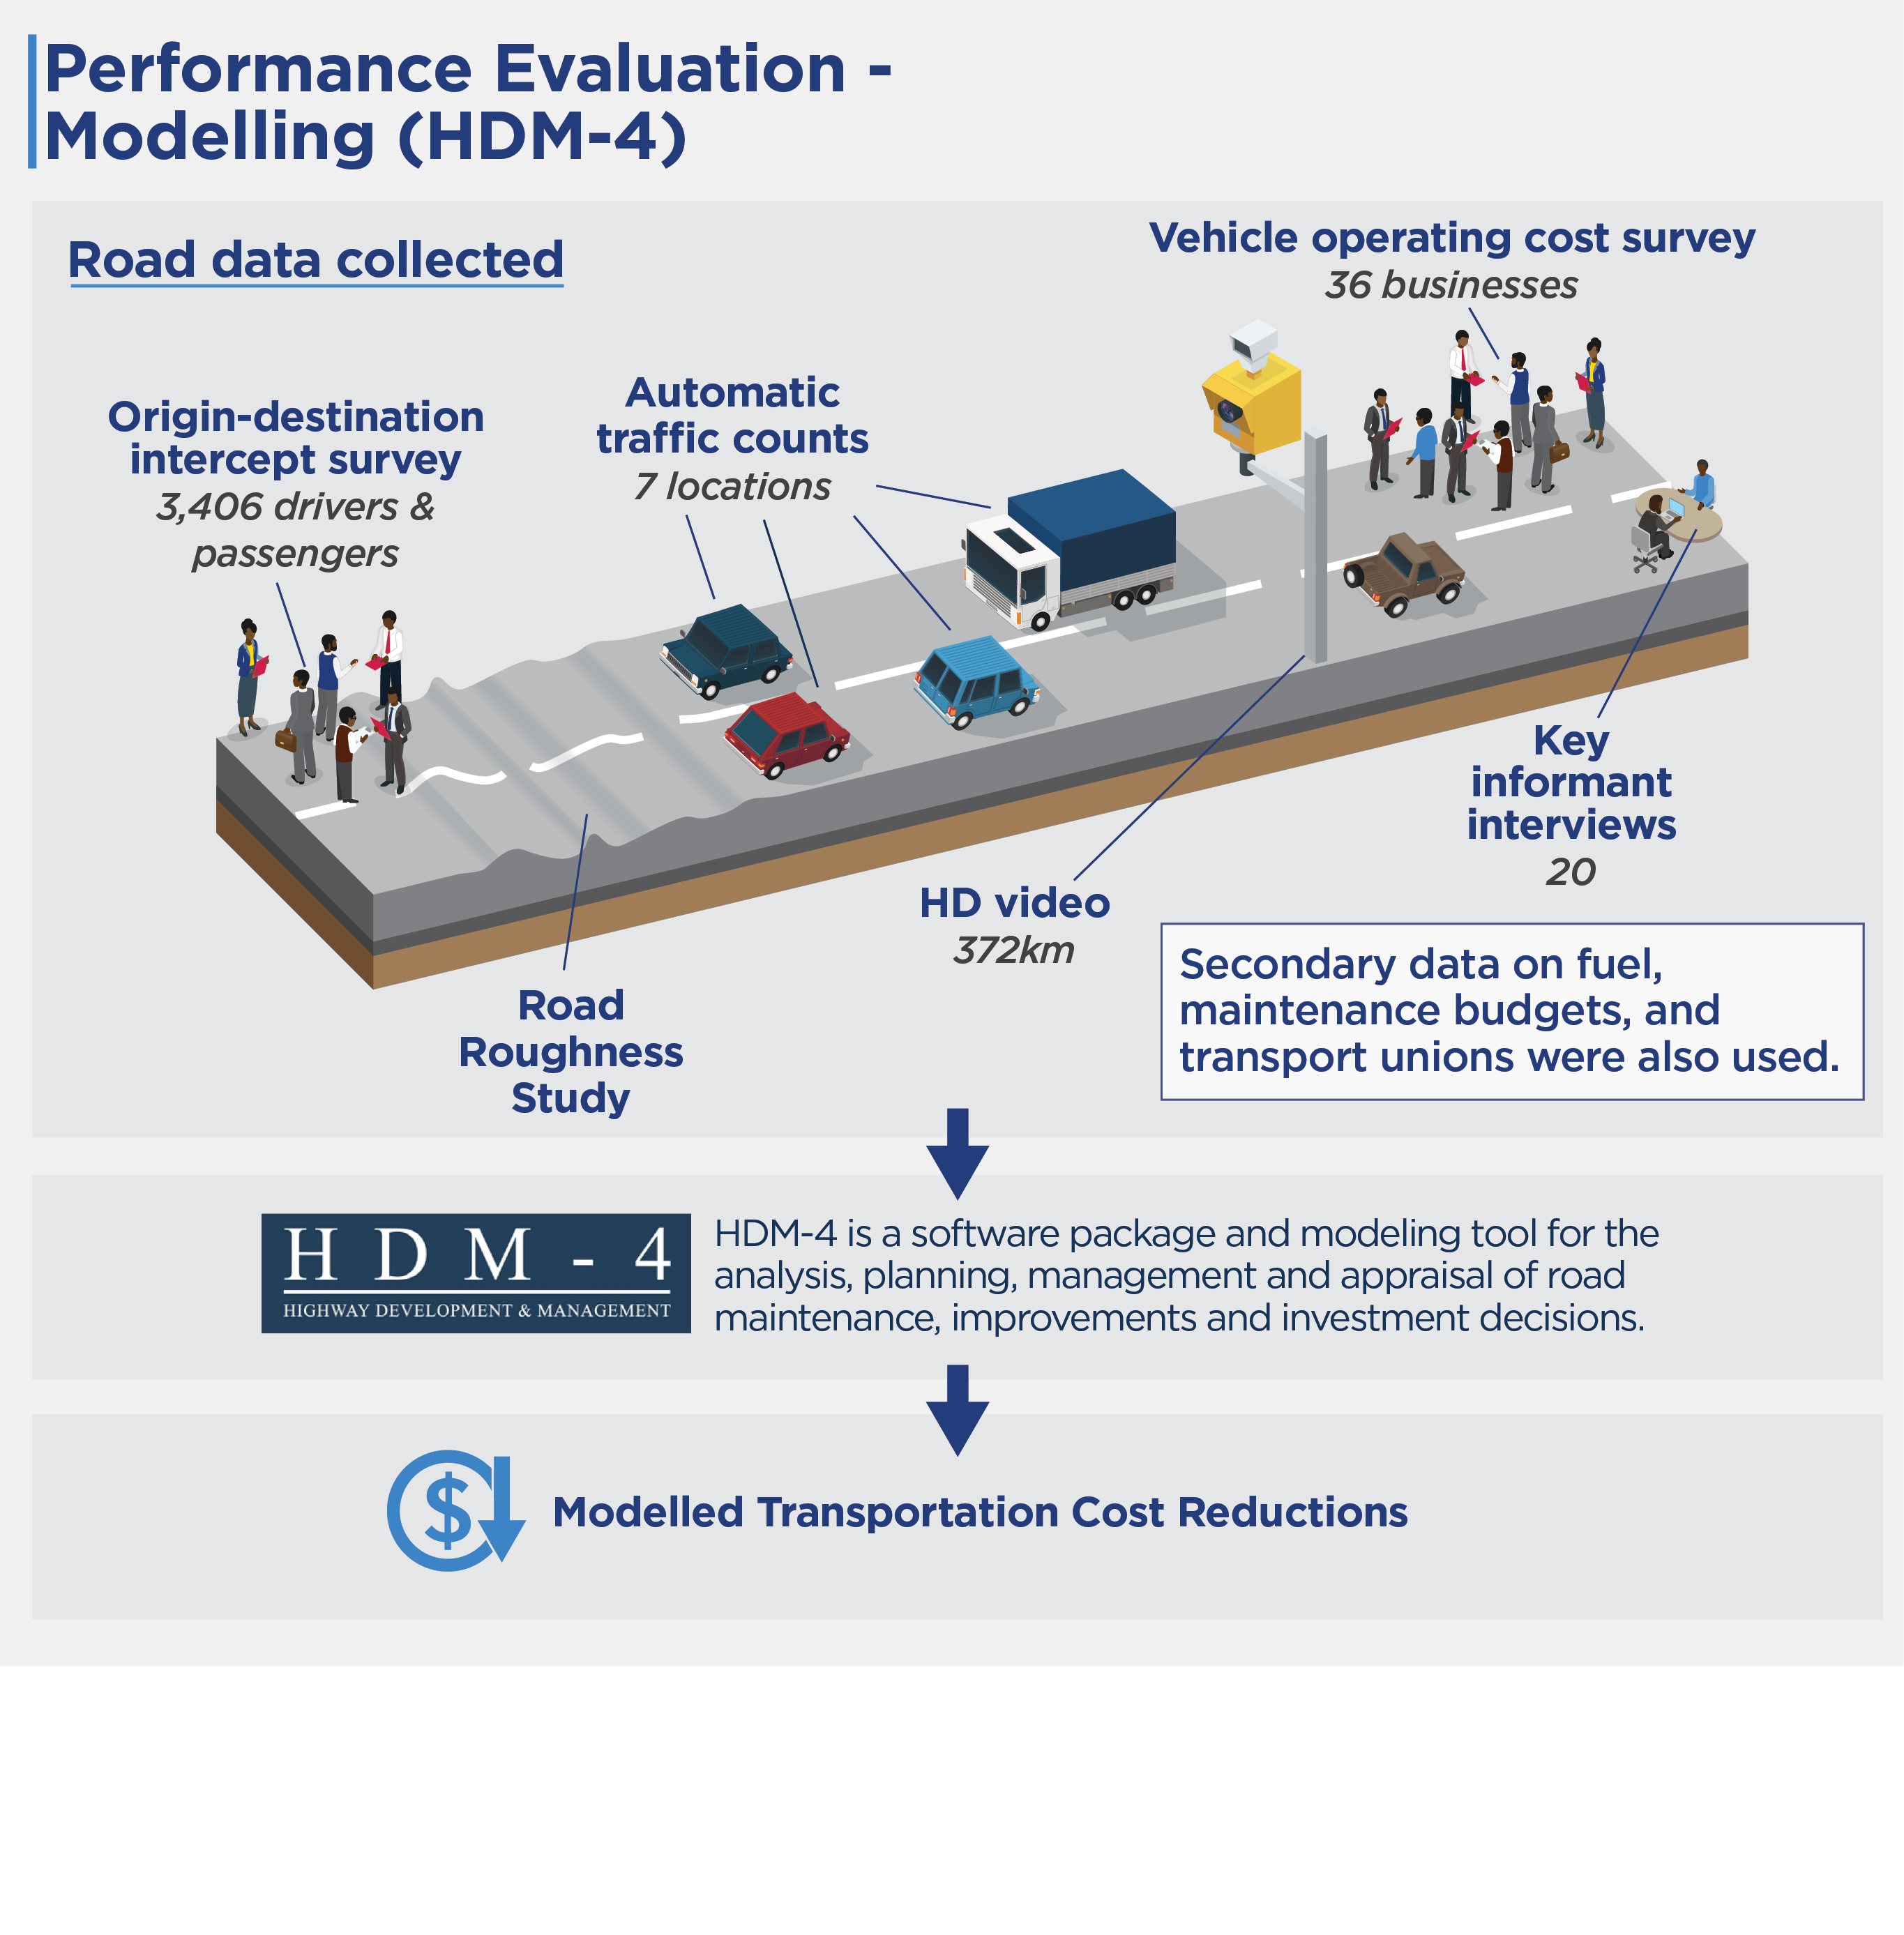
Quantitative data collection included automatic traffic counts (7 locations), an origin-destination intercept survey (3,406 drivers and passengers), a vehicle operating costs survey (36 businesses), a road roughness study, and high-definition video (372 kilometers). Qualitative data collection included 20 key informant interviews conducted remotely. Secondary data on fuel, maintenance budgets and transport unions was also used.
2021-002-2607