

Introduction
The Millennium Challenge Corporation (MCC) is an independent U.S. Government agency focused on advancing America’s economic and strategic interests through results-driven foreign assistance.
Each year, the MCC Board of Directors (Board) selects countries as eligible for MCC assistance. The selection process begins with the Board identifying candidate countries to consider; which, by statute, are all countries with per capita incomes below the World Bank’s threshold for initiating the International Bank for Reconstruction and Development graduation process that are not prohibited from receiving assistance by federal law. For a candidate country to then be selected as eligible to receive assistance, it must demonstrate a commitment to ruling justly, investing in its people, and economic freedom as measured by independent policy indicators. These indicators inform the Board of candidate countries’ enabling environments for investments in shared prosperity and economic growth.
These indicators are compiled into country scorecards. This is a guide to understanding and interpreting the indicators used on the country scorecards by MCC in Fiscal Year 2026. It provides an overview of the policies measured by the indicators, the relationship that these policies have to economic growth, and the methodologies used to measure policy performance. This document also describes how MCC constructs the final indicators. The scorecards produced using these indicators are available at: https://www.mcc.gov/who-we-select/scorecards.
For general questions about the application of these indicators, please contact MCC’s Selection, Eligibility, and Policy Performance Division at DevelopmentPolicy@mcc.gov.
Indicators—What They Measure
The MCC scorecards measure performance on the policy criteria mandated in MCC’s authorizing legislation. By using information collected from independent sources, MCC’s country selection process allows for an objective, comparable analysis across candidate countries.
MCC prioritizes indicators that:
- use an analytically-rigorous methodology and objective, high-quality data,
- are publicly available,
- have broad country-coverage among MCC candidate countries,
- are comparable across countries,
- have a clear theoretical or empirical link to economic growth,
- are policy-linked, (i.e. measure factors that governments can influence), and
- have appropriate consistency in results from year to year.
Ruling Justly
These indicators measure just and democratic governance, including a country’s demonstrated commitment to promoting political pluralism, equality, and the rule of law; respecting human and civil rights; protecting private property rights; encouraging transparency and accountability of government; and combating corruption.
- Control of Corruption – An index of surveys and expert assessments that rate countries on: “grand corruption” in the political arena; the frequency of petty corruption; the effects of corruption on the business environment; and the tendency of elites to engage in “state capture,” among other things.
- Government Accountability – Independent experts rate countries on: government accountability and transparency; freedom of speech and discussion; the prevalence of free and fair electoral processes; political pluralism and participation of all stakeholders; freedom from domination by the military, foreign powers, totalitarian parties, religious hierarchies and economic oligarchies; and the political rights of all groups, among other things.
- Personal Freedom – Independent experts rate countries on: property rights; religious freedom; freedom of expression; association and organizational rights; rule of law and human rights; constraints on various branches of the government; and personal autonomy and economic rights, among other things.
- Government Effectiveness – An index of surveys and expert assessments that rate countries on: the quality of public service provision; civil servants’ competency and independence from political pressures; and the government’s ability to plan and implement sound policies, among other things.
- Rule of Law - An index of surveys and expert assessments that rate countries on: the extent to which the public has confidence in and abides by the rules of society; the incidence and impact of violent and nonviolent crime; the effectiveness, independence, and predictability of the judiciary; the protection of property rights; and the enforceability of contracts, among other things.
- Freedom of Information - Measures the legal and practical steps taken by a government to enable or allow information to move freely through society; this includes measures of press freedom, national freedom of information laws, and as a proxy for freedom of speech, the extent to which a country is shutting down the internet or social media.
Investing in People
These indicators measure investments in the promotion of broad-based education, strengthened capacity to provide quality public health, the reduction of child mortality, and the management of natural resources.
- Health Expenditures – Total expenditures on health by government (excluding funding sourced from external donors) at all levels divided by gross domestic product (GDP).
- Child Health – An index made up of three indicators: access to improved water, access to improved sanitation, and child (ages 1-4) mortality.
- Chronic Disease – An indicator measuring the prevalence of chronic diseases. Measures the likelihood of dying between ages 30 and 70 due to cardiovascular disease, cancer, diabetes, or chronic respiratory disease.
- Workforce Development – An indicator measuring education within the workforce. This indicator measures the proportion of youth and adults enrolled in training, non-formal education, and formal education in the last 12 months.
- Girls’ Primary Education Completion Rate – The number of female students enrolled in the last grade of primary education minus repeaters divided by the population in the relevant age cohort (gross intake ratio in the last grade of primary). Countries with a GNI/capita of $2,155 or less are assessed on this indicator.
- Girls’ Lower Secondary Education Completion Rate – The number of female pupils that have completed the last grade of lower secondary education divided by the population within three to five years of the intended age of completion, expressed as a percentage of the total population of females in the same age group. Countries with a GNI/capita between $2,156 and $4,495 are assessed on this indicator instead of Girls’ Primary Completion Rate.
- Girls’ Upper Secondary Education Completion Rate – The number of female pupils that have completed the last grade of upper secondary education divided by the population within three to five years of the intended age of completion, expressed as a percentage of the total population of females in the same age group. Countries with a GNI/capita between $4,496 and $7,855 are assessed on this indicator instead of Girls’ Primary Completion Rate.
- Natural Resource Protection – Assesses a country government’s commitment to preserving biodiversity and natural habitats, responsibly managing ecosystems and fisheries, and engaging in sustainable agriculture.
Encouraging Economic Freedom
These indicators measure the extent to which a government encourages economic freedom, including a demonstrated commitment to economic policies that: encourage individuals and firms to participate in global trade and international capital markets, promote private sector growth, and strengthen market forces in the economy.
- Business Start-Up – An index that rates countries on the time and cost of complying with all procedures officially required for an entrepreneur to start up and formally operate an industrial or commercial business as well as the overall business environment in a country.
- Market Competitiveness – An index measuring a country government’s commitment to strengthening market forces in the economy by promoting a business environment that allows for innovation and open competition while limiting expropriation, state control of industry, and monopolies.
- International Market Access – An index measuring a country government’s commitment to the free movement of capital, citizen access to international capital markets, and the barriers to global market access through import or export controls.
- Regulatory Quality – An index of surveys and expert assessments that rate countries on: the burden of regulations on business; price controls; the government’s role in the economy; and foreign investment regulation, among other areas.
- Property and Land Rights – An index that rates countries on: the extent to which the institutional, legal, and market framework provides secure land tenure and access to land in rural areas and the extent to which all individuals have the right to private property in practice and in law, including measures of intellectual property rights, risk of expropriation, and the quality of contract enforcement.
- Trade Policy – A measure of a country’s openness to international trade based on weighted average tariff rates and non-tariff barriers to trade.
- Inflation – The most recent average annual change in consumer prices.
- Access to Credit – An index that ranks countries based on access and use of formal and informal financial services as measured by the number of bank branches and ATMs per 100,000 adults and the share of adults that have an account at a traditional financial institution or money market provider.
- Employment Opportunity – Measures a country government’s commitment to ending slavery and forced labor, preventing employment discrimination, and protecting the rights of workers and people with disabilities.
- Women in the Economy – An index that measures the extent to which laws provide both men and women the ability to generate income or participate in the economy, including factors such as the capacity to access institutions, get a job, register a business, sign a contract, open a bank account, choose where to live, to travel freely, property rights protections, protections against domestic violence, and child marriage, among others.
Determining MCC Candidacy
For Fiscal Year 2026 (FY26), 105 countries meet the income parameters for MCC candidacy (with 88 being candidates and 17 meeting the income parameters but that are statutorily prohibited from receiving assistance).1 MCC creates scorecards for all 105 countries that meet the income parameters. A country is determined to be an MCC candidate if its per capita income falls within predetermined parameters set by Congress, and it is not subject to certain restriction on U.S. foreign assistance. The country must be classified as having a Gross National Income (GNI) per capita (Atlas Method) less than the World Bank’s threshold for initiating the International Bank for Reconstruction and Development graduation process of $7,855 in FY26, as published in the World Bank’s July release of income data.2 See the FY 2026 Candidate Country Report for more information: www.mcc.gov/resources/doc/report-candidate-country-report-fy2026.
Setting the Scorecard Income Groups
For FY26, MCC is continuing to use the historical ceiling for eligibility as set by the World Bank’s International Development Association (IDA) (often referred to as the ‘Historical IDA Threshold’) and the threshold between Lower Middle Income Countries and Upper Middle Income countries to divide the 105 countries into three income groups for the purpose of comparative analysis on the scorecard policy performance indicators. These three income groups are: 1) countries whose GNI per capita is less than or equal to $2,155 in FY26, 2) those countries whose GNI per capita falls between $2,156 and $4,495 in FY26, and 3) those countries whose GNI per capita falls between $4,496 and $7,855.
Indicator Performance
A country is considered to “pass” a given indicator if it performs better than the median score in its income group or the absolute threshold (for certain indicators – see below). A country is considered to “pass” the scorecard if it: (i) “passes” at least 11 of the 22 indicators; (ii) “passes” the Personal Freedom indicator; and (iii) “passes” either the Control of Corruption indicator or the Government Accountability indicator. For technical specifics regarding how these medians are calculated see the Note on Calculating Medians at the end of this document. Indicators with absolute thresholds in lieu of a median include:
- Inflation, on which a country’s inflation rate must be under a fixed ceiling of 15 percent;
- Government Accountability, on which countries must score above 17; and
- Personal Freedom, on which countries must score above 25.
The Board also takes into consideration whether a country performs substantially worse in any category (Ruling Justly, Investing in People, or Economic Freedom) than it does on the overall scorecard. While the indicator methodology is an important basis for determining which countries will be eligible for assistance, the Board also considers supplemental information and takes into account factors such as time lags and gaps in the data used to determine indicator scores. Beyond the scorecard, the Board also considers supplemental information on the opportunity to advance America First priorities and invest in shared prosperity.
Example Scorecard:
For reference, this is an example of a scorecard from FY26 and a guide for reading each of the indicators.
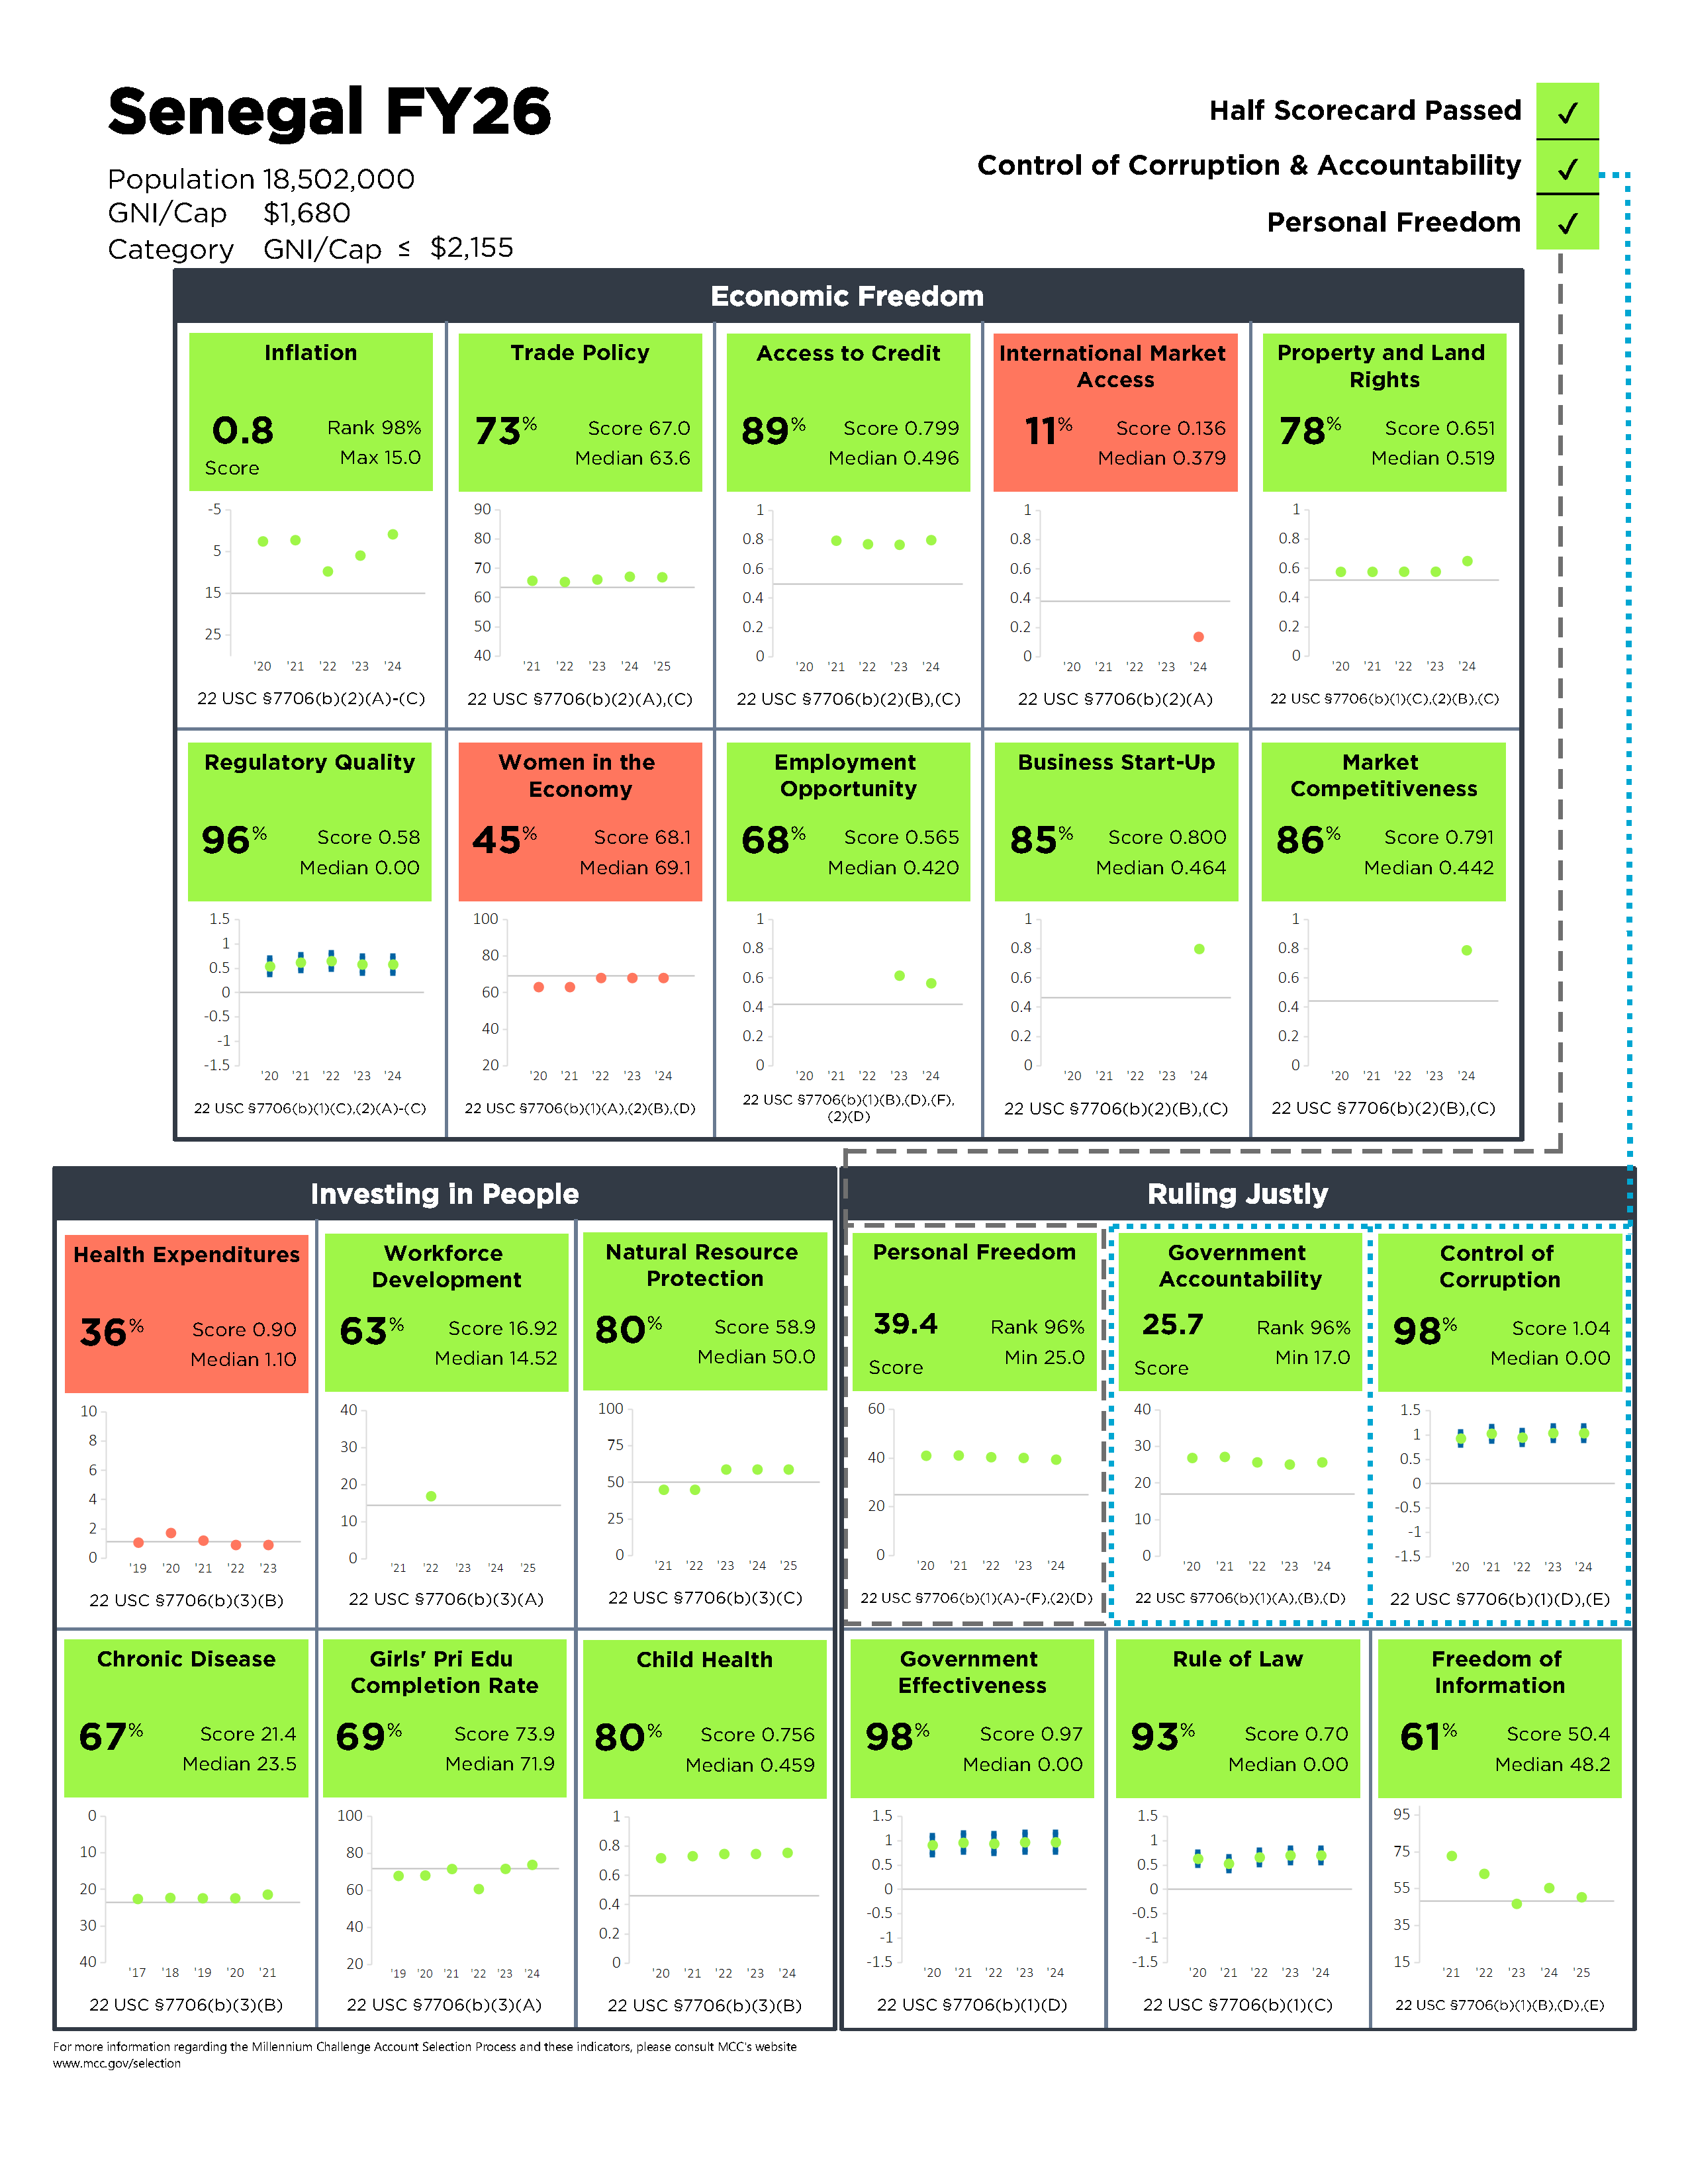

*For the Government Accountability, Personal Freedom, and Inflation indicators, the score and percent ranking are reversed due to those indicators operating on a minimum or maximum-score system rather than a median based system.
Ruling Justly Category
The six indicators in this category measure just and democratic governance by assessing, among other things, a country’s demonstrated commitment to promote political pluralism, equality, and the rule of law; respect human and civil rights, including the rights of people with disabilities; protect private property rights; encourage transparency and accountability of government; and combat corruption.
Control of Corruption Indicator
This indicator measures the extent to which public power is exercised for private grain, including both petty and grand forms of corruption, as well as “capture” of the state by elites and private interests. It also measures the strength and effectiveness of a country’s policy and institutional framework to prevent and combat corruption.
Countries are evaluated on the following factors:
- The prevalence of grand corruption and petty corruption at all levels of government;
- The effect of corruption on the “attractiveness” of a country as a place to do business;
- The frequency of “irregular payments” associated with import and export permits, public contracts, public utilities, tax assessments, and judicial decisions;
- Nepotism, cronyism and patronage in the civil service;
- The estimated cost of bribery as a share of a company’s annual sales;
- The perceived involvement of elected officials, border officials, tax officials, judges, and magistrates in corruption;
- The strength and effectiveness of a government’s anti-corruption laws, policies, and institutions;
- The extent to which:
- processes are put in place for accountability and transparency in decision-making and disclosure of information at the local level;
- government authorities monitor the prevalence of corruption and implement sanctions transparently;
- conflict of interest and ethics rules for public servants are observed and enforced;
- the income and asset declarations of public officials are subject to verification and open to public and media scrutiny;
- senior government officials are immune from prosecution under the law for malfeasance;
- the government provides victims of corruption with adequate mechanisms to pursue their rights;
- the tax administrator implements effective internal audit systems to ensure the accountability of tax collection;
- the executive budget-making process is comprehensive and transparent and subject to meaningful legislative review and scrutiny;
- the government ensures transparency, open-bidding, and effective competition in the awarding of government contracts;
- there are legal and functional protections for whistleblowers, anti-corruption activists, and investigators;
- allegations of corruption at the national and local level are thoroughly investigated and prosecuted without prejudice;
- government is free from excessive bureaucratic regulations, registration requirements, and/or other controls that increase opportunities for corruption;
- citizens have a legal right to information about government operations and can obtain government documents at a nominal cost.
Relationship to Economic Growth
Corruption hinders economic growth by increasing costs, lowering productivity, discouraging investment, reducing confidence in public institutions, limiting the development of small and medium-sized enterprises, weakening systems of public financial management, and undermining investments in health and education.3 Corruption can also increase poverty by slowing economic growth, skewing government expenditure in favor of the rich and well-connected, concentrating public investment in unproductive projects, promoting a more regressive tax system, siphoning funds away from essential public services, adding a higher level of risk to the investment decisions of low-income individuals, and reinforcing patterns of unequal asset ownership, thereby limiting the ability of the poor to borrow and increase their income.4
Indicator Institution Methodology
The indicator is an index combining a subset of 24 different assessments and surveys, depending on availability, each of which receives a different weight, depending on its estimated precision and country coverage. The Control of Corruption indicator draws on data, as applicable, from the Country Policy and Institutional Assessments of the World Bank, the African Development Bank, the Asian Development Bank, the Afrobarometer Survey, the World Bank’s Business Environment and Enterprise Performance Survey, the Bertelsmann Foundation’s Bertelsmann Transformation Index, the Economist Intelligence Unit’s Country Risk Service, The University of Gothenburg’s European Quality of Government Index, Transparency International’s Global Corruption Barometer survey, the World Economic Forum’s Global Competitiveness Report, Global Integrity’s African Integrity Index (previously known as the Global Integrity Index), the Gallup World Poll, Freedom House’s Nation in Transit, Freedom House’s Countries at the Crossroads, the International Fund for Agricultural Development’s Rural Sector Performance Assessments, Political Economic Risk Consultancy’s Corruption in Asia, Political Risk Service’s International Country Risk Guide, Vanderbilt University Americas Barometer Survey, the Institute for Management and Development’s World Competitiveness Yearbook, Varieties of Democracy’s Corruption Index, the French Government’s Institutional Profiles Database, IHS Markit’s World Economic Service, the World Bank's Enterprise Surveys, and the World Justice Project’s Rule of Law Index. This indicator is sourced from the Worldwide Governance Indicators (WGI) from the World Bank/Brookings Institution, http://info.worldbank.org/governance/wgi/.
MCC Methodology
MCC Normalized Score = WGI Score - median score
For ease of interpretation, MCC has adjusted the median for each of the scorecard income pools to zero for most of the Worldwide Governance Indicators. Country scores are calculated by taking the difference between actual scores and the median. For example, in FY25 the unadjusted median for the scorecard category of countries with a Gross National Income (GNI) per capita between $2,166 and $4,515 on Control of Corruption was -0.40 (note, in FY26, the GNI per capita range for this scorecard category is $2,156 to $4,495). In order to set the median at zero, MCC simply adds 0.40 to each country’s score (the same thing as subtracting a negative 0.54). Therefore, as an example, Bhutan’s FY25 Control of Corruption score, which was originally 1.53, was adjusted to 1.93.
The FY26 scores come from the 2024 update of the Worldwide Governance Indicators dataset and largely reflect performance in calendar year 2023. Since the release of the 2006 update of the Worldwide Governance Indicators, the indicators are updated annually. Each year, the World Bank and Brookings Institution also make minor backward revisions to the historical data. Prior to 2006, the World Bank released data every two years (1996, 1998, 2000, 2002 and 2004). With the 2006 release, the World Bank moved to an annual reporting cycle and provided additional historical data for 2003 and 2005.
Government Accountability Indicator
This indicator measures country performance on the quality of government accountability and transparency, electoral processes, political pluralism and participation, free speech, and fair political treatment of all groups.
Countries are rated on the following factors:
- the extent of government control of territory and citizen views of the government as legitimate;
- Effective deterrence of corruption, minimal opportunities for corruption, transparency of the civil service and government functions, and oversight over the government;
- the openness, transparency, and accountability of the government to its constituents between elections; freedom from pervasive government corruption; government policies that reflect the will of the people;
- freedom of speech and discussion;
- the conduct of executive and legislative elections; polling; tabulation of votes; electoral laws; campaigning opportunities;
- the ability of different political parties and political groupings to organize; the political system’s responsiveness to the rise and fall of competing political parties and groupings;
- the ability of the opposition to participate in the political process;
- the participation of various demographic groups in political life; and
- freedom from domination by the military, foreign powers, totalitarian parties, religious hierarchies, economic oligarchies, or any other powerful group in making personal political choices.
Relationship to Economic Growth
Although the relationship between government accountability, democracy, and economic growth is complex, research suggests that government accountability is connected with growth and poverty reduction.5 The institutional structures that maintain accountable government can promote growth by increasing policy stability, cultivating higher rates of human capital accumulation, reducing levels of corruption, and encouraging higher rates of investment.6 The links between government accountability and shared prosperity are similarly complicated, but there is evidence that institutions that are accountable to their people are better at reducing economic volatility and provide a more consistent approach to mutual prosperity than those without such accountability mechanisms.7
Indicator Institution Methodology
This indicator comes from the TRACE Bribery Risk Matrix (TRACE), https://www.traceinternational.org/trace-matrix, and The Bertelsmann Transformation Index (BTI), https://bti-project.org/.
A country’s score on this indicator is the average of its normalized TRACE total risk score and its normalized BTI Political Transformation score.
- Total Risk Score (TRACE): TRACE aggregates data from a range of sources such as the World Bank to assess countries on several criteria related to corruption risk. Specifically, they capture the opportunities for corruption (interaction with the government, expectation to pay bribes, and leverage/regulatory burden), deterrence against corruption (social dissuasion against corruption and government enforcement), transparency of the government and civil service, and oversight over government activities. These components are aggregated into a single index of the bribery risk in a country. TRACE’s complete methodology can be found here: https://matrixbrowser.traceinternational.org.
- Political Transformation (Bertelsmann Transformation Index): The Political Transformation index of BTI measures the stability of the state, the political participation of its citizens, the strength of the rule of law, and the stability of its institutions. Each of these components has several sub-components. The data are a qualitative assessment by experts who assess each country on the different components of the index. A full description of BTI’s methodology can be found here: https://bti-project.org/en/methodology.
MCC Methodology
MCC has historically used the absolute threshold of 17 to determine whether countries are passing this indicator. In order to maintain this threshold, MCC normalizes both the TRACE data and the BTI data to the former scale using a linear regression described below then averages the two sources together.
- TRACE Bribery Risk Matrix: TRACE’s scores range from 0 to 100, where 0 is the least corrupt and 100 is the most corrupt. In order to put these on a consistent scale, MCC uses the following equation to normalize the data:
Normalized TRACE = (-0.5251819)(TRACE) + 49.78367.8 This means that a score of 20 on TRACE would translate into a normalized score of 39.
- BTI Political Transformation: BTI’s scores range from 0 to 10, where 0 is the lowest and 10 is the highest. In order to put these on a consistent scale, MCC used the following equation to normalize the data: Normalized BTI = (5.483139)(BTI) – 11.50298.9 This means that a score of 5 on BTI translates to a normalized score of 15.9.
The overall score is then calculated as the simple average of the Normalized TRACE Score and the Normalized BTI score. Government Accountability Score = (Normalized TRACE + Normalized BTI)/2. When one of the sub-sources is missing, the other is used. All values are reported based on the actual calendar year covered by the data.
Personal Freedom Indicator
This indicator measures freedom of expression and belief, associational and organizational rights, rule of law and human rights, personal autonomy, individual and economic rights, and the independence of the judiciary.
Countries are rated on the following factors:
- freedom of expression, religious institutions and expression, and academia;
- freedom of assembly and demonstration, and of political organization and professional organization;
- independence of the media and the judiciary;
- freedom from economic exploitation;
- protection from undue use of force, unjustified imprisonment, exile, and torture;
- the existence of rule of law, personal property rights, and equal treatment under the law;
- freedom from indoctrination and excessive dependency on the state;
- equality of opportunity;
- freedom to choose where to travel, reside, and work;
- judicial and legislative restraints on the executive;
- protection from domestic violence; and
- the existence of a legal framework to grant asylum or refugee status in accordance with international and regional conventions and system for refugee protection.
Relationship to Economic Growth
Personal freedom is a key component of economic growth.10 Studies show that an expansion of freedom and liberty can promote economic growth by reducing social conflict, removing legal impediments to participation in the economy, encouraging adherence to the rule of law, enhancing protection of property rights, increasing economic rates of return on government projects, and reducing the risk of project failure.11 Additional research has shown that personal freedoms have a positive effect on domestic investment and productivity, increase the success of investments by international actors, enhance economic freedoms, and can bolster growth through the freedom of mobility for individuals.12
Indicator Institution Methodology
A country’s score on this indicator is the normalized estimate for the Voice and Accountability indicator from the World Bank’s WGI dataset. This indicator is an aggregate of other indicators measuring personal freedom. It captures freedom of expression, the perception of the extent to which citizens can participate in selecting their government, freedom of association and a free media. The index uses a subset of 22 sources for each country. This indicator is sourced from the Worldwide Governance Indicators (WGI) from the World Bank/Brookings Institution, http://info.worldbank.org/governance/wgi.
MCC Methodology
MCC has historically used the absolute threshold of 25 to determine whether countries are passing this indicator. The Voice and Accountability scale ranges from around a -2.5 to 2.5. In order to maintain this threshold, MCC normalizes Voice and Accountability using the following equation to create the Personal Freedom indicator: Normalized Voice and Accountability = (16.16412)(Voice and Accountability) + 37.23711.13 This means that a score of 1 on Voice and Accountability would equal a score of 53 on Personal Freedom. Values are from the 2024 WGI report reflecting the world of 2023.
Government Effectiveness Indicator
This indicator measures the quality of public services, the quality of the civil service and its independence from political pressures, the quality of policy formulation and implementation, and the credibility of the government’s commitment to its stated policies.
Countries are evaluated on the following factors:
- competence of civil service; effective implementation of government decisions; and public service vulnerability to undue political pressure;
- flexibility, learning, and innovation within the political leadership; ability to coordinate conflicting objectives into coherent policies;
- the efficiency of revenue mobilization and budget management;
- the quality of transportation infrastructure, telecommunications, electricity supply, public health care provision, and public schools; the availability of online government services;
- prevalence of red tape; the degree to which bureaucratic delays hinder business activity;
- existence of a taxpayer service and information program, and an efficient and effective appeals mechanism;
- policy consistency; the extent to which government commitments are honored by new governments;
- ability to manage political alternations without drastic policy changes or interruptions in government services;
- the extent to which:
- effective coordination mechanisms ensure policy consistency across departmental boundaries, and administrative structures are organized along functional lines with little duplication;
- the business processes of government agencies are regularly reviewed to ensure efficiency of decision making and implementation;
- political leadership sets and maintains strategic priorities and the government effectively implements reforms;
- hiring and promotion within the government is based on merit and performance, and ethical standards prevail;
- the government wage bill is sustainable and does not crowd out spending required for public services; pay and benefit levels do not deter talented people from entering the public sector; flexibility (that is not abused) exists to pay more attractive wages in hard-to-fill positions;
- government revenues are generated by low-distortion taxes; import tariffs are low and relatively uniform, export rebate or duty drawbacks are functional; the tax base is broad and free of arbitrary exemptions; tax administration is effective and rule-based; and tax administration and compliance costs are low;
- policies and priorities are linked to the budget; multi-year expenditure projections are integrated into the budget formulation process, and reflect explicit costing of the implications of new policy initiatives; the budget is formulated through systematic consultations with spending ministries and the legislature, adhering to a fixed budget calendar; the budget classification system is comprehensive and consistent with international standards; and off-budget expenditures are kept to a minimum and handled transparently;
- the budget is implemented as planned, and actual expenditures deviate only slightly from planned levels;
- budget monitoring occurs throughout the year based on well-functioning management information systems; reconciliation of banking and fiscal records is practiced comprehensively, properly, and in a timely way;
- in-year fiscal reports and public accounts are prepared promptly and regularly and provide full and accurate data; the extent to which accounts are audited in a timely, professional and comprehensive manner, and appropriate action is taken on budget reports and audit findings.
Relationship to Economic Growth
Countries with more effective governments tend to achieve higher levels of economic growth by obtaining better credit ratings and attracting more investment, offering higher quality public services and encouraging higher levels of human capital accumulation, putting foreign aid resources to better use, accelerating technological innovation, and increasing the productivity of government spending.14 Efficiency in the delivery of public services also has a direct impact on poverty.15 On average, countries with more effective governments have better educational systems and more efficient health care.16 There is evidence that countries with independent, meritocratic bureaucracies do a better job of vaccinating children, protecting the most vulnerable members of society, reducing child mortality, and curbing environmental degradation.17 Countries with a meritocratic civil service also tend to have lower levels of corruption.18
Indicator Institution Methodology
The indicator is an index combining a subset of 18 different assessments and surveys, depending on availability, each of which receives a different weight, depending on its estimated precision and country coverage. The Government Effectiveness indicator draws on data, as applicable, from the Country Policy and Institutional Assessments of the World Bank, the African Development Bank, the Asian Development Bank, the Afrobarometer Survey, the World Bank’s Business Environment and Enterprise Performance Survey, the Bertelsmann Foundation’s Bertelsmann Transformation Index, Global Integrity’s African Integrity Index (previously known as the Global Integrity Index), the Economist Intelligence Unit’s Country Risk Service, The University of Gothenburg’s European Quality of Government Index, the World Economic Forum’s Global Competitiveness Report, the Gallup World Poll, the International Fund for Agricultural Development’s Rural Sector Performance Assessments, the Latinobarometro Survey, Political Risk Service’s International Country Risk Guide, the French Government’s Institutional Profiles Database, IHS Markit’s World Economic Service, the World Bank's Enterprise Surveys, and the Institute for Management and Development’s World Competitiveness Yearbook. This indicator is sourced from the Worldwide Governance Indicators (WGI) from the World Bank/Brookings Institution, http://info.worldbank.org/governance/wgi.
MCC Methodology
MCC Normalized Score = WGI Score - median score
For ease of interpretation, MCC has adjusted the median for each of the scorecard income pools to zero for most of the Worldwide Governance Indicators. Country scores are calculated by taking the difference between actual scores and the median. For example, in FY25 the unadjusted median for the scorecard category of countries with a Gross National Income (GNI) per capita between $2,166 and $4,515 on Control of Corruption was -0.40 (note, in FY26, the GNI per capita range for this scorecard category is $2,156 to $4,495). In order to set the median at zero, MCC simply adds 0.40 to each country’s score (the same thing as subtracting a negative 0.54). Therefore, as an example, Bhutan’s FY25 Control of Corruption score, which was originally 1.53, was adjusted to 1.93.
The FY26 scores come from the 2024 update of the Worldwide Governance Indicators dataset and largely reflect performance in calendar year 2023. Since the release of the 2006 update of the Worldwide Governance Indicators, the indicators are updated annually. Each year, the World Bank and Brookings Institution also make minor backward revisions to the historical data. Prior to 2006, the World Bank released data every two years (1996, 1998, 2000, 2002 and 2004). With the 2006 release, the World Bank moved to an annual reporting cycle and provided additional historical data for 2003 and 2005.
Rule of Law Indicator
This indicator measures the extent to which individuals and firms have confidence in and abide by the rules of society; in particular, it measures the functioning and independence of the judiciary, including the police, the protection of property rights, the quality of contract enforcement, as well as the likelihood of crime and violence.
Countries are evaluated on the following factors:
- public confidence in the police force and judicial system; popular observance of the law; a tradition of law and order; strength and impartiality of the legal system;
- prevalence of petty crime, violent crime, and organized crime; foreign kidnappings; economic impact of crime on local businesses; prevalence of human trafficking; government commitment to combating human trafficking;
- the extent to which a well-functioning and accountable police force protects citizens and their property from crime and violence; when serious crimes do occur, the extent to which they are reported to the police and investigated;
- security of private property rights; protection of intellectual property; the accuracy and integrity of the property registry; whether citizens are protected from arbitrary and/or unjust deprivation of property;
- the enforceability of private contracts and government contracts;
- the existence of an institutional, legal, and market framework for secure land tenure; access to land among men and women; effective management of common property resources; equitable user-rights over water resources for agriculture and local participation in the management of water resources;
- the prevalence of tax evasion and insider trading; size of the informal economy;
- independence, effectiveness, predictability, and integrity of the judiciary; compliance with court rulings; legal recourse for challenging government actions; ability to sue the government through independent and impartial courts; willingness of citizens to accept legal adjudication over physical and illegal measures; government compliance with judicial decisions, which are not subject to change except through established procedures for judicial review;
- the independence of prosecutors from political direction and control;
- the existence of effective and democratic civilian state control of the police, military, and internal security forces through the judicial, legislative, and executive branches; the police, military, and internal security services respect human rights and are held accountable for any abuses of power;
- impartiality and nondiscrimination in the administration of justice; citizens are given a fair, public, and timely hearing by a competent, independent, and impartial tribunal; citizens have the right to independent counsel and those charged with serious felonies are provided access to independent counsel when it is beyond their means; low-cost means are available for pursuing small claims; citizens can pursue claims against the state without fear of retaliation;
- protection of judges and magistrates from interference by the executive and legislative branches; judges are appointed, promoted, and dismissed in a fair and unbiased manner; judges are appropriately trained to carry out justice in a fair and unbiased manner; members of the national-level judiciary must give reasons for their decisions; existence of a judicial ombudsman (or equivalent agency or mechanism) that can initiate investigations and impose penalties on offenders;
- law enforcement agencies are protected from political interference and have sufficient budgets to carry out their mandates; appointments to law enforcement agencies are made according to professional criteria; law enforcement officials are not immune from criminal proceedings;
- the existence of an independent reporting mechanism for citizens to complain about police actions; timeliness of government response to citizen complaints about police actions.
Relationship to Economic Growth
Judicial independence is strongly linked to growth as it promotes a stable investment environment.19 On average, business environments characterized by consistent policies and credible rules, such as secure property rights and contract enforceability, create higher levels of investment and growth.20 Secure property rights and contract enforceability also have a positive impact on poverty by granting citizens secure rights to their own assets.21 Research shows that people who do not have the resources or the connections to protect their rights informally are usually in most need of formal protection through efficient legal systems.22
Indicator Institution Methodology
The indicator is an index combining a subset of 24 different assessments and surveys, depending on availability, each of which receives a different weight, depending on its estimated precision and country coverage. The Rule of Law indicator draws on data, as applicable, the Country Policy and Institutional Assessments of the World Bank, the African Development Bank and the Asian Development Bank, the Afrobarometer Survey, the World Bank’s Business Environment and Enterprise Performance Survey, the Bertelsmann Foundation’s Bertelsmann Transformation Index, Freedom House’s Nations in Transit report, Freedom House’s Countries at the Crossroads report, the Economist Intelligence Unit’s Country Risk Service, The University of Gothenburg’s European Quality of Government Index, the World Economic Forum’s Global Competitiveness Report, Global Integrity’s African Integrity Index (previously known as the Global Integrity Index), the Gallup World Poll, the Heritage Foundation’s Index of Economic Freedom, the International Fund for Agricultural Development’s Rural Sector Performance Assessments, the Latinobarometro Survey, Political Risk Service’s International Country Risk Guide, the United States State Department’s Trafficking in Persons Report, Vanderbilt University’s Americas Barometer, Institute for Management and Development’s World Competitiveness Yearbook, Varieties of Democracy’s Liberal Component Index, the French Government’s Institutional Profiles database, the World Bank's Enterprise Surveys, IHS Markit’s World Economic Service, and the World Justice Project’s Rule of Law Index. This indicator is sourced from the Worldwide Governance Indicators (WGI) from the World Bank/Brookings Institution, http://info.worldbank.org/governance/wgi.
MCC Methodology
MCC Normalized Score = WGI Score - median score
For ease of interpretation, MCC has adjusted the median for each of the scorecard income pools to zero for most of the Worldwide Governance Indicators. Country scores are calculated by taking the difference between actual scores and the median. For example, in FY25 the unadjusted median for the scorecard category of countries with a Gross National Income (GNI) per capita between $2,166 and $4,515 on Control of Corruption was -0.40 (note, in FY26, the GNI per capita range for this scorecard category is $2,156 to $4,495). In order to set the median at zero, MCC simply adds 0.40 to each country’s score (the same thing as subtracting a negative 0.54). Therefore, as an example, Bhutan’s FY25 Control of Corruption score, which was originally 1.53, was adjusted to 1.93.
The FY26 scores come from the 2024 update of the Worldwide Governance Indicators dataset and largely reflect performance in calendar year 2023. Since the release of the 2006 update of the Worldwide Governance Indicators, the indicators are updated annually. Each year, the World Bank and Brookings Institution also make minor backward revisions to the historical data. Prior to 2006, the World Bank released data every two years (1996, 1998, 2000, 2002 and 2004). With the 2006 release, the World Bank moved to an annual reporting cycle and provided additional historical data for 2003 and 2005.
Freedom of Information Indicator
This indicator measures a government’s commitment to enable or allow information to move freely in society. It is a composite index that includes a measure of press freedom; the status of national freedom of information laws; and freedom of speech, as measured through the degree of internet filtering.
Relationship to Economic Growth
Governments play a role in information flows; they can restrict or facilitate information flows within countries or across borders. Many of the institutions (laws, regulations, codes of conduct) that governments design are created to manage the flow of information in an economy.23 Countries with better information flows often have better quality governance and less corruption.24 Higher transparency and access to information have been shown to increase investment inflows because they enhance an investor’s knowledge of the behaviors and operations of institutions in a target economy; help reduce uncertainty about future changes in policies and administrative practices; contribute data and perspectives on how best an investment project can be initiated and managed; and allow for the increased coordination between social and political actors that typifies successful economic development.25 The right of access to information within government institutions also strengthens accountability, promotes political participation of all, reduces governmental abuses, and leads to more effective allocation of natural resources.26 Access to information also empowers those living in poverty by giving them the ability to more fully participate in society and providing them with knowledge that can be used for economic gain.27 Internet shutdowns are harmful as they not only restrict the ability of citizens to exercise their freedom of speech and politically or civically engage in society, but also restrict market access and cost economies billions of dollars each year.28
Indicator Institution Methodology
This indicator is sourced from three places. The first is Reporters without Borders’ (RSF) World Press Freedom Index, https://rsf.org/en/ranking/2020. RSF compiles its data by pooling experts’ responses to 117 questions related to the political context, legal framework, economic situation, sociocultural context, and safety environment that face journalists in a country. This qualitative analysis is combined with quantitative data on abuses and acts of violence against journalists during the period evaluated.
The second source for this indicator is the Centre for Law and Democracy and Access Info’s Right to Information Index, http://www.rti-rating.org/. In this dataset, a freedom of information law is rated based on 61 indicators. RTI includes any country with a freedom of information law on the books.
The third source for this indicator is Access Now’s #KeepItOn Shutdown Tracker Optimization Project, https://www.accessnow.org/keepiton/. Countries are assigned one point for every day of internet or social media shutdown/throttling up to 9 days. Shutdowns listed as ongoing are assumed to last until the end of the year. Shutdowns that last less than one day are counted as one day. Shutdowns with no end date are assumed to only last one day. If no duration is listed, but a start and end date are listed, a duration is calculated. Non-government shutdowns and non-government throttlings are excluded.
MCC Methodology
MCC FOI Score = (Press) + (FOIA in place) - (Access Now)
This indicator uses a country’s score on RSF’s World Press Freedom Index (Press) as the base. In FY26, MCC uses RSF’s 2025 World Press Freedom Index, which covers events in 2024. A country’s base score may improve based on data from the Global Right to Information Rating. In FY26, MCC uses Centre for Law and Democracy / Access Info Europe’s Global Right to Information Rating (RTI) from 2025. A country’s score is improved by 4 points if they have a Freedom of Information law enacted. Data from Access Now is used to penalize some countries’ base scores. A country’s score is penalized 1 point for each day in the last calendar year (2024) of internet or social media shutdown/throttling, for a total penalty of up to 9 points. For FY26, MCC uses Access Now data from the 2024 #KeepItOn Shutdown Tracker Optimization Project report.
Investing in People Category
The indicators in this category measure investments in people by assessing the extent to which governments are promoting broad-based primary education, strengthening capacity to provide quality public health, increasing child health, and promoting the protection of biodiversity.
Health Expenditures Indicator
This indicator measures the government’s commitment to investing in the health and well-being of its people.
Relationship to Economic Growth
MCC generally strives to measure outcomes rather than inputs, but health outcomes can be very slow to adjust to policy changes. Therefore, the Health Expenditures indicator is used to gauge the extent to which governments are making investments in the health and well-being of their citizens.29 A large body of literature links improved health outcomes to economic growth and poverty reduction.30 While the link between expenditures and outcomes is never automatic in any country, it is generally positive when expenditures are managed and executed efficiently.31 Research suggests that increased spending on health, when coupled with good policies and good governance, can promote growth, reduce poverty, and trigger declines in infant, child, and maternal mortality.32
Indicator Institution Methodology
This indicator measures domestic general government health expenditure (GGHE-D) as a percentage of Gross Domestic Product (GDP). Domestic general government health expenditure includes outlays earmarked for health maintenance, restoration or enhancement of the health status of the population, paid for in cash or in kind by the following financing agents: central/federal, state/provincial/regional, and local/municipal authorities; extra-budgetary agencies, social security schemes; and parastatals. All are financed through domestic funds. GGHE-D includes only current expenditures made during the year (excluding investment expenditures such as capital transfers). The classification of the functions of government (COFOG) promoted by the United Nations, the International Monetary Fund (IMF), OECD and other institutions sets the boundaries for public outlays. Figures are originally estimated in million national currency units (million NCU) and in current prices. GDP data are primarily drawn from the United Nations National Accounts statistics. This indicator is sourced from the World Bank’s Databank: https://data.worldbank.org/indicator/SH.XPD.GHED.GD.ZS.
MCC Methodology
This indicator measures public expenditure on health as a percent of gross domestic product (GDP). MCC relies on the World Bank for data on public health expenditure. The indicator estimates domestic general government health expenditure (GGHE-D) — the sum of current outlays by government entities to purchase health care services and goods — in million national currency units (million NCU) and in current prices. GDP data are primarily drawn from the United Nations National Accounts statistics.
The FY26 scores come from the 2025 update of the database and largely reflect performance in calendar year 2022.33 If countries have data from 2023, the more recent data is used. If countries do not have data from either 2022 or 2023 the indicator is treated as missing to ensure comparability.
Child Health Indicator
This composite indicator measures a government’s commitment to child health as measured by child mortality, the sound management of water resources and water systems, and proper sewage disposal and sanitary control.
Relationship to Economic Growth
Improving child health leads to a more productive and healthier workforce both presently and in the future. Inadequate water and sanitation is the second leading cause of child mortality; it kills more young children than AIDS, malaria, and measles combined.34 Improved sanitation and increased access to water have numerous economic benefits, including productivity savings in the form of fewer missed days of work or school due to illness from unclean water; the economic contribution of the lives saved from diarrheal disease; decreasing treatment expenditures for diarrheal disease at both the individual and government levels and time savings related to searching for facilities and water collection that would increase time for income-earning work.35 Women, children, handicapped individuals and the very poor are particularly affected by inadequate sanitation and water quality, meaning that improvement in these areas would help these groups the most.36 In children in particular, improved sanitation and water quality have been found to improve learning outcomes due to alleviating the burden of illness and helminthes (parasites) on cognitive development.37
Indicator Institution Methodology38
This index is calculated as the average of three, equally weighted indicators:
- Access to Improved Sanitation: Published by the World Bank, this indicator measures the percentage of the population with access to facilities that hygienically separate human excreta from human, animal, and insect contact. Facilities such as sewers or septic tanks, pour-flush latrines and simple pit or ventilated improved pit latrines are assumed to be adequate, provided that they are not public and not shared with other households. https://data.worldbank.org/indicator/SH.STA.BASS.ZS
- Access to Improved Water: Published by the World Bank, this indicator measures the percentage of the population with access to at least 20 liters of water per person per day from an “improved” source (household connections, public standpipes, boreholes, protected dug wells, protected springs, and rainwater collection) within one kilometer of the user's dwelling and with collection times of no more than 30 minutes. https://data.worldbank.org/indicator/SH.H2O.BASW.ZS
- Child Mortality (Ages 1-4): Produced by the Inter-agency Group for Child Mortality Estimation (IGME), this indicator measures the probability of dying between ages 1 and 4. https://childmortality.org
MCC Methodology
Child Health Score = [(Normalized Child Mortality) ÷ 3 ] + [(Normalized Access to Water ÷ 3 ] + [ (Normalized Access to Sanitation) ÷ 3 ]
This index draws on the 2025 Water and Sanitation data representing calendar year 2024 and the 2024 Child Mortality data representing calendar year 2023.39 Country scores are reported on the Scorecards as 2024 data. When some indicators are missing data, the others are used. Since the two sources of this index have different scales, MCC created a common scale for each of the indicators by normalizing them. Please see the equations below.
MCC Methodology to Normalize Water, Sanitation, and Child Mortality Data:
- Normalized Child Mortality = (Number of countries scoring below Country X on Child Mortality raw data in the income group) ÷ (Number of Countries scoring equal to or greater than Country X on Child Mortality raw data in the income group + Number of countries scoring below Country X on Child Mortality raw data in the income group)
- Normalized Access to Water = (Number of countries scoring below Country X on At Least Basic Water raw data in the income group) ÷ (Number of Countries scoring equal to or greater than Country X on At Least Basic Water raw data in the income group + Number of countries scoring below Country X on At Least Basic Water raw data in the income group)
- Normalized Access to Sanitation = (Number of countries scoring below Country X on At Least Basic Sanitation raw data in the income group) ÷ (Number of Countries scoring equal to or greater than Country X on At Least Basic Sanitation raw data in the income group + Number of countries scoring below Country X on At Least Basic Sanitation raw data in the income group)
For example, to calculate a given country X’s score, MCC first finds the number of countries that score worse than that country in the income pool, and the number of countries that have the same or better score than country X on the sub-source. MCC then divides the number of countries below by the sum of the number of countries below and the number of countries equal or above. Missing values are not included in these calculations. Finally, MCC averages the normalized values for each source together. If one source is missing, the average of the normalized scores for the other two is used. If two sources are missing, the normalized score for the other is used. If all three are missing, the indicator is considered missing and assigned an “N/A”.
Chronic Disease Indicator
This indicator measures a government’s commitment to providing essential public health services and reducing death from chronic diseases.
Relationship to Economic Growth
Chronic diseases have begun to overtake infectious diseases as the primary source of the disease burden and a leading cause of death in developing countries.40 Prevalence of chronic diseases such as cardiovascular disease can lower economic growth by lowering labor market participation and decreasing earnings, and there is strong evidence to demonstrate the individual and household level impact of these diseases on investment, productivity, and earnings.41 Chronic diseases both increase the likelihood of individuals falling into poverty by limiting labor productivity and increasing household costs but are also most harmful to those already in poverty who are less likely to be able to receive treatment or make lifestyle changes that would improve health.42
Indicator Institution Methodology
MCC uses the most recent data on the probability of dying between the exact ages 30 and 70 from cardiovascular disease, cancer, diabetes, or chronic respiratory disease. This is estimated by using cause-specific mortality rates in each 5-year age group and the standard life table methods. They are based on household surveys and administration data on the cause of death. The data are created using methods that ensure cross country compatibility and so may not be comparable with official national estimates. This indicator is sourced from the World Bank’s Databank: https://data.worldbank.org/indicator/SH.DYN.NCOM.ZS.
MCC Methodology
MCC uses the most recent data available on this indicator across countries. For the FY26 scorecards this is data from 2021.43 Note that given the nature of the indicator, lower scores are better, so countries must score below the median in order to pass the indicator.
Workforce Development Indicator
This indicator measures the government’s commitment to supporting continuing training and education for students and workers.
Relationship to Economic Growth
Continuing vocation education, workforce training, informal training and tertiary education are crucial for increasing workforce productivity and ensuring that the skills of a workforce are well matched with the needs of the market.44 There is a clear connection between vocational education and training and economic growth in a country as additional training leads to increases in firm productivity and household income.45 Additionally, continuing education can lead to reductions in poverty by allowing lower skilled workers to access higher skilled, more productive jobs that provide greater returns.46
Indicator Institution Methodology
These data measure specifically the percentage of youth and adults from 15-64 years old participating in training, non-formal education, or formal education in the last 12 months. Non-formal education and training activities are any sustained and organized learning activities that do not correspond to formal education, as defined below. These may take place both within and outside education institutions and cater to people of all ages, including work-skills, literacy, life skills, and more. Formal education is defined as education provided by any system of schools, colleges or universities, including joint programs that involve part-time employment and part-time participation in the education program. The data are gathered from both administrative sources and household surveys. This indicator is sourced from the World Bank’s Databank: https://databank.worldbank.org/id/50213e0c.
MCC Methodology
MCC uses the most recent data point in the past six years (since 2019)47
This indicator measures specifically “Participation rate of youth and adults in formal and non-formal education and training in the previous 12 months, both sexes (%)” which corresponds to SDG 4.3.1. For FY26, MCC first determines if a country has a value reported in 2019 or later.48 If so, the most recent data available within those years are used. If a country does not have data at any point since 2019, it does not receive an FY26 score. As better data become available, backward revisions to historical data are made.
Girls’ Primary Education Completion Rate Indicator
This indicator measures a government’s commitment to basic education for girls in terms of access, enrollment, and retention. MCC uses this indicator for countries with a GNI per capita below $2,155 only.
Relationship to Economic Growth
Universal basic education is an important determinant of economic growth and poverty reduction. Empirical research consistently shows a strong positive correlation between girls’ primary education and accelerated economic growth, higher wages, increased agricultural yields and labor productivity.49 A large body of literature also shows that increasing a mother’s schooling has a large effect on her child’s health, schooling, and adult productivity, an effect that is more pronounced in poor households.50 By one estimate, providing girls one extra year of education beyond the average can boost eventual wages by 10-20 percent.51 The social benefits of female education are also demonstrated through higher immunization rates, decreased child and maternal mortality, reduced transmission of HIV, fewer cases of domestic violence, greater educational achievement by children, and increased female participation in government.52
Indicator Institution Methodology
The Girls’ Primary Education Completion Rate indicator is measured as the gross intake ratio into the last grade of primary, a proxy for primary completion. This is measured as the total number of female students enrolled in the last grade of primary (regardless of age), minus the number of female students repeating the last grade of primary, divided by the total female population of the standard entrance age of the last grade of primary. The primary completion rate reflects the primary cycle as defined by the International Standard Classification of Education (ISCED), ranging from three or four years of primary education (in a very small number of countries) to five or six years (in most countries), to seven years (in a small number of countries). For the countries that changed their primary cycle, the most recent ISCED primary cycle is applied consistently to the whole series. For FY26, MCC will use the most recent data since 2019. This indicator is sourced from the World Bank’s Databank: https://data.worldbank.org/indicator/SE.PRM.CMPT.FE.ZS.
This indicator was selected since data limitations preclude adjusting the girls’ primary education completion rate for students who drop out during the final year of primary school. Therefore, the estimates should be taken as an upper-bound estimate of the actual female primary completion rate. Because the numerator may include late entrants and over-age children who have repeated one or more grades of primary school but are now graduating, as well as children who entered school early, it is possible for the primary completion rate to exceed 100 percent.
MCC Methodology
MCC uses the most recent data point in the past six years (since 2019)53
MCC uses the indicator named “Gross intake ratio to the last grade of primary education, female (%)” from the World Bank’s databank, as noted above.54 To receive an FY26 score, countries must have a value in 2019 or later.55 MCC uses the most recent year available; that is, MCC uses the most recent data from the past six years. If a country does not have data at any point from 2019 or later, it does not receive an FY26 score. As better data become available, backward revisions are made to historical data.
Girls’ Lower Secondary Education Completion Rate Indicator
This indicator measures a government’s commitment to secondary education for girls in terms of access, enrollment, and completion. MCC uses this indicator for countries with a GNI per capita between $2,156 and $4,495 only.
Relationship to Economic Growth
Access to continued education beyond the primary level solidifies the benefits associated with girls’ primary education. Secondary education for girls ensures they receive both the benefits of primary education and the additional benefits linked to further education. Empirical research consistently shows a strong positive correlation between girls’ secondary education and faster economic growth, higher wages, and increased labor productivity.56 According to one estimate, a 1 percent increase in proportion of women enrolled in secondary school will generate a 0.3 percent growth in annual per-capita income.57 A large body of literature also shows that increasing a mother’s schooling has large effect on her children’s health, schooling, and adult productivity.58 The social benefits of female education are also demonstrated through, decreased child and maternal mortality, reduced transmission of HIV, and greater educational achievement by children.59 Overall, studies show that increased schooling for women and girls leads to poverty reduction and economic growth.60
Indicator Institution Methodology
The Girls’ Lower Secondary Education Completion Rate indicator measures the percentage of girls in a particular age cohort that have completed lower secondary school within a few years of their expected graduate date. Lower secondary school is defined as a program typically designed to complete the development of basic skills and knowledge which began at the primary level. In many countries, the educational aim is to lay the foundation for lifelong learning and individual development. The programs at this level are usually on a subject-oriented pattern, requiring specialized teachers for each subject area. The end of this level often coincides with the end of compulsory education. For FY26, MCC will use the most recent data from 2019 or later. This indicator is sourced from the World Bank’s Databank: https://databank.worldbank.org/id/50213e0c.
MCC Methodology
MCC uses the most recent data point in the past six years
MCC uses the indicator named “Completion rate, lower secondary education, female (%)” from the World Bank’s databank, as noted above.61 MCC uses the observed data instead of the modelled data. To receive an FY26 score, countries must have a value on “Completion rate, lower secondary education, female (%)” from 2019 or later.62 MCC uses the most recent year available; that is, MCC uses the most recent data from the past six years. If a country does not have data at any point from 2019 or later, it does not receive an FY26 score. As better data become available, backward revisions to historical data are made by the indicator institution. MCC uses the observed data not the modelled data.
The Girls’ Lower Secondary Education Completion Rate indicator measures the percentage of a cohort of children or young people aged 3-5 years above the intended age for the last grade of each level of education who have completed that grade. The intended age for the last grade of each level of education is the age at which pupils would enter the grade if they had started school at the official primary entrance age, had studied full-time and had progressed without repeating or skipping a grade. This data is gathered from population censuses and household surveys that collect data on the highest level of education or grade completed by children and young people in a household.
Girls’ Upper Secondary Education Completion Rate Indicator
This indicator measures a government’s commitment to secondary education for girls in terms of access, enrollment, and completion. MCC uses this indicator for countries with a GNI per capita between $4,496 and $7,855 only.
Relationship to Economic Growth
Access to continued education beyond the primary level solidifies the benefits associated with girls’ primary education. Secondary education for girls ensures they receive both the benefits of primary education and the additional benefits linked to further education. Empirical research consistently shows a strong positive correlation between girls’ secondary education and faster economic growth, higher wages, and increased labor productivity.63 According to one estimate, a 1 percent increase in proportion of women enrolled in secondary school will generate a 0.3 percent growth in annual per-capita income.64 A large body of literature also shows that increasing a mother’s schooling has large effect on her children’s health, schooling, and adult productivity.65 The social benefits of female education are also demonstrated through decreased child and maternal mortality, reduced transmission of HIV, and greater educational achievement by children.66 Overall, studies show that increased schooling for women and girls leads to poverty reduction and economic growth.67
Indicator Institution Methodology68
The Girls’ Upper Secondary Education Completion Rate indicator measures the percentage of girls in a particular age cohort that have completed upper secondary school within a few years of their expected graduate date. Upper secondary school is defined as a program typically designed to complete secondary education in preparation for tertiary education or provide skills relevant to employment, or both. Programs at this level offer students more varied, specialized and in-depth instruction than programs at the Lower Secondary level. They are more differentiated, with an increased range of options and streams available. Teachers are often highly qualified in the subjects or fields of specialization they teach, particularly in the higher grades. For FY26, MCC will use the most recent data from 2019 or later. This indicator is sourced from the World Bank’s Databank: https://databank.worldbank.org/id/50213e0c.
MCC Methodology
MCC uses the most recent data point in the past six years
MCC uses the indicator named “Completion rate, upper secondary education, female (%)” from the World Bank’s databank, as noted above.69 MCC uses the observed data instead of the modelled data. To receive an FY26 score, countries must have a value on “Completion rate, upper secondary education, female (%)” from 2019 or later.70 MCC uses the most recent year available; that is, MCC uses the most recent data from the past six years. If a country does not have data at any point from 2019 or later, it does not receive an FY26 score. As better data become available, backward revisions are made to the historical data. MCC uses the observed data not the modelled data.
The Girls’ Upper Secondary Education Completion Rate indicator measures the percentage of a cohort of children or young people aged 3-5 years above the intended age for the last grade of each level of education who have completed that grade. The intended age for the last grade of each level of education is the age at which pupils would enter the grade if they had started school at the official primary entrance age, had studied full-time and had progressed without repeating or skipping a grade. This data is gathered from population censuses and household surveys that collect data on the highest level of education or grade completed by children and young people in a household.
Natural Resource Protection Indicator
This indicator assesses a country government’s commitment to preserving biodiversity and natural habitats, responsibly managing ecosystems and fisheries, and engaging in sustainable agriculture.
Relationship to Economic Growth
Environmental protection of biomes and the biodiversity and ecosystems within those biomes supports long-term economic growth by providing essential ecosystem goods and services such as natural capital, fertile soil, climate regulation, clean air and water, renewable energy, and genetic diversity.71 Additionally, appropriate management of non-protected ecosystems and the natural resources within those ecosystems promotes agricultural and non-agricultural productivity.72 Those in poverty, particularly subsistence farmers and those in rural areas, are most likely to be exposed to and affected by environmental degradation and biodiversity loss because they rely so directly on ecosystem services for their food security and livelihood.73
Indicator Institution Methodology
MCC uses four components of this indicator, which are focused on Biodiversity and Habitat, Forests (Ecosystem Services in FY24 and earlier), Fisheries, and Agriculture. The Biodiversity and Habitat component measures the share of terrestrial and marine areas that are protected, as well as the protection of rare species and their habitats. The Forests component measures forest and forest landscape loss, tree cover loss and change in tree cover, and forest landscape integrity. The Agriculture component measures the sustainable use of nitrogen, phosphorus, and pesticides in farming. The Fisheries component measures the sustainability of fishing practices, including the share of fish caught from overfished populations, and the use of harmful fishing practices such as trawling. This indicator is sourced from the Environmental Performance Index (EPI) from the Yale Center for Environmental Law and Policy (YCELP) and Columbia University’s Center for International Earth Science Information Network (CIESIN): https://epi.yale.edu/.
MCC Methodology
MCC combines these four components using EPI’s weighting methodology. EPI assigns each component a specific weight. To compute the overall score, MCC multiplies the score for each component by the weight for that component, adds them together, and divides by the total weight. If a country is missing data for a particular indicator, the weight for that indicator is included in neither the numerator nor the denominator of the fraction. This is most common in landlocked countries that have no fisheries scores.
MCC’s Natural Resource Protection Indicator = [(Agriculture Score x Agriculture Weight) + (Fisheries Score x Fisheries Weight) + (Biodiversity and Habitat Score x Biodiversity and Habitat Weight) + (Forests Score x Forests Weight)] ÷ [Agriculture Weight + Fisheries Weight + Biodiversity and Habitat Weight + Forests Weight]
For example, using the old data from the 2020 EPI, the weights for these components would be as follows: Agriculture: 0.05, Fisheries: 0.1, Ecosystem Services (currently called Forests): 0.1, and Biodiversity and Habitat: 0.25. This means that a country with all four areas measured, such as Cameroon, would have their score calculated as follows. Cameroon had the following component scores: Agriculture: 40.4, Fisheries: 10.5, Ecosystem Services: 31.5, and Biodiversity and Habitat: 48.6. The numerator for this calculation is the weighted sum of the four scores i.e. (40.4 x 0.05) + (10.5 x 0.1) + (31.5 x 0.1) + (48.6 x 0.25) = 18.37. The denominator is just the sum of the weights (0.05 + 0.1 + 0.1 + 0.25) = 0.5. This means Cameroon would have scored 36.74 (18.37 ÷ 0.5). On the other hand, if Cameroon did not have fishing data for that year, fishing would not be included either in the numerator or the denominator making the score without fisheries data 43.3 (17.32 ÷ 0.4). In cases where EPI reports data at the lower indicator level, but not the issue category level, MCC uses EPI's methodology to first calculate the issue category.
Encouraging Economic Freedom Category
The eight indicators in this category measure the extent to which a government encourages economic freedom by assessing, among other things, a country’s demonstrated commitment to economic policies that: encourage individuals and firms to participate in global trade and international capital markets, promote private sector growth, protect private property rights, and strengthen market forces in the economy.
Regulatory Quality Indicator
This indicator measures the ability of the government to formulate and implement sound policies and regulations that permit and promote private sector development.
Countries are evaluated on the following factors:
- prevalence of regulations and administrative requirements that impose a burden on business; ease of starting and closing a new business; ease of registering property;
- government intervention in the economy; the extent to which government subsidies keep uncompetitive industries alive;
- labor market policies; employment law provides for flexibility in hiring and firing; wage and price controls;
- the complexity and efficiency of the tax system; pro-investment tax policies;
- trade policy; the height of tariffs barriers; the number of tariff bands; the stability of tariff rates; the extent to which non-tariff barriers are used; the transparency and predictability of the trade regime;
- investment attractiveness; prevalence of bans or investment licensing requirements; financial regulations on foreign investment and capital; legal restrictions on ownership of business and equity by non-residents; foreign currency regulations; general uncertainty about regulation costs; legal regulation of financial institutions; the extent to which exchange rate policy hinders firm competitiveness;
- extensiveness of legal rules and effectiveness of legal regulations in the banking and securities sectors; costs of uncertain rules, laws, or government policies;
- the strength of the banking system; existence of barriers to entry in the banking sector; ease of access to capital markets; protection of domestic banks from foreign competition; whether interest rates are heavily-regulated; transfer costs associated with exporting capital;
- participation of the private sector in infrastructure projects; dominance of state-owned enterprises; openness of public sector contracts to foreign investors; the extent of market competition; effectiveness of competition and anti-trust policies and legislation;
- the existence of a policy, legal, and institutional framework that supports the development of a commercially-based, market-driven rural finance sector that is efficient, equitable, and accessible to low-income populations in rural areas;
- the adoption of an appropriate policy, legal, and regulatory framework to support the emergence and development of an efficient private rural business sector; the establishment of simple, fast and transparent procedures for establishing private agri-businesses;
- the existence of a policy, legal, and institutional framework that supports the development and liberalization of commercially-based agricultural markets (for inputs and produce) that operate in a liberalized and private sector-led, functionally efficient and equitable manner, and that are accessible to small farmers; and
- the extent to which:
- corporate governance laws encourage ownership and financial disclosure and protect shareholder rights, and are generally enforced;
- state intervention in the goods and land market is generally limited to regulation and/or legislation to smooth out market imperfections;
- the customs service is free of corruption, operates transparently, relies on risk management, processes duty collections, and refunds promptly; and
- trade laws, regulations, and guidelines are published, simplified, and rationalized.
Relationship to Economic Growth
Improved regulatory quality can promote economic growth by creating effective and efficient incentives for the private sector. Conversely, burdensome regulations have a negative impact on economic performance through economic waste and decreased productivity74 Researchers at the International Finance Corporation argue that “improving from the worst … to the best … quartile of business regulations implies a 2.3 percentage point increase in average annual growth.”75 Good regulatory policies help the poor by creating opportunities for entrepreneurship, reducing opportunities for corruption, increasing the quality of public services, and improving the functioning of the housing, service, and labor markets on which they rely.76
Indicator Institution Methodology
This indicator is an index combining a subset of 16 different assessments and surveys, depending on availability, each of which receives a different weight, depending on its estimated precision and country coverage. The Regulatory Quality indicator draws on data, as applicable, from the Country Policy and Institutional Assessments of the World Bank, the African Development Bank, the Asian Development Bank, the World Bank’s Business Environment and Enterprise Performance Survey, Bertelsmann Foundation’s Bertelsmann Transformation Index, the Economist Intelligence Unit’s Country Risk Service, the World Economic Forum’s Global Competitiveness Report, the Heritage Foundation’s Index of Economic Freedom, the International Fund for Agricultural Development’s Rural Sector Performance Assessments, Political Risk Service’s International Country Risk Guide, the Institute for Management and Development’s World Competitiveness Yearbook, The French Government’s Institutional Profiles Database, The European Bank for Reconstruction and Development Transition Report, the World Bank's Enterprise Surveys, IHS Markit’s World Economic Service, and the World Justice Project’s Rule of Law Index. This indicator is sourced from the Worldwide Governance Indicators (WGI) from the World Bank/Brookings Institution, http://info.worldbank.org/governance/wgi/.
MCC Methodology
MCC Normalized Score = WGI Score - median score
For ease of interpretation, MCC has adjusted the median for each of the scorecard income pools to zero for most of the Worldwide Governance Indicators. Country scores are calculated by taking the difference between actual scores and the median. For example, in FY25 the unadjusted median for the scorecard category of countries with a Gross National Income (GNI) per capita between $2,166 and $4,515 on Control of Corruption was -0.40 (note, in FY26, the GNI per capita range for this scorecard category is $2,156 to $4,495). In order to set the median at zero, MCC simply adds 0.40 to each country’s score (the same thing as subtracting a negative 0.54). Therefore, as an example, Bhutan’s FY25 Control of Corruption score, which was originally 1.53, was adjusted to 1.93.
The FY26 scores come from the 2024 update of the Worldwide Governance Indicators dataset and largely reflect performance in calendar year 2023. Since the release of the 2006 update of the Worldwide Governance Indicators, the indicators are updated annually. Each year, the World Bank and Brookings Institution also make minor backward revisions to the historical data. Prior to 2006, the World Bank released data every two years (1996, 1998, 2000, 2002 and 2004). With the 2006 release, the World Bank moved to an annual reporting cycle and provided additional historical data for 2003 and 2005.
Property and Land Rights Indicator
This indicator evaluates whether and to what extent governments are investing in secure land tenure, respect for intellectual property, and ease of land titling and transfer.
Relationship to Economic Growth
Secure land tenure plays a central role in the economic growth process by giving people long-term incentives to invest and save their income, enhancing access to essential public services, allowing for more productive use of time and money than protecting land rights, facilitating use of land as collateral for loans, and contributing to social stability and local governance.77 Improvements in tenure security also favor growth that is “pro-poor” because the benefits generally accrue to those who have not possessed such rights in the past and those who are affected most by high property registration costs.78 Land policy reform can be particularly meaningful for women: research shows that when women have secure access to land and are able to exercise control over land assets, their ability to earn income is enhanced, household spending on healthcare, nutritious foods, and children’s education increases, and human capital accumulation occurs at a faster rate. Women’s ability to inherit and possess control rights to land also serves as a crucial social safety net.79 Beyond land, property rights generally contribute to economic growth and poverty reduction.80
Indicator Institution Methodology
This composite indicator is calculated as the weighted average of three indicators, each weighted equally. Note that countries with a GNI per capita above $4,496 are not ranked on the IFAD indicator due to lack of data.The sources for this indicator are the International Fund for Agricultural Development (IFAD), http://www.ifad.org, the World Bank’s Business Ready (B-Ready), https://www.worldbank.org/en/businessready, and the Heritage Foundation https://www.heritage.org/index/.
- Access to Land (IFAD): Produced by IFAD, this indicator assesses the extent to which the institutional, legal, and market framework provides secure land tenure and equitable access to land in rural areas. The sub-components can be found at https://webapps.ifad.org/members/eb/121/docs/EB-2017-121-R-3.pdf. IFAD’s operational staff base their assessments on a questionnaire and guideposts identifying the basis of each scoring level, available at https://webapps.ifad.org/members/eb/143/docs/EB-2024-143-R-17-Add-1.pdf, https://webapps.ifad.org/members/gc/45/docs/GC-45-L-4-Add-1.pdf, https://webapps.ifad.org/members/eb/125/docs/EB-2018-125-R-4-Add-1.pdf or https://webapps.ifad.org/members/gc/39/docs/GC-39-L-4.pdf. Past datasets can be found in the documents of IFAD’s governing council https://webapps.ifad.org/members/gc.
- Property Transfer and Land Administration (B-Ready): Produced by the World Bank’s B-Ready report, the Property Transfer and Land Administration (3.1 of the Business Location topic) component of this indicator measures whether firms view access to land as a major constraint, as well as the time and cost to transfer a property. B-Ready uses firm surveys to capture the de facto time and cost to register land. For more information on B-Ready’s methodology visit: https://www.worldbank.org/en/businessready/methodology.
- Property Rights (Heritage Foundation): This component is drawn from the Heritage Foundation’s Index of Economic Freedom. It includes three equally weighted sub-components: Risk of expropriation, respect for intellectual property rights, and the quality of contract enforcement, property rights, and law enforcement. More information on Heritage’s methodology can be found here: https://www.heritage.org/index/pages/about.
MCC Aggregation Methodology
MCC’s Property and Land Rights Score = [ (Normalized IFAD) ÷ 3] + [ (Normalized B-Ready) ÷ 3] + [ (Normalized Heritage) ÷ 3]
This index draws on 2024 “Access to Land” data from the International Fund for Agricultural Development (IFAD), 2024 data from B-Ready on Property transfer, and 2025 data from Heritage. Country scores are reported on the Scorecards as 2024 data. When any sub-source is missing, the normalized score for the others are used. When all are missing the indicator is missing.
Since each of the three sub-components of this index have different scales, MCC created a common scale for each of the indicators by normalizing them. Please see equations below. Each country is given a percentile rank between 0 and 1 for its income pool for each sub-source, excluding missing values. Then those sub-source percentile ranks are averaged together.
MCC Methodology to Normalize IFAD, B-Ready, and Heritage Data:
- Normalized IFAD = (Number of countries scoring below Country X on IFAD’s raw data in the income group) ÷ (Number of Countries scoring equal to or greater than Country X on IFAD’s raw data in the income group + Number of countries scoring below Country X on IFAD’s raw data in the income group)
- Normalized B-Ready = (Number of countries scoring below Country X on B-Ready’s raw data in the income group) ÷ (Number of Countries scoring equal to or greater than Country X on B-Ready’s raw data in the income group + Number of countries scoring below Country X on B-Ready’s raw data in the income group)
- Normalized Heritage = (Number of countries scoring below Country X on Heritage’s raw data in the income group) ÷ (Number of Countries scoring equal to or greater than Country X on Heritage’s raw data in the income group + Number of countries scoring below Country X on Heritage’s raw data in the income group)
For example, to calculate a given country X’s score, MCC first finds the number of countries that score worse than that country in the income pool, and the number of countries that have the same or better score than country X on the sub-source. MCC then divides the number of countries below by the sum of the number of countries below and the number of countries equal or above. Missing values are not included in these calculations. If one source is missing, the average of the normalized scores for the other two is used. If two sources are missing, the normalized score for the other is used. If all three are missing, the indicator is considered missing and assigned an “N/A”.
Access to Credit Indicator
This indicator measures the level of financial access in a country as measured by the number of bank branches and ATMs per 100,000 adults and the share of adults that have a financial or mobile money account.
Relationship to Economic Growth
The ability to access affordable credit is a critical element of private sector led growth, particularly for small businesses that often lack the initial capital needed to grow and expand and also for agricultural households, where expenditures on inputs precede the returns from harvest; it also increases a business or household’s ability to bear and cope with risk.81 Access to both formal and informal financial instruments are crucial for rural and poor populations to be able to manage uncertain and uneven incomes and alleviate the costs of poverty while promoting inclusive growth.82 Improving credit access for small business and poor populations can have a substantial impact on agricultural development, poverty reduction, and broad-based economic growth.83
Indicator Institution Methodology
The Access to Credit composite indicator is calculated by taking the weighted average of three indicators, two from the International Monetary Fund and one from Findex, which have been normalized and ranked on equivalent scales:
- Financial Access Surveys (IMF): MCC uses two indicators from this dataset: the number of bank branches per 100,000 adults and the number of ATMs per 100,000 adults from the IMF’s Financial Access Surveys. https://data.imf.org/en/datasets/IMF.STA:FAS
- Share of adults with an account (Findex): From the World Bank’s Findex Database, MCC uses the share of the population (adults 15+) with an account. This survey counts both accounts with traditional financial institutions and mobile money. https://globalfindex.worldbank.org/
MCC Methodology
MCC’s Access to Credit Score = [ 0.25 x Normalized ATMs] + [ 0.25 x Normalized Bank Branches] + [ 0.5 x (Normalized Findex)]
This index draws on 2024 data from the Findex database. For the two IMF indicators, the most recent data since 2022 is used. Country scores are reported on the Scorecards as 2024 data. Since each of the sub-components of this index have different scales, MCC created a common scale for each of the indicators by normalizing them. Please see the equations below.
MCC Methodology to Normalize IMF and Findex Data:
- Normalized ATMs = (Number of countries scoring below Country X on IMF’s ATM raw data in the income group) ÷ (Number of Countries scoring equal to or greater than Country X on IMF’s ATM raw data in the income group + Number of countries scoring below Country X on IMF’s ATM raw data in the income group)
- Normalized Bank Branches = (Number of countries scoring below Country X on IMF’s Bank Branch raw data in the income group) ÷ (Number of Countries scoring equal to or greater than Country X on IMF’s Bank Branch raw data in the income group + Number of countries scoring below Country X on IMF’s Bank Branch raw data in the income group)
- Normalized Findex = (Number of countries scoring below Country X on Findex raw data in the income group) ÷ (Number of Countries scoring equal to or greater than Country X on Findex’s raw data in the income group + Number of countries scoring below Country X on Findex’s raw data in the income group)
For example, to calculate a given country X’s score, MCC first finds the number of countries that score worse than that country in the income pool, and the number of countries that have the same or better score than country X on the sub-source. MCC then divides the number of countries below by the sum of the number of countries below and the number of countries equal or above. Missing values are not included in these calculations. Finally, MCC averages the normalized values for each source together (weighting the two IMF scores at 0.25 each and the Findex score at 0.5). If one source is missing, the average of the normalized scores for the other two is used. If two sources are missing, the normalized score for the other is used. If all three are missing, the indicator is considered missing and assigned an “N/A”.
Employment Opportunity Indicator
This indicator measures a country government’s commitment to ending child labor, preventing employment discrimination, and protecting the rights of workers and people with disabilities.
Relationship to Economic Growth
This indicator measures governments policies that drive economic growth and poverty reduction by supporting policies in four areas that ensure everyone has an opportunity to earn a living: disability rights, forced labor, employment discrimination, and the prevention of child labor.84 Broadly, failing to give individuals the opportunity to work increases poverty through denied employment and exclusion, while ensuring employment opportunities can drive economic growth.85 Ensuring that people with disabilities have employment opportunities and the ability to contribute to the economy supports economic growth.86 This is particularly critical in developing countries, as people with disabilities make up a disproportionate share of the global poor and supporting the rights of these groups is a crucial component of poverty reduction.87 Forced labor impedes the ability of individuals to earn a fair wage and exacerbates poverty such as by keeping individuals in debt bondage, preventing them from being able to earn anything or ever become free.88 Child labor is associated with lower productivity due to lower human capital accumulation, higher poverty and a larger informal sector (which is linked to lower economic growth).89
Indicator Institution Methodology
This indicator is sourced from three places: the World Bank’s Business Ready (B-Ready) data on Labor, the World Bank’s databank Child Labor, and the World Bank’s Women Business and the Law (WBL) data on disabilities rights, particularly women with disabilities. The B-Ready data on Labor conducts a combination of legal reviews and expert surveys to construct this indicator. Specifically, MCC uses indicator 1.1.1 in the Labor topic. This includes 12 sub-components measuring issues of prohibition of forced labor, prohibitions on child labor, protections against workplace discrimination, workplace safety and more. For the Child Labor portion, the data are measured using household surveys. Specifically, they assess whether children are engaged in child labor above age specific hourly thresholds in the last week. For children ages 5-11, this is one hour or more engaged in economic activities or unpaid household services for 21 hours or more. For children ages 12-14, this means working 14 or more hours on economic activities or doing unpaid household services for 21 hours or more. For children ages 15-17, this means working for 43 hours or more in economic activities in a week. MCC uses the most recent datapoint from the last 6 years (since 2019).90 Economic activities include all types of businesses engaged in the production or distribution of goods or services. Household chores refer to services provided to household members without pay. For the Disability Rights data, the institution conducted a review of the laws and constitutions of countries to determine whether certain rights are protected. This dataset focuses on the rights of people with disabilities, with a specific focus on women with disabilities. The dataset looks at 11 questions on these rights. Responses of “Yes” are given 1 point, and responses of “No” or “N/A” are given zero points as WBL does with its main index. These 11 scores are then averaged together to form the Disability Rights portion of this indicator.
MCC Methodology
MCC’s Employment Opportunity Score = [ (1/3) x (Normalized Disability Rights) ] + [ (1/3) x (Normalized B-Ready) ] + [ (1/3) x (Normalized Child Labor) ]
The Employment Opportunity indicator is calculated as an average of three sub-indicators: Disability Rights, B-Ready, and Child Labor. First, the different questions for Disability Rights are aggregated together as described above. Second, all four sub-sources are normalized using percentile rank for their income group to a scale between 0 and 1, then the four components are averaged together. If any components are missing for a particular country the score is the average of the components that are not missing. If all components are missing the indicator is considered missing and a country will receive an N/A on the indicator. Score years are labeled based on the year of the B-Ready data used. For FY26 the scores are labeled as 2024.
First, the disability rights sub-indicator is aggregated by averaging the scores on each of the questions (i.e. the percentage of questions where rights are guaranteed in the law). So, if a country has protections for 5 of the 11 listed under disability rights, they will receive a score of approximately 0.4545 on this component. (5 ÷ 11 ≈ 0.4545; 5 is 45.45% of 11).
- Average Disability Rights = (Number of questions where the answer is “yes”)/11
Then, all three components are normalized using percentile ranks as described by the equation below
- Normalized Sub-Component = (Number of countries scoring below Country X on Sub-Component data in the income group) ÷ (Number of Countries scoring equal to or greater than Country X on Sub-Component data in the income group + Number of countries scoring below Country X on Sub-Component data in the income group)
For example, to calculate a given country X’s score, MCC first finds the number of countries that score worse than that country in the income pool, and the number of countries that have the same or better score than country X on the sub-source. MCC then divides the number of countries below by the sum of the number of countries below and the number of countries equal or above. Missing values are not included in these calculations. Finally, MCC averages the normalized values for each source together. If any sub-component is missing, the average normalized score for the other is used, but if all are missing the indicator is considered missing and assigned an “N/A”.
Trade Policy Indicator
This indicator measures a country’s openness to international trade based on average tariff rates and non-tariff barriers to trade. Countries are rated on the following factors:
- Trade-weighted average tariff rate;
- Non-tariff barriers (NTBs) including, but not limited to: import licenses; trade quotas; production subsidies; anti-dumping, countervailing, and safeguard measures; government procurement procedures; local content requirements; excessive marking and labeling requirements; export assistance; export taxes and tax concessions; and corruption in the customs service.
Relationship to Economic Growth
Trade openness can help to accelerate long run economic growth by allowing for greater economic specialization, encouraging investment and increasing productivity.91 Greater international competition can also force domestic firms to be more efficient and reduce rent seeking and corrupt activities.92 One study estimates that “open” economies on average register 2.2% higher economic growth than “closed” economies.93 Although the relationship between trade openness and poverty reduction is complex, research suggests trade liberalization can improve the livelihoods and real incomes of the poor through the availability of lower-cost import items, increases in the relative wages of laborers, net increases in tariff revenues as a result of lower rates and higher volume, and insulation of the economy from negative exogenous shocks.94
Indicator Institution Methodology
This indicator is sourced from the Heritage Foundation’s Trade Freedom score which is a component of their annual Index of Economic Freedom https://www.heritage.org/index/trade-freedom. The indicator scale ranges from 0 to 100, where 0 represents the highest level of protectionism and 100 represents the lowest level of protectionism. The equation used to convert tariff rates and non-tariff barriers into this 0-100 percent scale is presented below:
Trade Policyi = (Tariffmax-Tariffi)/(Tariffmax-Tariffmin) - NTBi
Trade Policyi represents the trade freedom in country i, Tariffmax and Tariffmin represent the upper and lower bounds (50 and zero percent respectively), and Tariffi represents the weighted average tariff rate in country i. The result is multiplied by 100 to convert it to a percentage. If applicable to country i, an NTB penalty of 5, 10, 15, or 20 percentage points is then subtracted from the base score, depending on the pervasiveness of NTBs.
In general, the Heritage Foundation uses the most recent data from the World Trade Organization (WTO) on the Most Favored Nation (MFN) trade weighted average duty tariff (weighted by imports from the country’s trading partners) from 2020 or later as the tariff score.
Data on tariffs and NTBs are obtained from the following sources: the World Bank’s World Development Indicators and Data on Trade and Import Barriers: Trends in Average Tariff Rates for Developing and Industrial Countries; the World Trade Organization’s Trade Policy Reviews; the Office of the U.S. Trade Representative’s National Trade Estimate Report on Foreign Trade Barriers; the World Bank’s Doing Business report; the U.S. Department of Commerce’s Country Commercial Guide; the Economist Intelligence Unit’s Country Reports, Country Profiles, and Country Commerce data; and “official government publications of each country.”
Inflation Indicator
This indicator measures the government’s commitment to sound monetary policy.
Relationship to Economic Growth
Research shows that high levels of inflation are detrimental to long-run growth.95 High inflation creates an environment of risk and uncertainty, drives down the rate of investment, and is often associated with distorted relative prices and tax incentives.96 Inflation can also hinder financial market development and create incentives for corruption.97 In addition, inflation often has a direct negative impact on the poor. When inflation is associated with swings in relative prices, it usually erodes real wages and distorts consumption decisions.98
Indicator Institution Methodology
This indicator is sourced from the International Monetary Fund’s World Economic Outlook (WEO) database: http://www.imf.org/external/ns/cs.aspx?id=28. This indicator measures the most recent one-year change in consumer prices. The indicator reflects average annual percentage change for the year, not end-of-period data. Specifically, MCC uses “All items, consumer price index (CPI), period average, percent change.”
In keeping with economic research findings, MCC considers countries with inflation below 15% to be passing this indicator.
WEO inflation data reflect annual percentage change averages for the year, not end-of-period data. FY26 data refer to the 2024 inflation rate. As better data become available, the IMF makes backward revisions to its historical data.
Women in the Economy Indicator
This indicator measures the government’s commitment to providing women and men with the same legal ability to access legal and public institutions, own property, go to court, and get a job; and measures the extent to which the law provides girls and women legal protection from violence.
Relationship to Economic Growth
This indicator draws on all eight areas of the World Bank’s Women Business and the Law (WBL) report (http://wbl.worldbank.org/) including: Mobility, Workplace, Pay, Parenthood, Marriage, Entrepreneurship, Assets and Pensions. It also draws from WBL’s 2.0 dataset for information on safety and child marriage.
- Mobility (WBL): These questions explore women’s legal access to physical mobility within a country. Studies show that legally sanctioned discrimination against women has a significant negative impact on a country’s economic growth, because it prevents a large portion of the population from fully participating in the economy, thus lowering the average ability of the workforce.99
- Workplace (WBL): These questions explore specific barriers to women’s opportunities in the workplace. Sexual harassment and violence in the workplace can undermine women’s economic empowerment by preventing employment and blocking access to other financial resources.100 Research shows that when women have access to employment, investment in children’s health, nutrition, and education often increases, promoting higher levels of human capital.101
- Pay (WBL): These questions look at barriers to women’s pay equality. Restrictions that limit the range of jobs that women can hold can lead to occupational segregation and confinement of women to low-paying sectors and activities.102 Many jobs prohibited for women are in highly paid industries, which can have implications for their earning potential. Further, when women are excluded from “male” jobs in the formal sector, an overcrowding can occur in the “female” informal job sector. This leads to a depression of wages for an otherwise productive group of workers.103 Increasing women’s participation in the workforce alone is insufficient for increased economic growth.104 Women need access to the same job and pay opportunities in order to have an impact on economic growth.105
- Marriage (WBL): These questions look at the rights of women in marriage including questions on domestic violence, and child marriage. Research shows the earnings of women in formal wage work who are exposed to severe partner violence are significantly lower than women who do not experience such violence.106
- Parenthood (WBL): These questions look at the availability of parental leave and the rights of pregnant women. Childcare and parental leave increase workforce participation, leading to poverty reduction and increased economic growth.107
- Entrepreneurship (WBL): This area explores barriers to women’s ability to start businesses. When women receive fewer legal rights, the country’s potential labor force and potential pool of entrepreneurs decreases. Women’s ability to start businesses and create jobs is essential to increase economic growth and alleviate poverty.108
- Assets (WBL): This area analyzes women’s ability to own, control, and inherit property. Owning and having an equal say in their use of property not only increases women’s financial security; it is also associated with their increased bargaining power within the household.109
- Pension (WBL): This area examines questions of whether men and women have the same rights with respect to pensions, retirement, retirement age, and periods of absence from the workforce due to childcare. Having the same rights for pensions has been shown to reduce poverty, particularly for older women.110
- Child Marriage, Inheritance, and Women’s Safety (WBL): This area deals with women’s constitutional rights, and the status of Child Marriage. Due to the typically large age differences between girls younger than 18 and their husbands, child brides lack bargaining power in the marriage and have less say over their activities and choices, including education and economic activity.111 Child marriage—through reduced decision-making power, greater likelihood of school dropout and illiteracy, lower labor force participation and earnings, and less control over productive household assets—severely impedes the economic opportunities of young women.112
Indicator Institution Methodology
The indicators are de jure measures, consisting of legal reviews of the questions assessed.
The first portion of this indicator utilizes the WBL index comprised of 35 questions from the Women, Business, and the Law initiative of the World Bank. These questions are divided into 8 categories, each of which receives a score based on the percentage of questions with no restrictions on women’s rights (so a country where women have 3 of the 5 rights measured in a category, would score 60 for that category (because 3 is 60% of 5)). Finally, the scores for all 8 categories are averaged together to create the index.
MCC adds a ninth category using data from the WBL 2.0 index creating a category from three questions: Does the law address child marriage? Do a woman and a man have equal rights to confer citizenship on their spouses and their children? Does the law address femicide? Countries receive a score on this component of the indicator based on the share of protections. For example, if a country has laws protecting all three components, that country would score 100 on this component (because 3/3 is 100%).
MCC Methodology
The WBL Index breaks its sub-indicators into eight phases of a working woman’s life, each phase containing 4-5 sub-indicators, which are averaged to create the index. To aggregate these sub-indicators with the WBL 2.0 sub-indicators, MCC creates a ‘ninth’ category focused on child marriage and constitutional protection, which is averaged with the original eight from WBL. This means the WBL 2.0 data is 11% of the Women in the Economy indicator and the WBL Index data comprises 89%. An illustrative example of this calculation is below.
MCC’s Women in the Economy Score = [ (WBL Index Score x (8/9)) + (WBL 2.0 Score x (1/9)) ]
For example, imagine a country scored 38.125 on the WBL index and 0 on the WBL 2.0 questions. To find the country’s Women in the Economy score MCC averages the eight WBL categories with the ninth category from WBL 2.0: (38.125 *(8/9))+ (0*(1/9)) = 33.9.
If a country is missing WBL 2.0 data, but not the WBL index it is given a zero score for the WBL 2.0 component of this indicator. If a country is missing WBL index data, it is given an N/A score.
Market Competitiveness Indicator
This indicator measures a country government’s commitment to strengthening market forces in the economy by promoting a business environment that allows for innovation and open competition while limiting expropriation, state control of industry, and monopolies. This includes anti-trust laws, merger controls, state owned enterprises, intellectual property rights, fairness of the bidding process for public contracts, innovation, market dynamism, and the share of capital owned by the state.
Relationship to Economic Growth
Overall, market competition is linked to strong economic growth and poverty reduction throughout the world.113 Monopolies and State-owned enterprises increase poverty by limiting incentives for firms to innovate and encouraging rent seeking.114 These harmful effects can be mitigated by high quality merger control and anti-trust frameworks.115 Competition increases innovation, which increases productivity and decreases poverty.116 Fair public procurement systems decrease corruption and drive growth by increasing government efficiency and giving opportunities for small and medium enterprises to participate in the process.117
Indicator Institution Methodology
The sources use a combination of legal analysis, firm surveys, and expert surveys to determine a country’s score. This indicator uses data from two sources: the World Bank’s Business Ready (B-Ready) report on Market Competition (https://www.worldbank.org/en/businessready/data) and the Bertelsmann Transformation Index (BTI) on Organization of the Market and Competition (https://bti-project.org/).
- B-Ready: Quality of Regulations that Promote Market Competition: This pillar of B-Ready’s Market Competitiveness index is based on 3 components (Competition, Innovation and Technology Transfer, and Bidding for Public Contracts). Each of those components is made up of 4 sub-components. Overall, this component is largely de jure, focusing on the legal and regulatory framework for market competition.
- B-Ready: Implementation of Key Services Promoting Market Competition: This pillar of B-Ready’s Market Competitiveness index is based on the same 3 components as the first pillar (Competition, Innovation and Technology Transfer, and Bidding for Public Contracts); however, the focus of this indicator is more on the de facto implementation of the regulations covered by the first pillar. It focuses on questions regarding the actual time that merge reviews take to conduct or the time that public contracts take to be awarded.
- BTI: Organization of the Market and Competition: BTI conducts surveys of experts on questions of economic transformation. The component used for this indicator is focused on Organization of the market and competition, which measures the fundamentals of market competition and free markets, specifically looking at questions around market organization, competition policy, foreign trade, and the banking system.
MCC Methodology
MCC’s Market Competitiveness Score = [ (Normalized B-Ready Competition Pillar 1) ÷ 3] + [ (Normalized B-Ready Competition Pillar 3) ÷ 3] + [ (Normalized BTI) ÷ 3]
This index draws on the 2024 B-Ready dataset and the BTI 2024 report. Country scores are reported on the Scorecards as 2024 data. When some indicators are missing data, the others are used. Since the two sources of this index have different scales, MCC created a common scale for each of the indicators by normalizing them. Please see the equations below.
MCC Methodology to Normalize B-Ready and BTI Data:
- Normalized B-Ready Competition Pillar 1 = (Number of countries scoring below Country X on B-Ready Competition Pillar 1’s raw data in the income group) ÷ (Number of Countries scoring equal to or greater than Country X on B-Ready Competition Pillar 1’s raw data in the income group + Number of countries scoring below Country X on B-Ready Competition Pillar 1’s raw data in the income group)
- Normalized B-Ready Competition Pillar 3 = (Number of countries scoring below Country X on B-Ready Competition Pillar 3’s raw data in the income group) ÷ (Number of Countries scoring equal to or greater than Country X on B-Ready Competition Pillar 3’s raw data in the income group + Number of countries scoring below Country X on B-Ready Competition Pillar 3’s raw data in the income group)
- Normalized BTI = (Number of countries scoring below Country X on BTI raw data in the income group) ÷ (Number of Countries scoring equal to or greater than Country X on BTI’s raw data in the income group + Number of countries scoring below Country X on BTI’s raw data in the income group)
For example, to calculate a given country X’s score, MCC first finds the number of countries that score worse than that country in the income pool, and the number of countries that have the same or better score than country X on the sub-source. MCC then divides the number of countries below by the sum of the number of countries below and the number of countries equal or above. Missing values are not included in these calculations. Finally, MCC averages the normalized values for each source together. If one source is missing, the average of the normalized scores for the other two is used. If two sources are missing, the normalized score for the other is used. If all three are missing, the indicator is considered missing and assigned an “N/A”.
International Market Access Indicator
An index measuring a country government’s commitment to the free movement of capital, citizen access to international capital markets, and the barriers to global market access through import or export controls. This includes the cost and time for companies to comply with import and export requirements as well as controls on capital, investment, credit, and real estate.
Relationship to Economic Growth
Access to international markets has an impact on economic growth by providing opportunities for economic specialization, increasing investment, and raising productivity.118 International market access can help to accelerate long run economic growth by allowing for greater economic specialization, encouraging investment and increasing productivity.119 Rent seeking and corruption can be reduced by allowing for greater international competition.120 The relationship between trade openness and poverty reduction is complex; research suggests opening markets can improve the livelihoods and real incomes of the poor.121 Capital controls has been linked to lower economic growth and less FDI in many developing countries, though the research on the topic is nuanced and there may be some limited situations in which temporary capital controls are merited.122
Indicator Institution Methodology
This indicator uses data from two sources: the World Bank’s Business Ready (B-Ready) report on International Trade (https://www.worldbank.org/en/businessready/data) and the IMF’s Annual Report on Exchange Arrangements and Exchange Restrictions (AREAER), specifically the portion that assesses capital controls (https://www.elibrary-areaer.imf.org/Pages/Home.aspx). The indicators use a combination of expert surveys, firm surveys, and expert analysis to determine a country’s score.
- B-Ready: Compliance with Export Requirements: This component of B-Ready’s International Trade index (Category 3.1) is based on 2 sub-components: the total cost and the total time to comply with export requirements. These data are based on firm surveys capturing:
- The period (in days) required for directly exported goods to be released by all border control agencies, including clearance procedures prior to arrival at the point of exit.
- The total costs associated with complying with all export requirements, including customs fees, other required payments, and payments made to customs brokers or freight forwarders, transportation freight, trade finance, and insurance services.
- B-Ready: Compliance with Import Requirements: This component of B-Ready’s International Trade index (Category 3.2) is based on 2 sub-components: the total cost and the total time to comply with import requirements. These data are based on firm surveys capturing:
- The period (in days) required for directly imported material inputs and supplies (or finished goods and materials purchased to resell) to be released by all border control agencies, including clearance procedures prior to arrival at the point of entry until all material inputs and supplies are released.
- The total costs associated with complying with all import requirements, including customs fees, other required payments, and payments made to customs brokers or freight forwarders.
- AREAER: Capital Controls: IMF country experts provide information for the AREAER report to assess whether certain capital controls are in place. MCC uses the eight sub-components of index XI.A Controls on capital transactions (Repatriation requirements, Controls on capital and money market instruments, Controls on derivatives and other instruments, Controls on credit operations, Controls on direct investments, Controls on liquidation of direct investment, Controls on real estate transactions and Controls on personal capital transactions). These are each binary questions asking whether or not the particular capital control exists in the country.
MCC Methodology
MCC’s International Market Access Score = [ (Normalized B-Ready Export) ÷ 3] + [ (Normalized B-Ready Import) ÷ 3] + [ (Normalized AREAER Capital Controls) ÷ 3]
This index draws on the 2024 B-Ready dataset and the AREAER 2024 dataset released in 2025 representing calendar year 2023. Country scores are reported on the Scorecards as 2024 data. When some indicators are missing data, the others are used. Since the two sources of this index have different scales, MCC created a common scale for each of the indicators by normalizing them. Please see the equations below.
MCC Methodology to Normalize B-Ready and AREAER Data:
MCC uses the methods used for other indicators to normalize the B-Ready Export and Import data to a common scale.
- Normalized B-Ready Export = (Number of countries scoring below Country X on Export’s raw data in the income group) ÷ (Number of Countries scoring equal to or greater than Country X on Export’s raw data in the income group + Number of countries scoring below Country X on Export’s raw data in the income group)
- Normalized B-Ready Import = (Number of countries scoring below Country X on Import’s raw data in the income group) ÷ (Number of Countries scoring equal to or greater than Country X on Import’s raw data in the income group + Number of countries scoring below Country X on Import’s raw data in the income group)
To normalization process for AREAER is slightly more complicated. To get the score from the eight binary datapoints, a country gets one point for each component where there is no capital control in place or the area is not regulated, and zero points if the area has a capital control or there is no information available. This means a country can score between zero and eight on this component, where eight represents no capital controls. This score is then normalized using the following process.
- Normalized AREAER = (Number of countries scoring below Country X on AREAER’s raw data in the income group) ÷ (Number of Countries scoring equal to or greater than Country X on AREAER’s raw data in the income group + Number of countries scoring below Country X on AREAER’s raw data in the income group)
For example, to calculate a given country X’s score, MCC first finds the number of countries that score worse than that country in the income pool, and the number of countries that have the same or better score than country X on the sub-source in the income pool. MCC then divides the number of countries below by the sum of the number of countries below and the number of countries equal or above. Missing values are not included in these calculations. Finally, MCC averages the normalized values for each source together. If one source is missing, the average of the normalized scores for the other two is used. If two sources are missing, the normalized score for the other is used. If all three are missing, the indicator is considered missing and assigned an “N/A”.
Business Start-Up Indicator
An index that rates countries on the time and cost of complying with all procedures officially required for an entrepreneur to start up and formally operate an industrial or commercial business as well as the overall business environment in a country.
Relationship to Economic Growth
The ability to start a business is important for encouraging entrepreneurship and economic growth.123 Easing business entry into the formal economy can reduce unemployment, encourage investment, expand the tax base, help small entrepreneurs to access bank credit, allow workers to enjoy health insurance and pension benefits, and enable businesses to achieve economies of scale.124 A better environment for businesses and entrepreneurship can lead to poverty reduction and broad-based economic growth.125
Indicator Institution Methodology
This indicator uses data from two sources: the Heritage Foundation’s indicator on Business Freedom (https://www.heritage.org/index/pages/all-country-scores) and the World Bank’s Business Ready (B-Ready) report on Business Entry (https://www.worldbank.org/en/businessready/data). The indicators use a combination of expert surveys, firm surveys, and expert analysis to determine a country’s score.
- Heritage: Business Freedom: The Heritage Foundation combines several sub-sources on access to electricity, business risk, regulatory quality, and women’s economic inclusion to create an index that captures the overall business environment in a country.
- B-Ready: Domestic Firm Registration: This component of B-Ready’s Business Entry index (Category 3.1) is based on 2 sub-components: the total cost and the total time to register a new domestic firm. The scores for these questions are based on the responses to expert surveys.
- B-Ready: Foreign Firm Registration: This component of B-Ready’s International Trade index (Category 3.2) is based on 2 sub-components: the total cost and the total time to register a new foreign firm. The scores for these questions are based on the responses to expert surveys.
MCC Methodology
MCC’s Business Start-Up Score = [ (Normalized B-Ready Domestic) ÷ 3] + [ (Normalized B-Ready Foreign) ÷ 3] + [ (Normalized Heritage Business Freedom) ÷ 3]
This index draws on the Heritage 2025 dataset and the 2024 B-Ready dataset. Country scores are reported on the Scorecards as 2024 data. When some indicators are missing data, the others are used. Since the two sources of this index have different scales, MCC created a common scale for each of the indicators by normalizing them. Please see the equations below.
MCC Methodology to Normalize B-Ready and Heritage Data:
- Normalized B-Ready Domestic = (Number of countries scoring below Country X on Domestic raw data in the income group) ÷ (Number of Countries scoring equal to or greater than Country X on Domestic raw data in the income group + Number of countries scoring below Country X on Domestic raw data in the income group)
- Normalized B-Ready Foreign = (Number of countries scoring below Country X on Foreign raw data in the income group) ÷ (Number of Countries scoring equal to or greater than Country X on Foreign raw data in the income group + Number of countries scoring below Country X on Foreign raw data in the income group)
- Normalized Heritage Business Freedom = (Number of countries scoring below Country X on Business Freedom raw data in the income group) ÷ (Number of Countries scoring equal to or greater than Country X on Business Freedom raw data in the income group + Number of countries scoring below Country X on Business Freedom raw data in the income group)
For example, to calculate a given country X’s score, MCC first finds the number of countries that score worse than that country in the income pool, and the number of countries that have the same or better score than country X on the sub-source in the income pool. MCC then divides the number of countries below by the sum of the number of countries below and the number of countries equal or above. Missing values are not included in these calculations. Finally, MCC averages the normalized values for each source together. If one source is missing, the average of the normalized scores for the other two is used. If two sources are missing, the normalized score for the other is used. If all three are missing, the indicator is considered missing and assigned an “N/A”.
Notes:
Note on Calculating Medians
In calculating medians for indicators, MCC does not include scores of countries that do not report data (earning an N/A score) for median or percentile rank calculations. For example, if there are 55 countries in the candidate pool and only 50 report data, MCC uses only the 50 that report data in calculating the median and percentile ranks. MCC calculates separate medians for each scorecard income pool. When percentile ranks are used to determine passage, if multiple countries are tied for the minimum, their percentile ranks are set to 0%. If multiple countries are tied for the median, their percentile ranks are set to 50%. When scores instead of percentiles are used to determine passage (as in the case of Government Accountability, Personal Freedom, and Inflation) then the median is not forced to the 50th percentile, nor is the minimum forced to the 0th percentile.
Open Data
Following the publication of the scorecards, MCC posts the data used to construct them to its Open Data Portal (https://data.mcc.gov/). These data serve to clarify any ambiguities in MCC’s methodology and provide access to the data that informs the scorecards.
2025-001-3135-02