

Background: Lusaka’s Water Sector
The proposed program of investments stood on an institutional foundation built up over the previous fifteen years. Starting in the mid-1990s, Zambia had begun to address the mismanagement of its water sector. The GOZ introduced a series of reforms, including the 1997 Water Supply and Sanitation Act, establishing a legal and regulatory structure for water in keeping with international standards. An independent regulator, the National Water and Sanitation Council (NWASCO), came into being in 2000; it is responsible for licensing, establishing standards, and approving rates. Lusaka’s water utility was re-created as an independent, government-owned corporation operating on a commercial basis. With the support of a Water Sector Performance Improvement Project funded by the World Bank, it turned a financial surplus for the first time in 2009. These young institutions were still struggling to catch up after decades of underinvestment in the water sector, but their growing capacity and positive trajectory represented an opportunity for partnership to support infrastructure investments in the water sector for sustained improvements in health and prosperity.
At this time, the management of water resources and the provision of water supply and sanitation services were divided under the legal authority of two ministries. The Ministry of Energy and Water Development’s mandate included developing and managing water resources in an integrated and sustainable manner and increasing access to safe reliable water so that water resources supported the social and economic development of the country.[[Ministerial Statement on Water Resources Management by Honorable Dora Siliya, M.P., May 2016]] The Ministry’s responsibility also included the management of the Water Resources Management Authority (WARMA), which was established under the 2011 Water Act.[[The Water Resources Management Authority’s objective is to promote and adopt a dynamic, gender-sensitive, integrated, interactive, participatory and multisector approach to water resource management and development that includes human, land, environmental and socio-economic considerations, especially poverty reduction and the elimination of waterborne diseases, including malaria. http://www.wrmtest.com/warma-about-us/]] The Ministry of Local Government and Housing’s mandate oversaw the provision of services, including water supply and sanitation provided by the nation’s 11 commercial water utility companies and regulated by NWASCO, and drainage and solid waste services provided by local governments throughout Zambia.
In 2016, the GOZ established the Ministry of Water Development, Sanitation, and Environmental Protection (MWDSEP) in recognition of the growing importance of water resource management and related services. The new MWDSEP took over water resource management and the provision of water supply and sanitation from the two aforementioned ministries and is responsible for water policy, water supply and sanitation services, and water resource management and development. The new Ministry of Local Government continued to oversee drainage and solid waste management throughout Zambia.
At the time of compact development, Lusaka’s water supply, sanitation, and drainage systems were crumbling. Constructed in the 1960s and 1970s for a city that was a tenth the size, by 2010 the system had not benefitted from major capital investment or proper maintenance in the intervening years. Nor was there a capable central planning authority or local government to guide the city’s development and coordinate the introduction of public services into the expanding urban fabric. As a result, core infrastructure assets were outdated, dilapidated, spatially limited, and unable to meet current demand – let alone the future needs of Lusaka’s rapidly increasing urban and peri-urban population.
In 2010, only about 30 percent of Lusaka residents had household-level connections to the municipal water supply. An additional 40 percent could draw water from the municipal supply at a community water point, bringing the level of service to approximately 70 percent.[[Water Supply Investment Master Plan: Investment Strategy Report, Jan 2011. http://www.mcaz.gov.zm/wp-content/uploads/2015/10/Lusaka-Water-Master-Plan-investment-strategy-report-summary-for-printing.pdf]] However, these community water points were poorly designed and maintained, frequently vandalized, and generally without clear ownership. Furthermore, the municipal water utility (LWSC) pumped an insufficient volume of water into the system each day when compared to demand. If the water system had been functioning well, it could have met about 85 percent of the demand; however, LWSC was unable to account for roughly half of the water it produced.[[Ibid.]] These enormous losses—known as non-revenue water[[Non-revenue water is treated water that goes unpaid for. There are two main categories of non-revenue water: (a) water that is lost through leaks and broken pipes (physical losses), and (b) water that goes unbilled or unpaid for due to issues such as inaccurate water meters, water theft, poor management of billing records, and the like (commercial losses).]]—seriously undermined the utility’s financial viability and exacerbated continuity of service problems, leaving Lusaka residents without water periodically throughout the day.
In addition to an insufficient and intermittent water supply, the quality of water delivered to customers was inconsistent. Although LWSC treated the municipal drinking water supply, treatment was not always reliable or sufficient to maintain adequate[[The idea of adequate water quality refers to delivering water to consumers that meets drinking water standards.]] water quality throughout the entire network. Water quality was an even bigger problem for those residents who lacked easy access to municipally-supplied water and relied on a variety of formal and informal water sources. Water from these sources was rarely treated, therefore carrying a higher risk for waterborne disease. Lusaka’s rapid peri-urban growth incudes high-density neighborhoods, many of which are also low-income areas. Unplanned growth combined with the difficulty of laying water pipes in tight confines had prevented expansion of the water supply network into many of these low-income neighborhoods. Throughout the city, residents often resorted to using shallow wells for drinking water, but these were at a high risk of contamination. An estimated 10-15 percent of Lusaka residents had access to sanitation through a connection to the sewer network, which covered only about 30 percent of the area served by the municipal water supply.[[Final Sanitation Master Plan, Lusaka, Zambia. June 24, 2011. http://www.mcaz.gov.zm/wp-content/uploads/2015/10/Final-Sanitation-Master-Plan-for-Printing1.pdf]] Where residents lacked a sanitation connection, people typically relied on pit latrines. Poorly designed, many of these pit latrines leaked and contaminated the surrounding groundwater. All of these factors contributed to a high incidence and prevalence of waterborne diseases. During the compact development phase, Lusaka’s total infectious diarrhea rate (including cholera) was estimated at 13.8 percent, which is considered moderate to high.
Lusaka’s climate and geology amplifies these water supply and sanitation challenges. The aquifer beneath the city is as little as two meters below the land surface, making shallow wells an accessible water source. But this same accessibility renders the aquifer extremely vulnerable to contamination. In addition, the ground underneath the city is highly permeable due to the rocky limestone/marble bedrock with numerous fissures, sinkholes, and underground flow paths (a geology known as “karst”). This means that ubiquitous, unlined pit latrines, leaking sewers, and even drainage ditches impact the city’s groundwater with fecal contaminants and nitrates from human waste.
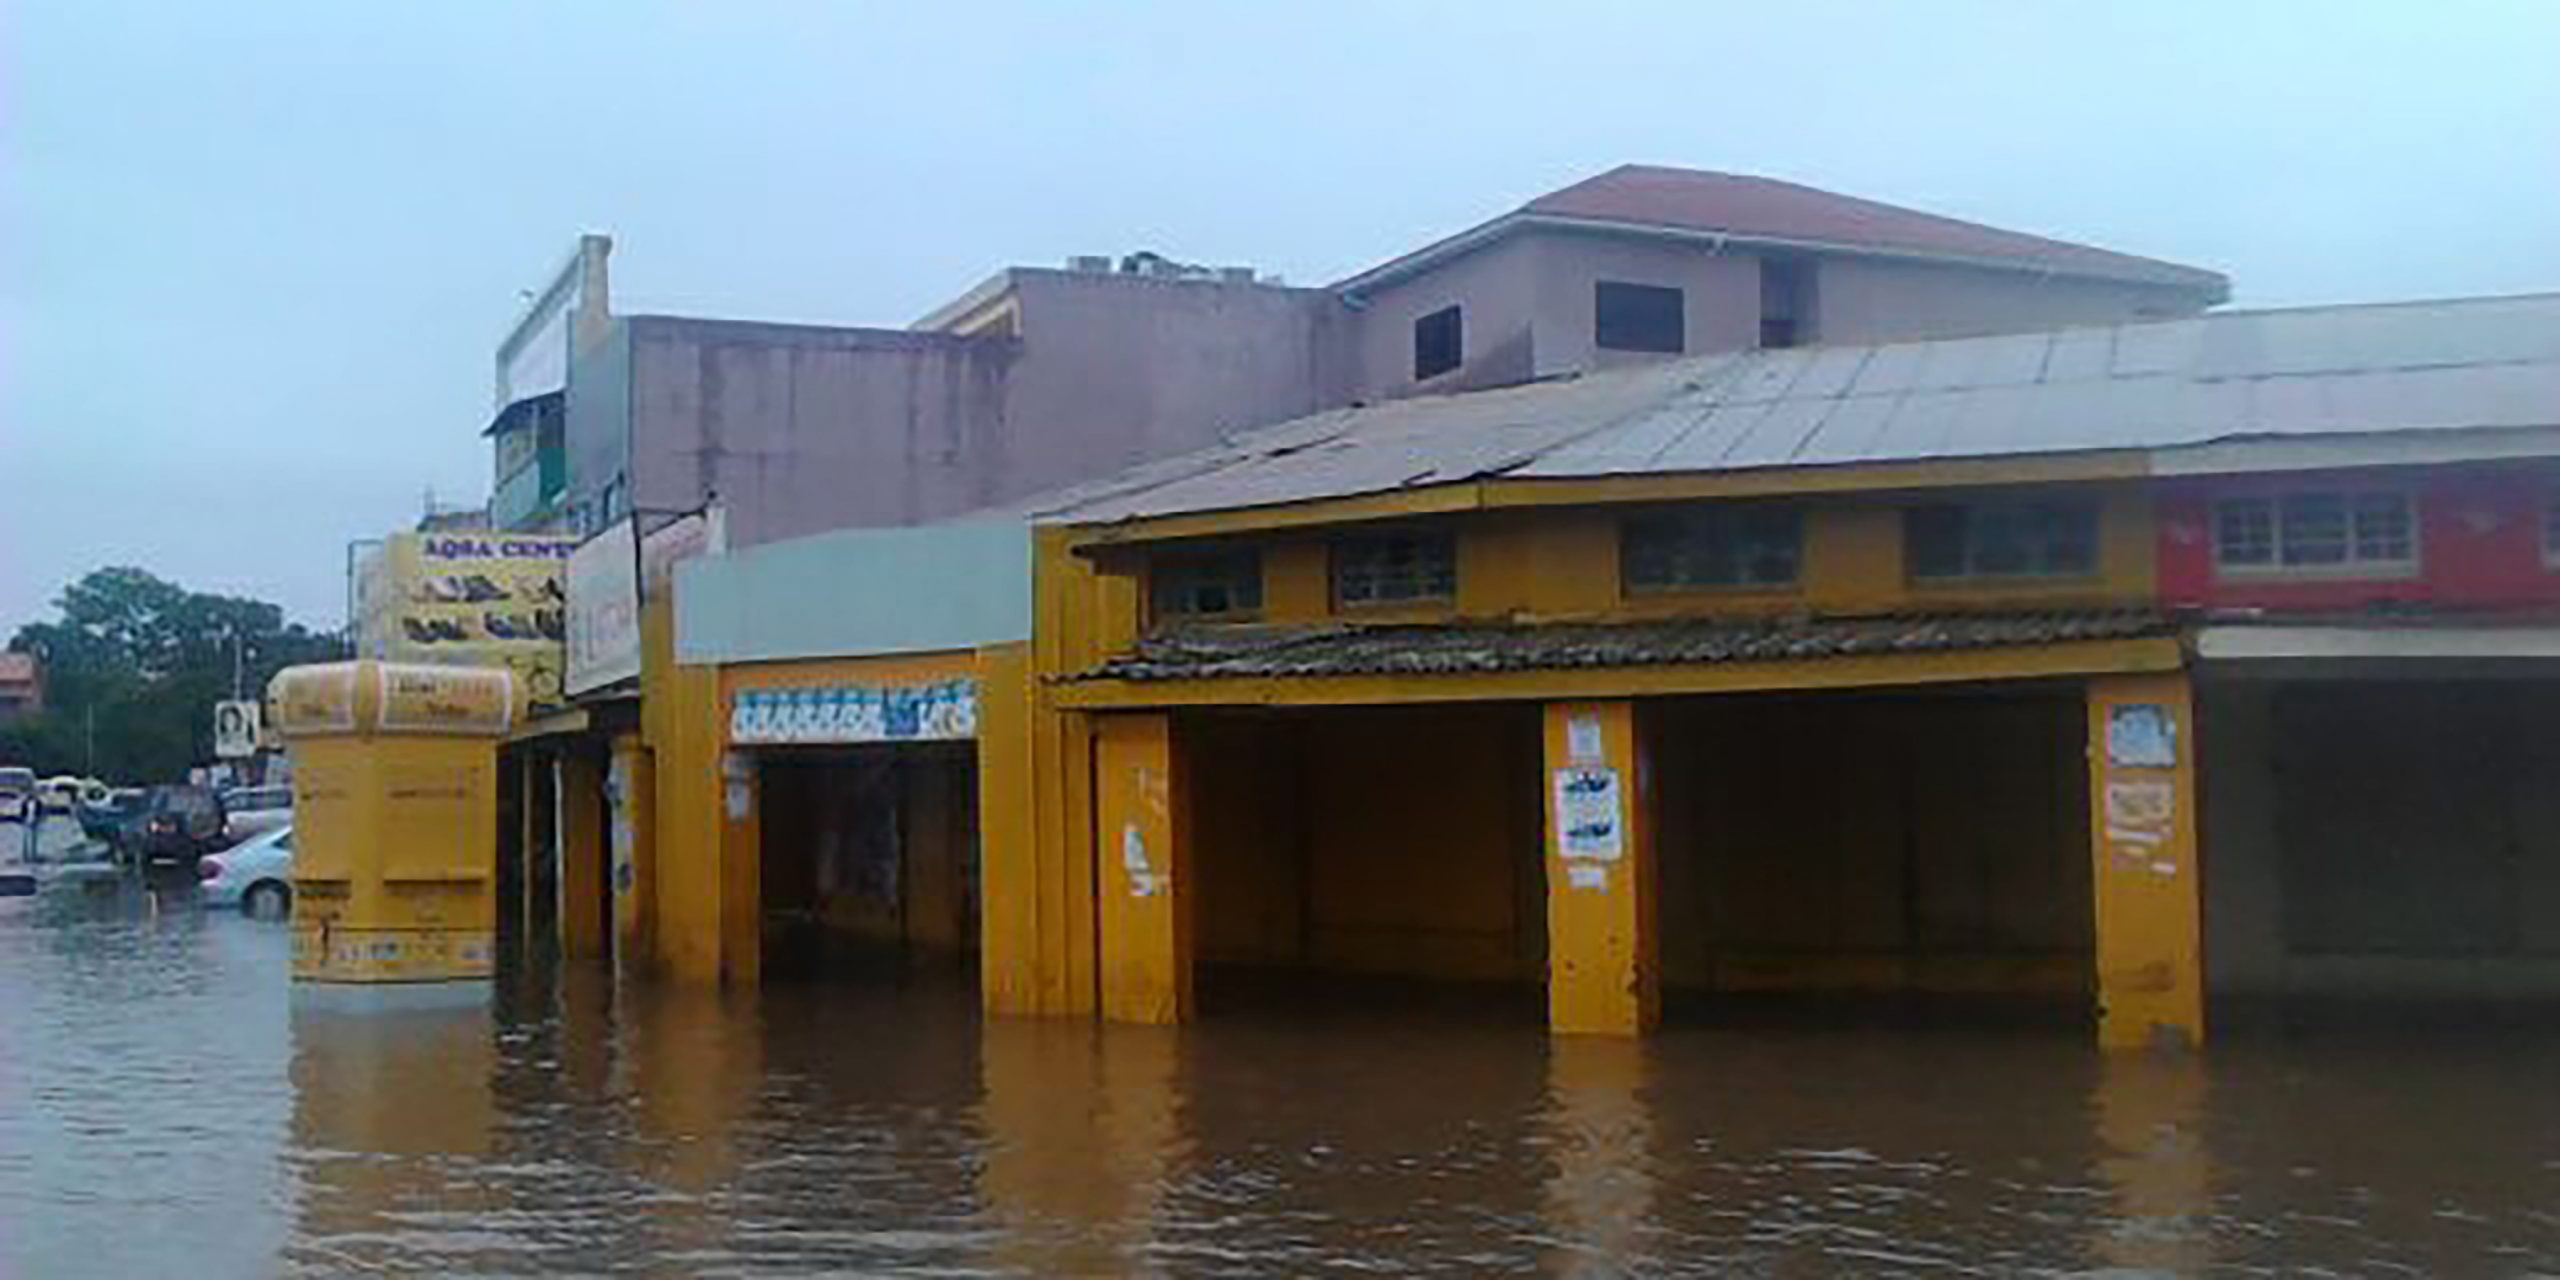
Compounding matters, seasons in Zambia are defined by rainfall, with heavy rains during the wet season (late November through April) and very dry conditions the rest of the year. The city of Lusaka sits on a flat plateau, so there is little slope to facilitate drainage during the rainy season, which brings extensive and frequent flooding. In many areas, the existing drainage infrastructure is inadequate and insufficiently maintained to evacuate the water during heavy rains. The floods cause pit latrines to overflow, which is an environmental and health hazard that contributes to waterborne disease.
Drainage issues cannot all be attributed to climate and drain design, however. They are greatly exacerbated by solid waste management problems. The same urban growth that strained the water supply also produced increasing quantities of solid waste. Much of Lusaka’s trash and recycling infrastructure—constructed more than 40 years ago—became inadequate to serve the population. According to records at the municipal dumpsite, only 26 percent of solid waste is collected and properly disposed of. For a variety of financial and political reasons, local authorities responsible for solid waste management were unable to fulfill their responsibilities in this area. Households—contributing about 80 percent of the city’s waste—often resort to burning their waste or disposing of it in drainage ditches, which blocks water flow and causes flooding.
The degraded and inadequate condition of Lusaka’s core infrastructure and poor provision of municipal services described above forced Lusaka’s residents to expend excessive time and resources to meet basic household and business water needs. Poor sanitation habits and facilities contaminated water sources and contributed to water-related diseases. Inadequate water supply forced people to seek alternative sources of (often of questionable quality) water. Low rates of solid waste collection and disposal led to health problems and to people using drainage channels for garbage disposal, contributing to flooding. Flooding caused additional lost time, property damage, school closures, and the disruption of health and social services, resulting in further losses to productivity and diminished well-being. The aforementioned peri-urban areas were the most affected, compounding poverty levels and contributing to poor public health.
The Zambia Compact was designed to address these issues in a single project, the Lusaka Water Supply, Sanitation, and Drainage Project. The project supported large-scale infrastructure investments and institutional strengthening and reform of Lusaka’s water sector. Through these activities, the project expanded access to, and improved the reliability of, water supply and sanitation, as well as improved drainage services and related solid waste management in select urban and peri-urban areas of the capital. The project aimed to decrease the incidence of water-related diseases, generate time savings for households and businesses, and reduce non-revenue water at the utility. Approximately 1.2 million people in Lusaka are expected to benefit from the project over twenty years. This number is based on 860,000 people already connected to the system at compact signing, peri-urban residents connected to the system for the first time, and the residents and businesses who experience reduced flooding from the drainage project.
The key players in Lusaka’s water sector—Lusaka Water and Sewerage Company (LWSC) and Lusaka City Council (LCC)—were natural partners to complete and maintain the planned water, sanitation, and drainage investments; these bodies therefore served as the compact’s two implementing entities.
| Lusaka Water and Sewerage Company (LWSC) |
| Established in 1988, LWSC is a commercial utility owned by the local government. LWSC is responsible for the provision and improvement of water supply and sanitation services in the greater Lusaka area. A limited liability company, it owns and operates water and sewer assets, sells water and sewerage services, and is expected to operate on a commercially sustainable basis. |
| Lusaka City Council (LCC) |
| Lusaka City Council (LCC) is responsible for managing Lusaka’s drainage network and solid waste. Zambian law provides for the creation of Local Authorities, and lists 63 separate functions that they fulfill. LCC is the governing Local Authority for the city of Lusaka. |
The project consisted of two activities, infrastructure improvement and institutional strengthening:
- Infrastructure Activity. This activity invested in infrastructure development and rehabilitation, including interventions to rehabilitate the core water supply network, rehabilitate and expand select water supply and sewage networks to peri-urban areas, and improve select drainage infrastructure.
- Institutional Strengthening Activity. The main objective of this activity was to strengthen the service delivery and operational capacities of the LWSC and the LCC, the two institutions with jurisdiction over the infrastructure investments of the project. Support included asset management assistance to reduce non-revenue water at LWSC, enhance drainage maintenance at LCC and as an outgrowth of the effort to enhance drain maintenance at LCC, the establishment of an autonomous solid waste management unit. The activity also assisted both institutions in developing inclusive policies and structures to improve the reach and quality of service delivery to the poor and to increase uptake and maintenance of water and sewer services and infrastructure. Parallel efforts developed information, education and communications campaigns and built in-house capacity at LWSC and LCC to promote behavior change and service uptake. Finally, this activity supported a competitive grant program to spur innovation in water, sanitation and solid waste management.
Infrastructure Activity
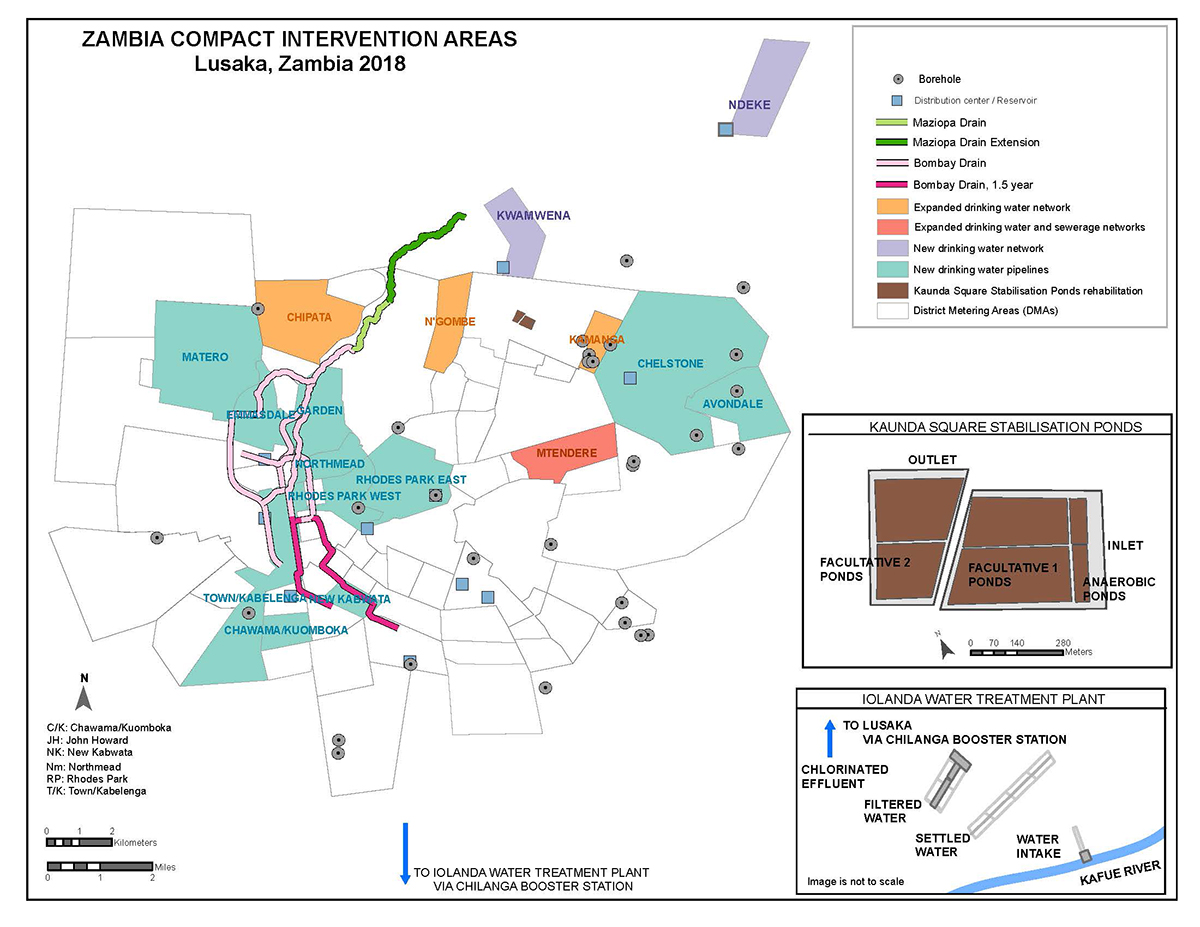
Within the ambitious vision for large-scale infrastructure investments to improve and expand water supply, sanitation, and drainage services in Lusaka, MCC and the GOZ needed to define specific projects for the compact. Three key documents guided the selection of the components of the Infrastructure Activity: a study funded by the Japanese International Cooperation Agency (JICA) and two GOZ investment master plans. The JICA study[[Study on Comprehensive Urban Development Plan for the City of Lusaka in the Republic of Zambia, http://open_jicareport.jica.go.jp/618/618/618_533_11932852.html]] identified priorities used to select drainage investments, while the Government plans outlined strategies for the water and sanitation investments.
The GOZ water and sanitation investment master plans were themselves the product of the MCC – GOZ partnership. During the development of the compact, MCC supported the GOZ in building out a long-term strategy for water and sanitation, aimed at ensuring that MCC’s investment would fit into a lasting and comprehensive program of improvement. This planning initiative resulted in a pair of water supply[[http://www.mcaz.gov.zm/wp-content/uploads/2015/10/Lusaka-Water-Master-Plan-investment-strategy-report-for-printing-V2.pdf]] and sanitation[[http://www.mcaz.gov.zm/wp-content/uploads/2015/10/Final-Sanitation-Master-Plan-for-Printing1.pdf]] investment master plans charting a 25-year, three-phase strategy for more than $2.7 billion in investments to meet the needs of a Lusaka population projected to reach 4.9 million by 2035. The Water Supply Investment Master Plan mapped out eleven projects in Lusaka[[LWSC is also responsible for the water supply in the towns of Kafue, Chongwe and Luanga. The Water Supply Investment Master Plan therefore also included an additional six projects spread across these three towns, bringing the estimated total costs of all the projects outlined in the Plan to $815 million.]] at an estimated cost of $772 million, prioritized across three phases to achieve 100 percent access to safe water by 2035 with 80 percent of households connected to the municipal water supply.[[The Water Supply Investment Master Plan does not elaborate on the 20 percent of households with access to safe water but lacking a household connection to the municipal supply. Presumably this 20 percent includes (a) households who choose not to connect to the municipal water supply in their neighborhood (e.g., perhaps because they prefer their existing private borehole well, because of affordability considerations, etc.), as well as (b) households in neighborhoods that lack the option of household-level connections but are served by community water kiosks connected to the municipal supply.]] The Sanitation Investment Master Plan identified 130 projects estimated at $1.9 billion, to reach 100 percent access to improved sanitation (both sewer and on-site) by 2035. Not only did these master plans help the GOZ prioritize where to target the compact’s investments, they also added significant value and promoted the sustainability of MCC’s infrastructure projects by clearly outlining funding needs to the private sector and donor community (see also the Coordination and Partnerships section of this report for more information).
The infrastructure projects ultimately selected for the compact were expected to expand water and sanitation networks to select peri-urban neighborhoods, rehabilitate core water infrastructure, bolster water supply, and improve service delivery across the utility’s entire customer base. They would also improve the technical and financial position of the water utility by aiming to reduce non-revenue water losses from 57 percent to an estimated 34 percent.[[To contextualize these statistics on non-revenue water (NRW): Using performance data from the International Benchmarking Network for Water and Sanitation Utilities (IBNET, at www.ib-net.org), the World Bank reported that NRW averages around 35 percent for developing countries. However, underreporting and geographic coverage gaps in the IBNET database led the authors to estimate that the true overall NRW level for the developing world is closer to 40-50 percent. The report further suggested that cutting these losses in half is an attainable target; the best-performing developing world utilities achieve NRW levels below 25 percent. See Kingdom, B.; Roland, L.; and P. Marin. (2006) The challenge of reducing non-revenue water (NRW) in developing countries – how the private sector can help: a look at performance-based service contracting. Water Supply and Sanitation Sector Board discussion paper no. 8. Washington, D.C.: World Bank. According to the Water Supply Investment Master Plan referenced in footnote 26, the Zambian independent utility regulator (NWASCO) considers NRW levels above 25 percent to be “unacceptable,” 20-25 percent to be “acceptable,” and below 20 percent to be “good.”]] Specific investments under the activity are described below, and summarized in Figure 1 (below).
A Complex Environment
The dynamic and dense urban environment of a city without central planning functions created a unique set of challenges for the compact. The key sectoral actors in Lusaka planned, developed, and designed infrastructure activities over a period of several years, but the time-scale of the growth, expansion, and remodeling of relevant areas within the city was weeks or months. As a result, intervention plans were sometimes rendered irrelevant or obsolete by the time they were finalized, designs needed frequent updates, and engineers scrambled to complete “just-in-time” redesigns[[A “just-in-time redesign” is a last-minute change where technical details are adjusted shortly before construction begins. Ideally, plans and engineering designs are developed ahead of time, to allow for optimum planning, efficiency, and coordination of various project components.]] for evolving projects that had in some cases accumulated significant delays. Such extensive adaptability is not a typical characteristic of large infrastructure construction projects, but it was essential in this challenging urban setting.
Additionally, water, sewer, and drainage work is disruptive; it involves digging up streets and laying pipes. Coordination between roads, water, sewer, and electric authorities helps infrastructure work to progress efficiently, but Lusaka’s independent authorities had little experience working in concert. Many of the construction sites were in crowded markets or in dense, growing, informal residential neighborhoods. Beyond the technical challenges of maneuvering heavy equipment in confined spaces, conditions like these demand extra focus on community engagement, safety and access, with special attention to managing heavy vehicle and pedestrian traffic. Although some of the water and sewer work took place within established utility rights of way, the project required acquiring land and other assets, causing involuntary resettlement.[[Resettlement refers both to physical displacement (relocation or loss of shelter) and to economic displacement (loss of assets or access to assets that leads to loss of income sources or other means of livelihood) as a result of project-related land acquisition or restrictions on land use. It can be either permanent or temporary depending on the circumstances. Resettlement is considered involuntary when affected persons or communities do not have the right to refuse land acquisition or restrictions on land use that result in physical or economic displacement. This occurs in cases of (i) lawful expropriation or temporary or permanent restrictions on land use and (ii) negotiated settlements in which the buyer can resort to expropriation or impose legal restrictions on land use if negotiations with the seller fail. See International Finance Corporation. (2012). Performance Standard 5 Land Acquisition and Involuntary Resettlement, retrievable from: https://www.ifc.org/wps/wcm/connect/115482804a0255db96fbffd1a5d13d27/PS_English_2012_Full-Document.pdf?MOD=AJPERES]]
MCC requires those whose livelihoods will be affected by the project, including those who have no recognizable legal right or claim to the land that they are occupying, to be compensated fairly, transparently, and in a manner that seeks to improve their livelihood to pre-displacement levels. By the compact’s end date of November 2018, the project resulted in 5,167 project-affected people (46 percent were men, 42 percent were women, and 12 percent were institutions).[[A project-affected person (“PAP”) is an individual or a family (household) that loses a home, land, or business interests because of project-required land acquisition. Any given resettlement impact could affect one or more people depending on whether it is registered for an individual, a household, a business, or other entity (such as a church or other organization).]] While most of these impacts were relatively minor (e.g., loss of plants on property, temporary business disturbance, loss of wall/fence/other structure) one percent was significant, meaning that people lost land, their residence, and/or income sources as a direct result of the infrastructure project. In particular, 132 people lost gardens that were their primary source of income or subsistence. These individuals received compact-funded special training intended to restore their livelihoods and provide skills for weathering future shocks, as well as funds to start and grow new businesses.[[Throughout the livelihood restoration process, gender expertise and targeted support were extended to mitigate the particular risks that female project-affected people faced retaining control of their compensation within their households and investing in new opportunities.]] In spite of proactive measures to reduce displacement, the number of people affected and the cost of managing their displacement increased significantly over the course of the compact, as outlined in the Compact Changes section of this report.
MCC and the MCA engaged the community to garner buy-in and support of the project. The public consultation process initiated during the development of the compact continued throughout the construction phase. MCA designed and implemented consultations in the areas directly impacted by the Infrastructure Activity, which allowed stakeholders an opportunity to express their concerns and learn more about the benefits of the project. These efforts helped garner support for the project, facilitated construction, mitigated community frustrations when delays and errors occurred, and created community buy-in. Moreover, MCA’s contractors were encouraged to make efforts to hire from the local community to work on the construction sites, providing temporary skilled and unskilled jobs. These efforts included setting a 30 percent voluntary target[[The 30 percent target was drawn from a Southern African Development Community (SADC) protocol. That protocol is now outdated. However many countries use 30 percent as a target for women’s representation in politics, and a number of companies have followed suit for board and executive level representation.]] for contractors under the Infrastructure Activity to employ women in construction jobs, which ultimately achieved a rate of 22 percent female employment (well in excess of the global rate of 10 percent).[[World Economic Forum, 2016. The Future of Jobs, Table 14. http://www3.weforum.org/docs/WEF_Future_of_Jobs.pdf]]
Water Supply Investments
MCC investments under the Infrastructure Activity included expansion and rehabilitation of Lusaka’s drinking water supply infrastructure. Ideally, the spatial extent of a city’s water distribution network and the quality and quantity of water from the utility would be sufficient to provide all residents with access to safe drinking water. MCC’s compact investments in Lusaka’s water supply worked towards this ideal by addressing challenges at almost every step in the water supply system—at the source, at the distribution network level, and at the end-user connection.
A combination of factors contributed to the inadequacy of the water supply in Lusaka, including growing water demand from an increasing number of unplanned new developments within the city, as well as water lost through leakages and pipe bursts within the distribution system. Such physical losses of water are particularly problematic. Leakage means there is less water left to meet demand, as well as representing lost revenue for the utility, which incurs the cost of treating all the water but can bill only for the volume that actually reaches consumers.
The water supply in peri-urban Lusaka was particularly insufficient compared to the growing population in those areas. Prior to 1954, Lusaka’s water supply came from relatively small-diameter borehole[[A borehole well is a narrow shaft drilled vertically into the ground. It allows for pumping (extraction) and/or sampling of groundwater.]] wells. Over several decades, larger boreholes were installed in various parts of the city to boost water production. However, as demand for water increased (due to both population and economic growth), hydrological studies revealed the limits of the groundwater resource. In response, the city turned to the Kafue River located 30 miles southwest of Lusaka to supplement its water supply. At the start of the compact, water production stood at approximately 225 million liters per day (ML/d), about 40 percent of which came from the Kafue river (surface water) and 60 percent from groundwater. A large fraction of this water was being lost due to leaks in the system. Demand for water stood at approximately 260 ML/d[[Water Supply Investment Master Plan: Investment Strategy Report, Jan 2011. http://www.mcaz.gov.zm/wp-content/uploads/2015/10/Lusaka-Water-Master-Plan-investment-strategy-report-summary-for-printing.pdf]]. Lusaka was already exploiting the groundwater resource at close to the maximum feasible level, and the groundwater was increasingly polluted or at risk of pollution. Given that LWSC could meet less than half of existing demand, the utility desperately needed increased investment in water supply infrastructure, essential for the city’s economic growth, and for the well-being and health of its citizens.
The water supply component of the Infrastructure Activity sought to address these issues through key improvements to the supply of water from the source to the end user. Specifically, it included investments in water treatment and in the network of pipes that deliver water from the source to end users. MCC estimates that the system-wide improvements to the water supply will benefit 860,000 people in Lusaka.
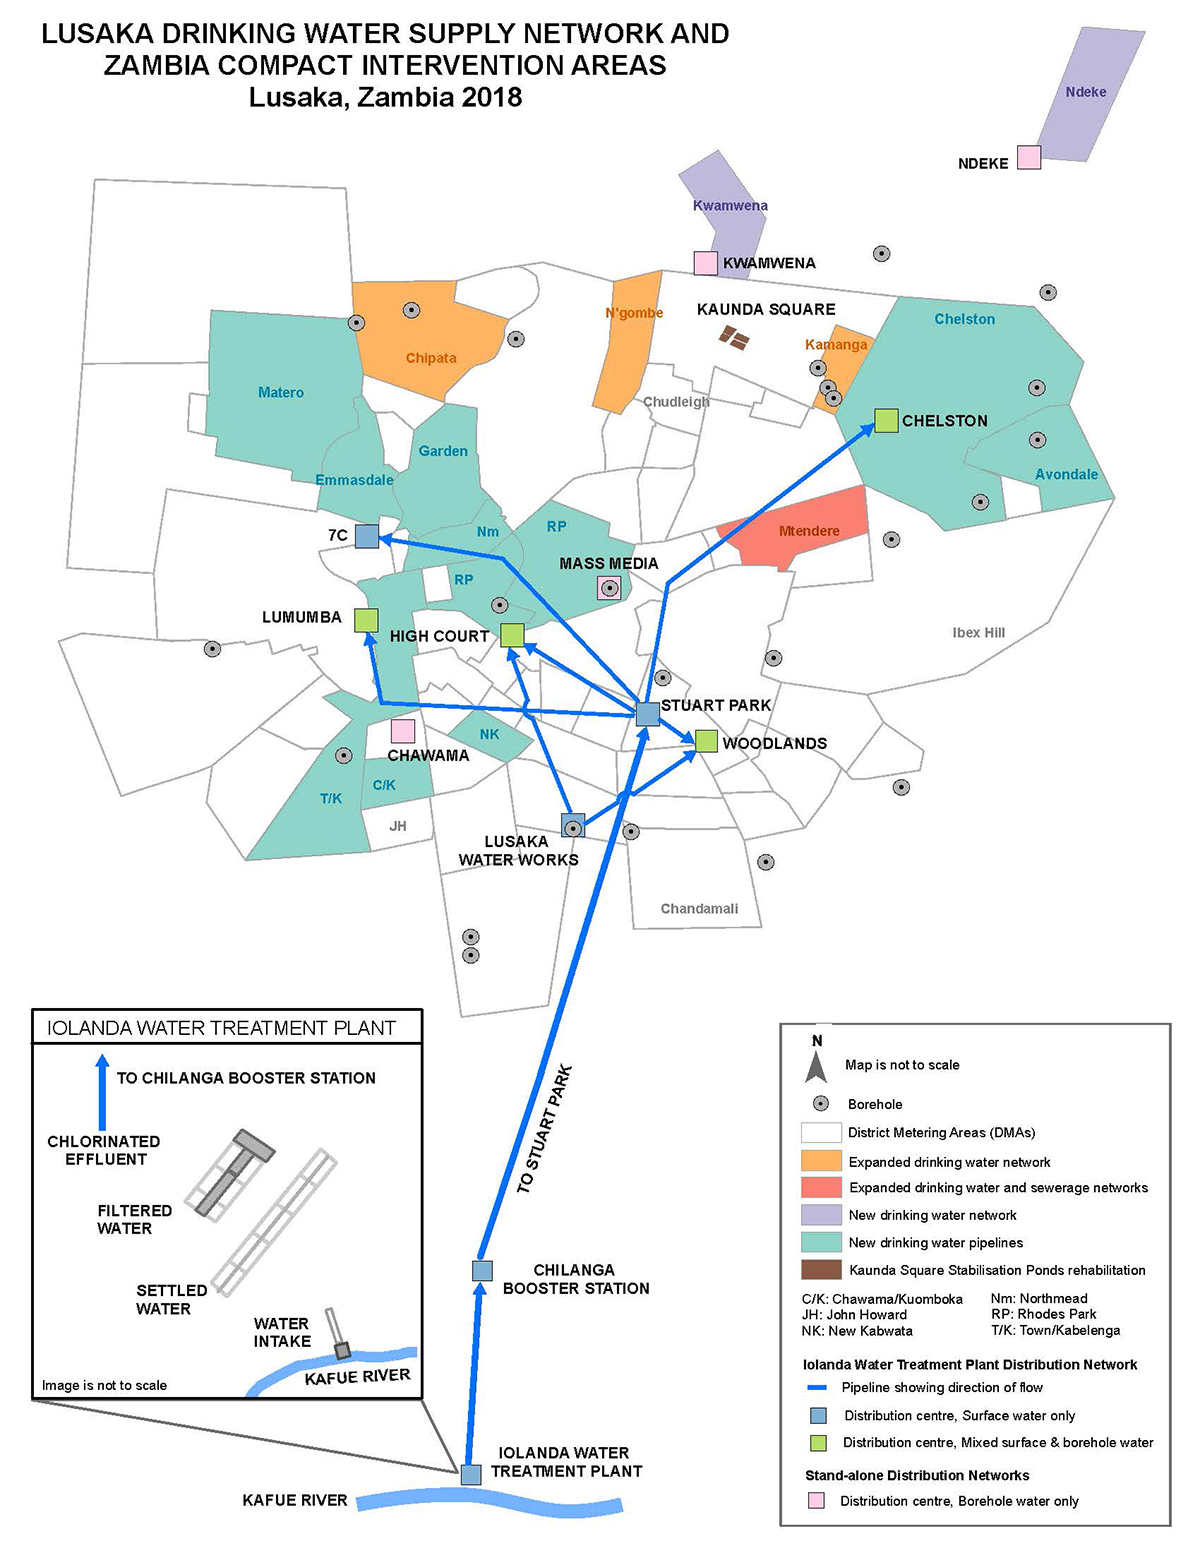
Securing a Safe Water Supply for Lusaka
As mentioned previously, the utility pumps groundwater from wells throughout the city, as well as surface water from the Kafue River about 30 miles to the southwest. The river water is intended to go through a standard treatment process at the Iolanda Water Treatment Plant, the final step of which is chlorination to kill pathogens and prevent waterborne disease. However, several critical components of the water treatment plant were not functional at the beginning of the compact. In contrast, the groundwater from wells throughout the city does not undergo this level of treatment; the groundwater is intended to be chlorinated at the well and then pumped directly into the city’s water distribution network. There are just over 125 boreholes in the city that supply water into the network. However, the boreholes do not all have functional or reliably stocked chlorine dispensers.
At the source, the Infrastructure Activity invested in a major rehabilitation and upgrade of the Iolanda Water Treatment Plant. These efforts included replacing water intake structures and powerful pumps; restoring the tanks, valves, pipes, and filters where the water is treated; reestablishing effective chlorination; and generally addressing the degraded condition of the plant infrastructure. These efforts aimed to restore Iolanda to its originally designed capacity in terms of both the quantity of water it can treat and the quality of the resulting drinking water. Other source improvements included drilling and equipping several new borehole wells to pump groundwater into the city supply.
From the Iolanda plant, the treated drinking water is then pumped through a pipeline to distribution centers in Lusaka, where it is temporarily stored in large tanks before flowing out to customers through the distribution network. Refurbishing this critical pipeline was an important part of the Infrastructure Activity. By the compact’s close, these investments to the Iolanda plant and the pipe refurbishment were over 93 percent completed; the totality of the Iolanda works was more extensive than anticipated due to required structural changes discovered during the refurbishment process. As per the terms of the compact the Government was responsible for completing the remaining work, which was finished in March 2019.
Moving Water to the Consumer
From the large pipeline that transmits treated drinking water from Iolanda to Lusaka, the Infrastructure Activity turned its attention to the city’s distribution network. The distribution network is a maze of pipes, pumps, valves, reservoirs, and water towers that store treated drinking water and move it to water consumers throughout the city.
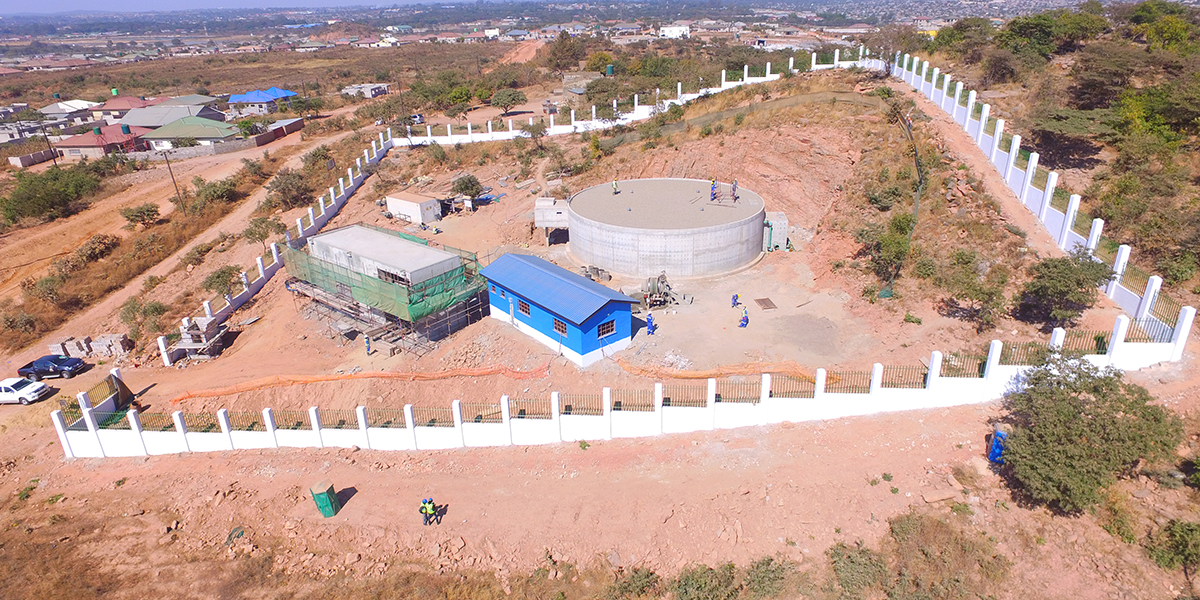
MCA-Zambia
An aerial view of the Kwamwena Reservior, rehabilitated as part of MCC’s Zambia Compact.
Compact-funded water supply investments included repair, replacement and/or installation of pipes that allow businesses and households in targeted areas throughout the city to connect to the water supply. The activity fixed leaks and breaks, and replaced degraded pipes and inefficient connections, all of which are key to reducing water losses that the utility can ill-afford. These physical losses of water cannot be billed, so they undermine utility revenues that could otherwise fund the operations, maintenance, and expansion of the water supply. In the context of a city where demand exceeds supply, it is important that every available drop be delivered, so activities also included training and supplies to help the utility conduct ongoing leak detection and repair.
Elsewhere in the distribution system, the project built and rehabilitated five reservoirs for storage of treated drinking water, upgraded pumps and valves that move the water through the city, and extended water supply pipes into previously unserved neighborhoods. The peri-urban areas expected to benefit from water distribution line investments include Chipata/SOS East, Ng’ombe, Mtendere, Kamanga, Ndeke/Vorna Valley, and Kwamwena. At the level where Lusaka residents gain household access to city water, the Infrastructure Activity laid smaller “lateral” connection pipes that branched off the water main and ran to individual properties to facilitate household-level connections for the first time.[[The compact did not fund private plumbing. Property owners had to cover the expense of installing any necessary pipes and hardware to connect their building with the new water pipes at their plot, as well as paying the utility’s water connection fees.]] In addition, the activity installed or rehabilitated community water kiosks where residents who lack a household connection can go to collect treated drinking water.
For a city water supply system to work efficiently, all water customers, from households to hospitals, need a metered connection to the water network so that the utility can monitor and bill for their water usage. Installing water meters for both residential and bulk (large-volume) water customers was another key aspect of efforts to help the utility reduce non-revenue water, in this case by making it possible to bill customers for their actual usage. Overall, non-revenue water reduction is also important for affordability, because losses (whether through leaks or unbilled water usage) ultimately translate to a higher cost of water per liter delivered to the consumer.
Of note, the poor performance and ultimate termination of one of MCA’s contractors caused significant delays in the construction of the water supply and sewer networks in the Mtendere community and the replacement of water pipes and household meters to reduce non-revenue water losses throughout the system. These sub-activities were approximately 30 percent complete by the compact’s end date. Recognizing the importance of completing the Mtendere network to protect city groundwater reserves in the area and improve community health, the Government re-procured the work through a different contractor and has committed to provide $28 million to complete all outstanding infrastructure works.
Sanitation Investments
To complement MCC’s investments in the water supply, the Infrastructure Activity also included major sanitation works to improve the collection, treatment, and disposal of waste. Adequate sanitation is essential to realizing the health benefits of water supply investments. Without appropriate control, treatment, and disposal of human waste, clean drinking water is not sufficient to prevent waterborne disease. Given the importance of groundwater to Lusaka’s water supply and the vulnerability of this groundwater to contamination, improved sanitation is of the utmost importance for the sustainability of the city’s water supply and the health and wellbeing of its residents.
At the start of the compact, an estimated 10 to 15 percent of Lusaka’s population had access to the municipal sewer network. Even areas with piped drinking water supply generally lacked sewer coverage. Most residents depended on on-site facilities like pit latrines and septic tanks, which are usually the responsibility of individual households to maintain. Furthermore, degradation of the existing sewer network—including blocked sewers, under-maintained pumping stations, and deteriorating sewage treatment facilities—limited the efficacy of sewage management.
To address problems with sewage collection, compact-funded construction focused on expanding selected “trunk” sewers that collect wastewater from the neighborhood service areas and move it to sewage treatment facilities. By installing larger-diameter sewer lines and extending them farther “upstream” into Lusaka neighborhoods, the upgraded sewer system is able to capture waste from a larger and previously unserved population. Elsewhere in the sewer network, the project upgraded existing sewage pumping stations, specifically the pump station at Salama Park and the pump station at Chelston, to prevent sewage from backing up in the system. The compact also expanded the sewer network in Mtendere to increase the number of individual household connections.[[As mentioned in the context of water connections, the compact did not fund private plumbing. This policy also applied to sewer connections. Property owners had to cover the expense of installing toilets, water closets, and any necessary pipes and hardware to connect their building with the new sewer line at their plot, as well as paying the utility’s sewerage connection fees. Through the Innovation Grant Program (see the Institutional Strengthening section, below), the compact did support the creation of a small revolving loan fund to help finance household connections to the sanitation network.]] Just as completion of the water supply network was delayed due to a contractor’s poor performance, the sanitation network expansion also experienced delays from the same contractor (whose contract was ultimately terminated). As of February 2020, the Millennium Project Completion Agency (MCA-Zambia’s successor entity), with financial support of the Government of Zambia, had achieved completion of the water network expansion in Mtendere, but the sewer network continued to be under construction.
Collecting sewage is only the first step; sewage must also be treated and disposed of properly. The project therefore invested in upgrading and expanding the wastewater treatment ponds at a key spot in the city, as well as replacing the flow-control devices that direct sewage into this particular treatment area. The Kaunda Square Sanitation Ponds—constructed in 1970 in what was then a remote part of Lusaka—were originally intended to provide waste stabilization (oxidation) sewage treatment for a population of less than 18,000, treating no more than 3,600 m3/day of sewage. Since 1970, Lusaka’s local government had neither expanded nor conducted major maintenance to the ponds, resulting in an overload of the ponds, collapse of the embankments separating the three treatment units, malfunctioning of the inlet works, and accumulated silt. By 2010, sewage flow to the ponds had increased to as much as 5,800 m3/day, well in excess of their capacity. These conditions rendered the ponds ineffective in treating sewage. After the upgrade funded by the compact, the Kaunda Square ponds could treat up to 41,000 m3/day—more than 8 times the original design—enough to serve the estimated 156,000 residents whose sewage would pass through them in 2015. The Sanitation Investment Master Plan calls for the construction of a new sewage treatment plant that will replace Kaunda Square and several other pond systems by 2035. MCC’s investment in Kaunda Square was therefore an important bridging measure to cover acute sanitation needs.[[After the new sewage treatment plan comes online, it is expected that Kaunda Square will provide additional treatment capacity for heavy flows during the wet season.]] The rehabilitation of these ponds was important because they will receive sewage from the informal, peri-urban neighborhood of Mtendere, where the Infrastructure Activity aimed to get 7,500 households connected to a newly expanded sewer network.
In addition to building wastewater networks, the compact faced the challenge of ensuring that households construct toilet facilities on their properties and connect to the networks. A shift from pit latrines to sewer connections was part of the Sanitation Investment Master Plan; however, many households cannot afford to connect to the sewer system or build flush toilets. In 2015, the subsidized cost of a sanitation connection in unplanned areas was approximately $200, while the cost of a water connection ranged from $100 to $500. The cost of constructing a toilet and water closet structure[[In Lusaka, especially in the peri-urban areas, the toilet is often installed in a small outbuilding constructed for the purpose. Unless the toilet uses pour-flush, a water connection is necessary. In peri-urban areas that never had water or sewer lines before the compact, households required both water and sewer connection fees at the same time.]] during the project timeframe was estimated at approximately $600, with high and lower estimates depending on the exact model. These are significant expenses in Zambia, where 42 percent of property owners have a household income of less than $200 per month.[[These figures were calculated through compact-funded studies.]] To address this gap, the compact required the GOZ to develop a Sanitation Connection Action Plan (SCAP) and contribute $1.6 million of GOZ funding to make it easier for poor households to construct toilet facilities and afford sanitation connections to the sewer networks constructed under the Infrastructure Activity. This GOZ plan also included support for sanitation marketing and outreach, financing incentives for both the general population as well as the poorest households, engagement with LCC to enforce the Public Health Act,[[The Public Health Act prohibits pit latrines and septic tanks within 200 feet of a sewer line. Residents must therefore connect to the sewer line.]] and support for LWSC to ensure that the utility would be able to connect households in a timely manner.
Service affordability challenges in Mtendere and other peri-urban areas posed a significant risk to the objectives of the compact: low rates of connection, high water bills, payment arrears, and risk of disconnections would undermine the realization and sustainability of benefits from compact-funded infrastructure. These considerations drove key linkages between the Infrastructure Activity and the Institutional Strengthening Activity (discussed below). In particular, the social inclusion and gender mainstreaming assistance aimed to develop new approaches for LWSC that would make connections and payment for services easier for lower-income customers. At the same time, information, education, and communication (IEC) and sanitation marketing campaigns took information out to the communities in the SCAP footprint about connecting, building toilets, managing water and bills, and hygiene. The details of these critical complementary efforts are discussed below.
To support the GOZ in implementing the SCAP, MCA led its overall execution in close coordination with LCC and LWSC. MCA commenced IEC and sanitation marketing in Mtendere in 2016, and LWSC’s office in Mtendere was expanded to enable the utility to connect households to the network and to LWSC’s billing system once residents had constructed toilets. Through the broader Innovation Grants Program as part of the Institutional Strengthening Activity (see below), a grant was awarded to an organization that established a revolving loan fund to make toilets more affordable for approximately 800 households initially. But ultimately, the poor performance of a construction contractor caused infrastructure timelines to shift, thus delaying the opportunity for households to hook into the system and for the grant to be executed. Community fatigue began to set in, and MCA and LWSC were obliged to adapt their messaging, which included introducing a replacement contractor. Overall, implementation of the SCAP required more engagement and support from both MCC and MCA than originally anticipated. MCA has laid the groundwork with LWSC to continue implementing the SCAP post-compact utilizing existing government financing.
Drainage Investments
Finally, the Infrastructure Activity included investments in Lusaka’s drainage system. The extensive flooding that some areas of Lusaka commonly experience during the rainy season causes property damage, disrupts access to social services, negatively impacts businesses, increases the risk of disease and can even bring loss of life. Although effects are concentrated in the peri-urban areas, not even the Central Business District is spared from flooding.
Most of the city’s drainage systems were inadequate at the time of compact development. Existing drains—which took the form of large open ditches—were frequently undersized, or they passed through culverts that were too small to accommodate peak flows. Insufficient drain maintenance combined with dysfunctional solid waste management led to extensive blockages by accumulated trash and heavy siltation (where eroded soil accumulates in the drainage channel after a storm). In many peri-urban areas, the drainage system was non-existent.
To address drainage issues and reduce flooding during the rainy season, the compact invested in major infrastructure improvements to the drainage system in Lusaka. Large, reinforced concrete-lined drainage channels were installed to collect and control rainfall runoff from the majority of the downtown business district areas of Lusaka and direct it to the nearby Ngwerere River. These drains had flow-control and trash trap structures designed to address some of the local blockage challenges.[[After one year with one of two planned trash traps in place, it became clear that LCC was not yet able to manage the operation of trash traps of this design. Rather than installing the second trash trap (of the same design, intended to work in concert with the first one to improve the environmental performance of the drainage system), the first trash trap was removed and the materials placed in storage. LCC will install both traps when they are prepared to manage them. The operationalization of an autonomous solid waste management company (discussed in the Assistance to Lusaka City Council subsection, below) is expected to reduce the trash load, which should make it easier for LCC to operate and maintain the trash traps.]] By the compact’s close, the drainage investments were over 95 percent completed; the Government was responsible for completing the remaining work.[[The drainage works were not fully completed due to performance problems with the contractor, which had significant cash flow problems and filed for protection from creditors in December 2018.]] The status of the drainage investments as of the end of August 2019 was close to 98 percent complete; however, in May 2019, due to their own cash flow challenges, the contractor abandoned works. Subsequently, MPCA terminated their contract. As of February 2020, MPCA had procured another contractor to complete the remaining two percent of the drainage system works. The new contractor has started work with anticipated completion by July 2020. It is estimated that the improvement to the drainage system will benefit nearly 190,000 people in Lusaka. Complementary institutional strengthening investments—discussed below—also addressed drain maintenance and solid waste management issues.
Key output and outcome indicators (from the Indicator Tracking Table)
| Key Performance Indicators | Baseline | End of Compact Target | Closeout Value | Percent Compact Target Satisfied |
| Core Water Supply and Network Rehabilitation, and Key Utility Performance Indicators | ||||
| Length of transmission lines constructed/ rehabilitated (km)[[Total length of transmission lines constructed and rehabilitated. This indicator is tied to strengthening Water Supply.]] | 0 | 62 | 76 | 123% |
| Total length of pipes replaced (km) | 0 | 195 | 84 | 43% |
| Number of water meters installed/replaced | 0 | 56,000 | 15,458 | 28% |
| Metering ratio* (%)[[Total number of connections with operating meter/ total number of connections, expressed in percentage]] | 68 | 90 | 66 | 0% |
| Non-revenue water* (NRW) (%) | 57 | 34 | 45[[In year four of compact implementation, after works were underway, consultants used billing and system input data from LWSC to estimate the total baseline NRW at 56.8 percent. In the same analysis, it was estimated that the total NRW could be reduced to 41.3 percent by the end of the project, suggesting that the original target of 34 percent may have been overly ambitious.]] | 52% |
| Volume of water produced* (million cubic meters)[[This indicator includes estimates total quarterly water production from the Iolanda water treatment plant (40% production) and the 120+ boreholes around Lusaka (60% production). The indicator is also reported on by LWSC and per the data quality review this indicator is estimated because there are no bulk water meters at Iolanda or at most boreholes.]] | 23.09 | 24.63 | 18.85 | -274%[[A negative completion rate requires some explanation. The compact sought to increase water produced from 23.09 million cubic meters per quarter to 24.63 million cubic meters per quarter, an increase of 1.54 million cubic meters. However, water production at compact close sat at 18.85 million cubic meters, a decrease of 4.24 million cubic meters compared to the baseline. Dividing the actual decrease (-4.24) by the targeted increase (1.54) and converting to percent generates a completion rate of -274 percent. ]] |
| Continuity of Service* (Hours per day)[[This indicator is reported by LWSC on a quarterly basis and has fluctuated throughout the compact. It is an average for all districts of Lusaka; the number of hours of water supply can vary dramatically by neighborhood and due to inconsistent availability of electricity (e.g., load shedding during the dry season) affects the continuity of service, but no data are available on the frequency and duration of power outages at baseline or over the course of the compact, so their impact on the performance measured by this indicator is unknown.]] | 18 | 22 | 17 | -25%[[A negative completion rate requires some explanation. The compact sought to increase the city-wide average availability of water service by 4 hours daily, from 18 to 22 hours per day. However, water service stood at 17 hours per day at compact close, a decrease of 1 hour daily. Dividing the actual decrease (-1) by the targeted increase (4) and converting to percent yields a completion rate of -25 percent.]] |
| Expansion of Piped Water Supply to New Customers in Peri-Urban Areas | ||||
| Length of water distribution network constructed (km) | 0 | 325 | 242 | 72% |
| Number of new connections (Water)[[Total number of new water supply connections in the project area. These are household connections and do not include kiosk connections. This indicator is a subset of Meters installed/replaced and should not be aggregated up for reporting]] | 0 | 27,000 | 8,637 | 32% |
| Number of water kiosks constructed | 0 | 37 | 35 | 95% |
| Expansion of Sewerage Services to New Customers in Peri-Urban Areas | ||||
| Length of mains constructed (Primary) (km) | 0 | 2.2 | 2.4 | 109% |
| Total length of interceptors constructed (Secondary) (km) | 0 | 3.1 | 0.9 | 28% |
| Total Length of sewer pipes constructed (Tertiary) (km) | 0 | 82 | 0 | 0% |
| Number of new connections (sewerage) | 0 | 7,520 | 0 | 0% |
| Wastewater treatment measured by Biological Oxygen Demand (BOD) (mg/L) | 91 | 40 | 33 | 114% |
| Drainage Backbone Infrastructure Investments | ||||
| Length of drains constructed / rehabilitated (km) |
0 | 27.5[[The target should have been revised to reflect rescoping early in the compact, reflecting that the work was completed. However, the erroneous target cannot now be retroactively corrected due to internal policy for transparency and accountability.]] | 23.4 | 85%[[The drainage works were not fully completed due to performance problems with the contractor, which had significant cash flow problems and filed for protection from creditors in December 2018.]] |
Explanation of Results
Indicators used to measure the performance of the Infrastructure Activity may be grouped into four categories.
(i) Core Water Supply and Network Rehabilitation
The indicators in this category reflect the rehabilitation of the Iolanda water treatment plant and the refurbishment of water transmission pipes from the Iolanda plant to centrally located water distribution centers and reservoirs within Lusaka, as well as upgrading reservoirs and reducing non-revenue water. (See the section Securing a Safe Water Supply for Lusaka, above.)
Compact investments made a small improvement in the capacity of the Iolanda water treatment plant (by an estimated 1.5 million cubic meters per quarter, a 6 percent increase from baseline), representing a small fraction of the total water supply estimated in the indicator Volume of water produced. That improvement may have been offset by changes in water production from LWSC borehole wells, as well as by poor data quality. Regardless of capacity, there is significant seasonal variation in water production, in part due to the inconsistent availability of electricity (e.g., rolling blackouts during the dry season when electricity production can’t always meet demand). It is possible that these seasonal and data quality issues contributed to an artificially high baseline against which compact achievements are measured. Note that the Iolanda treatment plant rehabilitation and reservoir upgrades were not tracked through formal indicators, and are therefore not reflected in the table above.
As tracked by the indicator Length of transmission lines constructed/rehabilitated, compact investments built or improved 76 km of water pipes that move water to key nodes in the system (e.g., from Iolanda to Lusaka, or from a pumping station to a reservoir). The original target was surpassed because the scope of compact works was expanded to include an additional neighborhood, and to connect relocated borehole wells to a key reservoir.
Reducing non-revenue water (NRW) is critical to improving utility function and subsequent service delivery to customers. The indicator Length of pipes replaced measures progress on work to reduce the physical water loss component of non-revenue water by replacing pipes in 35 District Metering Areas in Lusaka. This work suffered due to the under-performance and ultimate termination of a works contractor: low completion of the target is attributed to poor execution by the problematic contractor.
However, physical water losses are only half the story; commercial losses also contribute to non-revenue water. To reduce commercial non-revenue water, the compact included efforts to make volumetric billing of customers’ water usage more accurate, as well as an intensive cleanup and update of the utility’s customer database. Fifty-six thousand water meters were purchased but, due to delays from the under-performing works contractor, only 15,458 of them were installed (as measured by the indicator Number of water meters installed/replaced). A subset of the meters installed were for new customers receiving piped water for the first time (measured through the indicator Number of new connections – Water). The Metering ratio indicator measures the number of metered customers in the utility’s billing database divided by the total number of customers. Information received from contractor progress reports at compact closure demonstrates that approximately 16,500 previously un-recorded customers were added to the utility database and properly registered as billable accounts. Although these customers had previously been accessing water services for free, a substantial fraction had unmetered connections (and were not converted to metered conections during the compact). Adding them to the database—a clear business improvement— thus increased the denominator in this indicator and lowered the metering ratio. The effect of the customer database update on the utility’s revenue has yet to be independently verified. The underperforming contractor further affected the Metering ratio results, because the low meter installation numbers are reflected in the numerator of the ratio. Additionally, some of the contractor’s efforts went towards replacing existing meters with new ones rather than adding meters to unmetered connections. Together, these factors explain why the metering ratio decreased from the baseline rather than increasing towards the target.
The above-mentioned measures of compact investments in physical and commercial non-revenue water reduction do not paint an optimistic picture of the utility’s overall NRW reduction during the compact. LWSC reported 52 percent achievement for the Non-revenue water indicator: over the course of the compact, NRW fell only about half as much as expected. Although data quality remains an issue for this indicator, LWSC did use the same approach for calculating NRW both at baseline and at compact-end, thus avoiding methodological inconsistencies. The observed improvement in NRW may be attributed to the technical assistance provided to LWSC in updating the customer database (reduction of commercial losses). The target was not met because the physical NRW reduction was not completed due to termination of a poorly performing contractor.
All compact investments were ultimately aimed at improving service delivery. LWSC provides intermittent water supply to its customers, which is reflected in the Continuity of service indicator. The reported value is an average across all districts of Lusaka, and is calculated by LWSC on a quarterly basis. The city-wide average was 18 hours of water service per day at baseline, but some neighborhoods had as little as 4 hours of service daily, while others had continuous 24-hour service. The indicator was intended to capture how reduction in physical losses would be expected to increase the available water supply and therefore lengthen service hours. However, as described above, other factors including the under-performance of a works contractor hampered physical NRW reductions. Furthermore, compact investments to connect new neighborhoods (without a corresponding increase in the available water supply) would be expected to decrease the average daily hours of supply city-wide. Finally, inconsistent availability of electricity (e.g., load shedding during the dry season) affects the continuity of service, but no data are available on the frequency and duration of power outages at baseline or over the course of the compact, so their impact on the performance measured by this indicator is unknown.
(ii) Expansion of Piped Water Supply to New Customers in Peri-Urban Areas
Compact investments aimed to bring piped water to new customers in peri-urban areas who had never had a household connection before. The indicator Length of water distribution network constructed tracks the water pipes that move water to customers in three peri-urban areas: Mtendere (93 km), and Kwamwena and Ndeke/Vorna Valley (242 km). Progress on work in Mtendere was reported by the underperforming works contractor that was subsequently terminated, and there are early indications that the pipes laid by that contractor may need to be redone. Therefore, no work from Mtendere is being counted towards the completion of the target. Furthermore, the incomplete work meant that residents of Mtendere could not be connected to the piped water supply before the end of the compact. The indicator Number of new connections (Water) includes 8,637 new metered connections in Ndeke Vona Valley, Kwamwena, Ng’ombe, Chipata and SOS East Village (32 percent of target).
New water kiosks were constructed and are reported via the indicator Number of water kiosks constructed. The definition of the indicator does not expect the kiosks to be operational and progress on the operability front was mixed as of April 2019. Two kiosks were descoped in Chiapata compound. One of these kiosks had been planned to be in a market, but the market holders did not want it. The other was to be located on private property, but the owner rescinded permission to build on the land. These two kiosks were never officially removed from activity planning documents, so the target was not revised down from 37 to 35.
(iii) Expansion of Sewerage Services to New Customers in Peri-Urban Areas
An existing facility for sewage treatment (Kaunda Square Ponds) was rehabilitated as part of compact investments. Sewage treatment efficacy is measured by the indicator Biological Oxygen Demand (BOD). Measuring this water quality indicator at the outlet of the wastewater treatment ponds reveals how well the sewage has been treated, thus indicating whether the ponds are functioning properly. The ponds were completed and appear to be operating appropriately as of compact closure, resulting in the wastewater treatment parameter exceeding the target.
As described in earlier sections, piped sewer coverage in Lusaka is low. Three indicators track the completion of the sewers that bring waste from individual homes to the Kaunda Square treatment ponds. The indicator Length of mains constructed (Primary) tracks the completion of main sewers feeding into the wastewater treatment ponds at Kaunda Square. These are the only sewers that the contractor reported complete. The smaller interceptor sewers that flow into the main sewers (tracked by Total length of interceptors constructed (Secondary)) and the tertiary sewers that directly serve households in the Mtendere neighborhood (tracked by Total Length of sewer pipes constructed (Tertiary)) were the responsibility of the underperforming contractor that was ultimately terminated. The underperforming contractor reported that they had completed 75 km of tertiary sewers in Mtendere, but there are early indications that many portions may need to be redone. Therefore, no work from Mtendere is being counted, leading to zero percent completion of targets. Residents of Mtendere did not have any new sewer connections as of the end of the compact (tracked by Number of new connections (sewerage)).
(iv) Drainage Backbone Infrastructure Investments
As described by the indicator Length of drains constructed/rehabilitated, the drainage channels were completed as planned. Due to an official rescoping, the drain was reduced in length. However, the target was not changed.