

Compact Amounts at Signing*
| Partner Country | Compact Amount (in millions) | Signed | Entry Into Force | Closed |
|---|---|---|---|---|
| Madagascar | $109.8 | 4/18/2005 | 7/27/2005 | 8/31/2009 |
| Honduras | $215.0 | 6/14/2005 | 9/30/2005 | 9/30/2010 |
| Cabo Verde | $110.1 | 7/5/2005 | 10/18/2005 | 10/17/2010 |
| Nicaragua | $175.0 | 7/15/2005 | 5/26/2006 | 5/26/2011 |
| Georgia | $395.3 | 9/12/2005 | 4/7/2006 | 4/7/2011 |
| Benin | $307.3 | 2/22/2006 | 10/6/2006 | 10/6/2011 |
| Vanuatu | $65.7 | 3/2/2006 | 4/28/2006 | 4/28/2011 |
| Armenia | $235.7 | 3/27/2006 | 9/29/2006 | 9/29/2011 |
| Ghana | $547.0 | 8/1/2006 | 2/16/2007 | 2/16/2012 |
| Mali | $460.8 | 11/13/2006 | 9/18/2007 | 8/24/2012 |
| El Salvador | $460.9 | 11/29/2006 | 9/20/2007 | 9/20/2012 |
| Mozambique | $506.9 | 7/13/2007 | 9/22/2008 | 9/22/2013 |
| Lesotho | $362.6 | 7/23/2007 | 9/17/2008 | 9/17/2013 |
| Morocco | $697.5 | 8/31/2007 | 9/15/2008 | 9/15/2013 |
| Mongolia | $284.9 | 10/22/2007 | 9/17/2008 | 9/17/2013 |
| Tanzania | $698.1 | 2/17/2008 | 9/17/2008 | 9/17/2013 |
| Burkina Faso | $480.9 | 7/14/2008 | 7/31/2009 | 7/31/2014 |
| Namibia | $304.5 | 7/28/2008 | 9/16/2009 | 9/16/2014 |
| Senegal | $540.0 | 9/16/2009 | 9/23/2010 | 9/23/2015 |
| Moldova | $262.0 | 1/22/2010 | 9/1/2010 | 9/1/2015 |
| Philippines | $433.9 | 9/23/2010 | 05/25/11 | 5/25/2016 |
| Jordan | $275.1 | 10/25/2010 | 12/13/11 | 12/13/2016 |
| Cabo Verde II | $66.2 | 2/10/2012 | 11/30/2012 | 11/30/2017 |
| Indonesia | $600.0 | 11/19/2011 | 4/2/2013 | 4/2/2018 |
| Malawi | $350.7 | 4/7/2011 | 9/20/2013 | |
| Zambia | $354.8 | 5/10/2012 | 11/15/2013 | |
| Georgia II | $140.0 | 7/26/2013 | 7/1/2014 | |
| Ghana II | $498.2 | 8/5/2014 | 9/6/2016 | |
| El Salvador II | $277.0 | 9/30/2014 | 9/9/2015 | |
| Benin II | $375.0 | 9/9/2015 | 6/22/2017 | |
| Liberia | $256.7 | 10/2/2015 | 1/20/2016 | |
| Morocco II | $450.0 | 11/30/2015 | 6/30/2017 | |
| Niger | $437.0 | 7/29/2016 | 01/26/18 | |
| Nepal | $500.0 | 9/14/2017 | ||
| Côte d'Ivoire | $524.7 | 11/07/17 | ||
| Mongolia | $350.0 | 7/27/2018 | ||
| Senegal II | $550.0 | 12/10/2018 |
Compact Commitments, Obligations, and Plan
As of First Quarter FY 2019
|
|||||||||||||||||||||||||||||||||||||||||||||||||||||||||||||||||||||||||||||||||||||||||||||||||||||||||||||||||||||||||||||||||||||||||||||||||||||||||||||||||||||||||||||||||||||||||||||||||||
|
|||||||||||||||||||||||||||||||||||||||||||||||||||||||||||||||||||||||||||||||||||||||||||||||||||||||||||||||||||||||||||||||||||||||||||||||||||||||||||||||||||||||||||||||||||||||||||||||||||
| TOTAL | $9,600 | $670 | $684 | $683 | $699 | $634 | $700 | $632 | $529 | $14,831 | |||||||||||||||||||||||||||||||||||||||||||||||||||||||||||||||||||||||||||||||||||||||||||||||||||||||||||||||||||||||||||||||||||||||||||||||||||||||||||||||||||||||||||||||||||||||||
Closed Compacts
As of First Quarter FY 2019| Country/Description | Fiscal Year of appropriation | Total | ||||||||
|---|---|---|---|---|---|---|---|---|---|---|
| 2004 | 2005 | 2006 | 2007 | 2008 | 2009 | 2010 | 2011 | 2012 | ||
| Armenia | - | $177 | - | - | - | - | - | - | - | $177 |
| Benin | 0 | $302 | - | - | - | - | - | - | - | $302 |
| Burkina Faso | - | - | - | - | $475 | - | - | - | - | $475 |
| Cabo Verde I | $109 | - | - | - | - | - | - | - | - | $109 |
| Cabo Verde II | - | - | - | - | - | - | - | - | $66 | $66 |
| El Salvador | - | - | $362 | $88 | - | - | - | - | - | $450 |
| Georgia | $290 | $24 | - | $17 | $56 | - | - | - | - | $387 |
| Honduras | $204 | - | - | - | - | - | - | - | - | $204 |
| Indonesia | - | $50 | - | - | - | - | - | $477 | - | $526 |
| Jordan | - | - | - | - | - | $55 | $218 | - | - | $273 |
| Lesotho | - | - | - | $358 | - | - | - | - | - | $358 |
| Madagascar | $86 | - | - | - | - | - | - | - | - | $86 |
| Mali | - | - | $434 | - | - | - | - | - | - | $434 |
| Moldova | $90 | $16 | $8 | $1 | $9 | $86 | $49 | - | - | $259 |
| Mongolia | - | - | - | $269 | - | - | - | - | - | $269 |
| Morocco | - | $72 | $578 | - | - | - | - | - | - | $650 |
| Mozambique | - | - | - | $448 | - | - | - | - | - | $448 |
| Namibia | - | - | - | $219 | $76 | - | - | - | - | $296 |
| Nicaragua | $113 | - | - | - | - | - | - | - | - | $113 |
| Philippines | - | - | - | - | - | - | $385 | - | - | $385 |
| Senegal | - | - | - | - | - | $433 | - | - | - | $433 |
| Tanzania | - | - | - | - | $695 | - | - | - | - | $695 |
| Vanuatu | - | $65 | - | - | - | - | - | - | - | $65 |
| Closed Compacts | $891 | $1,243 | $1,383 | $1,400 | $1,310 | $574 | $652 | $477 | $66 | $7,995 |
Threshold Program Amounts at Signing*
| Country | Threshold Program Amount (in millions) | Signed | Closed |
|---|---|---|---|
| Burkina Faso | $12.9 | 7/22/2005 | 9/30/2008 |
| Malawi | $20.9 | 9/29/2005 | 9/30/2008 |
| Albania | $13.9 | 4/3/2006 | 11/15/2008 |
| Tanzania | $11.2 | 5/3/2006 | 12/30/2008 |
| Paraguay | $34.6 | 5/8/2006 | 8/31/2009 |
| Zambia | $22.7 | 5/22/2006 | 2/28/2009 |
| Philippines | $20.7 | 7/26/2006 | 5/29/2009 |
| Jordan | $25.0 | 10/17/2006 | 8/29/2009 |
| Indonesia | $55.0 | 11/17/2006 | 12/31/2010 |
| Ukraine | $45.0 | 12/4/2006 | 12/31/2009 |
| Moldova | $24.7 | 12/15/2006 | 2/28/2010 |
| Kenya | $12.7 | 3/23/2007 | 12/31/2010 |
| Uganda | $10.4 | 3/29/2007 | 12/31/2009 |
| Guyana | $6.7 | 8/23/2007 | 2/23/2010 |
| São Tomé & Principe | $8.7 | 11/9/2007 | 4/15/2011 |
| Kyrgyz Republic | $16.0 | 3/14/2008 | 6/30/2010 |
| Niger | $23.1 | 3/17/2008 | 12/31/2015 |
| Peru | $35.6 | 6/9/2008 | 9/30/2012 |
| Rwanda | $24.7 | 9/24/2008 | 12/31/2011 |
| Albania | $15.7 | 9/29/2008 | 7/31/2011 |
| Paraguay | $30.3 | 4/13/2009 | 7/31/2012 |
| Liberia | $15.1 | 7/6/2010 | 12/15/2013 |
| Timor-Leste | $10.5 | 9/22/2010 | 3/31/2014 |
| Honduras | $15.7 | 8/28/2013 | |
| Guatemala | $28.0 | 4/8/2015 | |
| Sierra Leone | $44.4 | 11/17/2015 | |
| Kosovo | $49.0 | 9/12/2017 | |
| Togo | $35.0 | 2/14/2019 |
Results of Recently-Closed Compacts
Indonesia
| Overview | MCC's Compact Indonesia successfully closed on April 2, 2018. The Compact cumulatively disbursed approximately $474 million (79% of $600 million Compact total) and achieved a number of important successes. Notably, the Community-Based Health and Nutrition Project changed the national conversation around stunting and elevated anti-stunting efforts to a national priority. The Procurement Modernization Project achieved or exceeded many output level targets, ultimately trained over 1,000 individuals on the appropriate skills, systems, processes, and operating standards to reduce costs and achieve efficiency and greater transparency in procurement. Among the trained professionals, 24% are women who continue to build their career in this profession. The Green Prosperity Project achieved 73% of its revised multi-year financial plan and leveraged roughly $38 million in private sector and other outside financing. MCC and the Government of Indonesia are continuing to work together on post-compact reporting and sustainability measures. |
|---|---|
| Policy Reforms | The Indonesia compact achieved sector policy reforms through its Procurement Modernization and Green Prosperity projects.
|
| Outputs | Green Prosperity Project
|
| Preliminary and Expected Outcomes | Green Prosperity Project
The Participatory Land Use Planning Activity expects to improve local capacity for administrative boundary setting, updating and integration of land use inventories, and enhancing spatial plans at the district and provincial levels. Technical Assistance and Oversight Activity expect to improved quality and design of renewable energy and natural resources management projects. Green Prosperity Facility Activity expects to increase investment in renewable energy and natural resources management, increased productivity, and reduced GHG emissions. The Green Knowledge Activity expects to improve local, provincial, and national capacity to drive forward Indonesia’s national low carbon development strategy within the context of the GP Project. Community-Based-Health and Nutrition Project The Community Projects Activity expects to improve health and education outcomes, including nutrition. The Supply-side activity expects to improve the ability of health service providers to prevent, diagnose, and treat stunting; improved nutrition of pregnant women and infants; improved sanitation behavior; and reduced incidence of diarrhea. The Communications activity plans to increase awareness about stunting. Procurement Modernization Project The Procurement Professionalization activity expects to improve procurement capacity and function of procurement service units and related spending units. The Policy and procedure activity expects to increase the rate and success of PPPs and improved environmental sustainability of government procurements |
| Evaluations | Procurement Modernization Project
The impact evaluation/pre-post mixed methods design will answer whether there were changes to the shared culture and values; structure, leadership, and management; systems, including policies, procedures, and processes; skills and knowledge; and staffing of the PSUs as a result of the project. Community-Based-Health and Nutrition Project The impact evaluation will measure the project’s impact on child and maternal health outcomes (including stunting), behavioral practices related to nutrition and sanitation, and receipt of health services. The key findings of the interim evaluation of the Nutrition Project include:
Green Prosperity: Participatory Land Use Planning (PLUP) This performance evaluation measure the program’s effect on spatial certainty, land disputes, transparency in land governance administration, and management of natural resources. Interim evaluation findings indicated the following:
This performance evolution and quality of the design and implementation of the GPF. The evaluation focused solely on the implementation phase and did not assess the results of the grants funded by the GPF; some grant results are assessed by other evaluations. The key findings of this evaluation include:
This impact evaluation will assess the impacts of the new provision of grid electricity to households and businesses in remote areas. Green Prosperity: Cocoa Grant Portfolio A performance evaluation designed to assess the efficacy of training approaches, the validity of the theory of change, sustainability, and lessons learned. Cocoa Interim Evaluation key findings include:
This performance evaluation will assess the effectiveness and sustainability of the GPF’s grants regarding peatland rewetting. Green Prosperity: Social Forestry Grant Portfolio This performance evaluation will consist of an Evaluability Assessment to investigate whether grants categorized as social forestry were truly designed around and applied a common theory of change related to agro-forestry and the sustainable management of forest lands. Green Prosperity: On Grid Renewable Energy Grant Portfolio This performance evaluation will assess the sustainability of the GPF’s on-grid infrastructure grants in terms of continued power sales to the national utility and benefit sharing with communities surrounding the generation sites. Specifically, the four evaluation questions concern:
|
Malawi
| Overview | The Malawi Power Compact successfully closed on September 20, 2018. In 2013, MCC partnered with Malawi—a land-locked nation in southeastern Africa, one of the world’s poorest—to implement a US $350.7 million compact focused on the power sector, designed to reduce poverty through economic growth. The compact took a comprehensive approach to strengthening the nation’s power sector, providing funding for infrastructure, policy reform and environmental management. The compact modernized the power grid, transmission backbone, and hydropower generation to move power reliably throughout the country, and supported reforms to create a more sustainable power sector that can attract private investment in power generation. Compact funding for the construction of substations and the upgraded grid will allow Malawi to connect to the South Africa Power Pool so it can trade electric power with its neighbors. Several U.S. companies, including General Electric, Cardno, Maryland-based Ellicott Dredges, and Wisconsin-based Aquarius all delivered elements of the compact. |
|---|---|
| Policy Reforms | Modernized and created an enabling environment for future expansion of Malawi’s power sector by strengthening institutions and enhancing regulation and governance of the sector.
|
| Outputs | Infrastructure Development Project
|
| Preliminary and Expected Outcomes |
|
| Evaluations | Infrastructure Development Project & Power Sector Reform Project
MCC has commissioned a rigorous, independent, performance evaluation of the Power Sector Reform Project. Midline data collection took place in November 2016 and was compared with data collected by the evaluation team in February and March 2015. Interim findings focused on the consultancies and their effectiveness, and highlighted lessons for policy and institutional reform projects, many of which are implemented through short term consultancies.
|
Zambia
| Overview | The Zambia Compact successfully closed on November 15, 2018. The Compact aimed to deliver expanded and rehabilitated water, sanitation and drainage infrastructure to 1.2 million people in the capital of Lusaka, including the establishment of a new solid waste management company to keep the new drains free of trash and debris. The compact’s reform activities are designed to improve service delivery provided by the Lusaka water utility and the Lusaka municipal government. New asset management, social and gender and peri-urban policies have been developed and are now in place. Seven infrastructure projects were largely completed and two will finish in 2019 with Government of Zambia funds. Vice President and General Counsel Jeanne Hauch visited Zambia in early November to showcase the compact’s achievements and meet with President Lungu. |
|---|---|
| Policy Reforms | The Zambia compact achieved many water and sanitation sector policy reforms.
|
| Outputs | Water, Sanitation and Drainage Infrastructure Activity
|
| Preliminary and Expected Outcomes | Water, Sanitation and Drainage Infrastructure Activity
Expects to decrease the incidence and prevalence of water-related disease through increased access to clean water and decreased incidence of flooding Institutional Strengthening Activity Expects to improve the financial sustainability, operations and maintenance, environmental management and social inclusion of LWSC (Lusaka Water Supply and Sewage Company), LCC (Lusaka City Council) and support Compact outcomes through the Innovation Grant Program. |
| Evaluations | Water, Sanitation and Drainage Infrastructure ActivityThis randomized impact evaluation is designed to measure impacts on water-related diseases and time savings for households and businesses, including the beneficiary populations in the peri-urban neighborhoods of Lusaka where water and sanitation networks have been extended for the first time.
Institutional Strengthening Activity An independent performance evaluation will assess the performance of the LWSSD project in contributing to the water, sanitation, and drainage sector sustainability through its effect on institutions (LWSC and LCC). This evaluation is expected to be completed by 2022. Innovation Grant Sub Activity This sub-activity is being evaluated separately to examine the overall performance of the IGP in relation to key programmatic and compact objectives, potential gaps or inefficiencies in IGP implementation, areas in which implementation can be improved, and positive aspects of the IGP that could potentially be expanded or replicated in other contexts. |
Estimating Compact Beneficiaries and Benefits
Under MCC‘s results framework, beneficiaries are defined as an individual and all members of his or her household who will experience an income gain as a result of MCC interventions. We consider that the entire household will benefit from the income gain and counts are multiplied by the average household size in the area or country. The beneficiary standard makes a distinction between individuals participating in a project and individuals expected to increase their income as a result of the project. Before signing a compact, MCC estimates the expected long-term income gains through a rigorous benefit-cost analysis. MCC may reassess and modify its beneficiary estimates and the present value of benefits when project designs change during implementation.| Compact | Estimated Number of Beneficiaries | Estimated Long Term Income Gain Over the Life of the Project (PV of Benefits)[[The Present Value (PV) of Benefits is the sum of all projected benefits accruing over the life of the project, typically 20 years, evaluated at a 10 percent discount rate. Estimates are reported in millions of U.S. dollars in the year that the ERR analysis was completed. Because the PV of benefits uses a discount rate, these figures cannot be compared directly to the undiscounted financial costs of MCC compacts, but must be compared to the PV of costs instead.]] | Estimated Net Benefits over the Life of the Project (Present Value)[[The Net Benefits column is new this year and will replace the Total Benefits column next year and thereafter. To accommodate the change, both the total and net benefit numbers are calculated from ERRs currently posted on the MCC website, meaning many of the numbers will be different from last year.]] |
|---|---|---|---|
| Armenia | 428,000 | $303,200,000 | $150,400,000 |
| Benin | 14,059,000 | $85,500,000 | N/A |
| Benin II | 1,969,000 | $276,400,000 | $24,800,000 |
| Burkina Faso | 1,181,000 | $131,500,000 | ($123,300,000) |
| Cape Verde I | 385,000 | $134,000,000 | $84,600,000 |
| Cape Verde II | 604,000 | $142,800,000 | $72,000,000 |
| El Salvador | 706,000 | $559,600,000 | $251,900,000 |
| El Salvador II | 6,446,000 | $224,500,000 | N/A |
| Georgia | 143,000 | $123,300,000 | $175,600,000 |
| Georgia II | 1,770,000 | $59,800,000 | $18,200,000 |
| Ghana | 1,217,000 | $979,500,000 | $520,400,000 |
| Honduras | 1,705,000 | $1,626,800,000 | $190,400,000 |
| Indonesia[[Indonesia entries are currently available for only one of three projects. Liberia entries are currently available only for the energy project. Benin II entries are unavailable for the off-grid clean energy facility.]] | 1,700,000 | $217,000,000 | N/A |
| Jordan | 3,000,000 | $398,900,000 | $71,300,000 |
| Lesotho | 1,041,000 | $701,700,000 | $84,700,000 |
| Liberia | 528,000 | $182,500,000 | $8,000,000 |
| Madagascar[[Two compacts have been terminated, Madagascar and Mali. Madagascar's estimates reflect the early termination while Mali's do not.]] | 480,000 | $123,200,000 | $46,800,000 |
| Malawi | 983,000 | $567,200,000 | $234,100,000 |
| Mali[[Two compacts have been terminated, Madagascar and Mali. Madagascar's estimates reflect the early termination while Mali's do not.]] | 2,837,000 | $299,100,000 | $136,300,000 |
| Moldova | 414,000 | $137,100,000 | $39,900,000 |
| Mongolia | 2,058,000 | $1,479,700,000 | $114,600,000 |
| Morocco | 1,695,000 | $1,139,300,000 | $617,000,000 |
| Mozambique | 2,685,000 | $314,200,000 | $120,900,000 |
| Namibia | 1,063,000 | $405,300,000 | $125,000,000 |
| Nicaragua | 119,000 | $83,500,000 | N/A |
| Niger | 3,888,000 | $486,200,000 | $238,700,000 |
| Philippines | 125,822,000 | $493,700,000 | $159,700,000 |
| Senegal | 1,550,000 | $279,600,000 | $110,600,000 |
| Tanzania | 5,425,000 | $1,230,700,000 | $776,300,000 |
| Vanuatu | 39,000 | $73,800,000 | N/A |
| Zambia | 1,200,000 | $306,600,000 | $62,200,000 |
| Total for All Compacts[[Column totals may not equal the sum of the individual rows due to rounding.]] | 187,138,000 | $13,566,200,000 |
Post Compact Economic Rates of Return
All MCC projects are independently evaluated, and these independent evaluations often include evaluation-based ERRs. Independently calculated ERRs complement the closeout ERRs that MCC calculates at the end of the compact. Because independent evaluations occur two to five years after compact closure, evaluation-based ERRs offer an updated assessment of a project’s costs and benefits post-compact. These ERRs still rely on forecasts for the later portion of MCC’s CBA evaluation horizon, which spans 20 years. Nonetheless, independent evaluation-based ERRs complete the accountability loop in a way that is rare among donors. Two examples are below.Results of the Mozambique Farmer Income Support Project
MCC’s Farmer Income Support Project (FISP) was designed to reduce damage to the incomes of 1.7 million Mozambican farmers due to Coconut Lethal Yellowing Disease (CLYD). This was to be accomplished through (i) short term surveillance, control and mitigation services, prompt eradication of diseased palms, and replanting with the less susceptible Mozambican Green Tall coconut variety, and (ii) Technical advisory services to introduce crop-diversification options. Given forecast benefits to farmers’ incomes and the costs of the program, MCC originally forecast a project economic rate of return of 25.1 percent.An independent evaluation of the FISP project’s impacts found that cutting trees and burning tree stumps in epidemic areas did reduce CLYD prevalence, but not to the degree originally forecast, resulting in lower than expected productivity impacts. Likewise, endemic area alternative crop uptake was lower than expected, likely due to insufficient input and output market linkages. The resulting updated, evaluation-based ERR estimate was 16.8 percent. Greater detail on the evaluation and lessons learned are available in MCC’s public evaluation catalogue.[[https://data.MCC.gov/evaluations/index.php/catalog]]
Results of the Nicaragua Transportation Project
MCC’s Nicaragua Transportation Project was designed to stimulate economic development and improve access to markets and social services by reducing transportation costs. It upgraded and rehabilitated 68 km of roads, consisting of two secondary roads and a trunk road. MCC originally forecast an economic return from the project of 13.2 percent based on reduced vehicle operating costs and travel time savings for road users, including new users expected to travel on the road due to improved road conditions resulting from the project.The independent evaluation of this project estimated actual impacts using data from 2 years after the roads were completed. It found that the road roughness, a key indicator of transport costs, decreased 80 percent on average, and traffic increased 12 percent on average over the 2 years to 3,062 vehicles per day. At the same time, the capital costs for the road works came in on average 2.2 times those estimated prior to implementation. Given this balance of measured benefits and costs, the resulting evaluation-based ERR fell to 2.1 percent, primarily due to these higher costs. (Benefits were roughly consistent with ex-ante estimates.) Greater detail on the evaluation and lessons learned are available in MCC’s public evaluation catalogue,[[https://data.MCC.gov/evaluations/index.php/catalog]] and recently published Principles into Practice: Lessons from MCC’s Investments in Roads.[[https://www.MCC.gov/our-impact/principles-into-practice]]
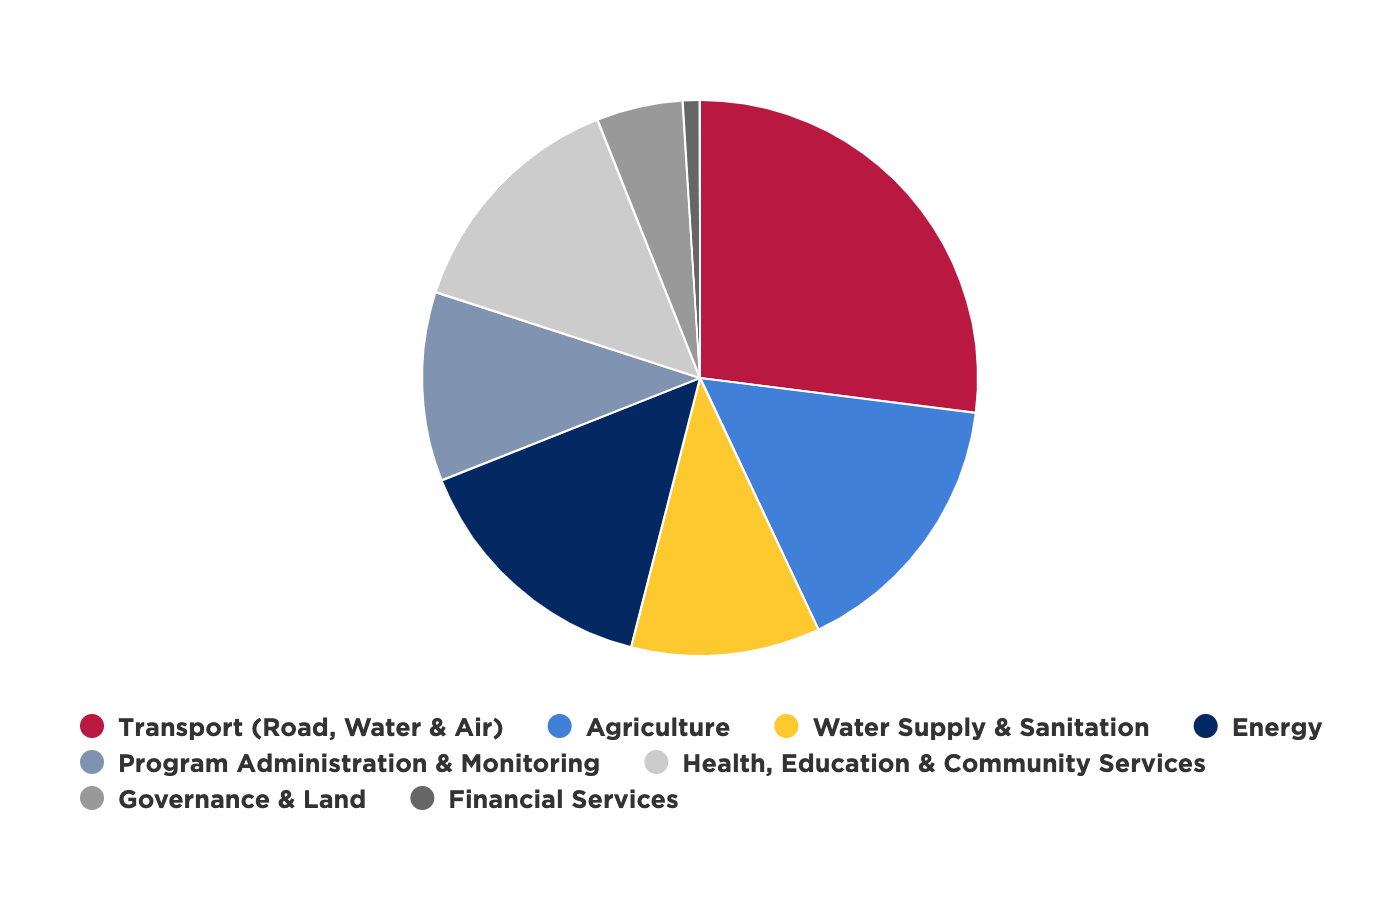
Investments by Sector as of FY 2018 Q4
| Sector | Amount ($ Millions) |
|---|---|
| Transportation (Road, Water & Air) | $3,328.2 |
| Agriculture | $1,956.8 |
| Health, Education & Community Services | $$1,770.0 |
| Energy | $1,885.7 |
| Program Administration & Monitoring | $1,367.9 |
| Water Supply & Sanitation | $1,387.7 |
| Governance & Land | $652.7 |
| Financial Services | $159.8 |
| Total | $12,508.8 |
Results by Sector as of FY 2018 Q4
| Sector | Indicator Indicators listed are MCC’s common indicators, which are selected to aggregate sector results across countries. | Total Portfolio Actuals Cumulative value for the indicator for both closed and active compacts (2005- | Data Points Number of compacts with available data. | Active and Completed Countries Tracked Underlined text indicates compacts that are still active. |
|---|---|---|---|---|
| Roads | Temporary employment generated in road construction | 50,245 | 7 | Armenia, Burkina Faso, Cabo Verde, El Salvador, El Salvador II, Georgia, Ghana, Honduras, Liberia, Mali, Moldova, Mongolia, Mozambique, Nicaragua, Niger, Philippines, Senegal |
| Kilometers of roads completed | 3,035 | 15 | ||
| Agriculture & Irrigation | Farmers trained | 404,477 | 14 | Armenia, Burkina Faso, Cabo Verde, El Salvador, Georgia, Ghana, Honduras, Indonesia, Madagascar, Mali, Moldova, Morocco, Morocco II, Mozambique, Namibia, Nicaragua, Niger, Senegal |
| Farmers who have applied improved practices as a result of training | 126,592 | 10 | ||
| Hectares under improved irrigation | 203,963 | 8 | ||
| Value of agricultural and rural loans | $87,074,694 | 9 | ||
| Water & Sanitation | Temporary employment generated in water and sanitation construction | 21,776 | 6 | Cabo Verde II, El Salvador, Georgia, Ghana, Jordan, Lesotho, Mozambique, Tanzania, Zambia |
| People trained in hygiene and sanitary best practices | 12,386 | 6 | ||
| Water points constructed | 1,191 | 4 | ||
| Operating cost coverage | 86% | 4 | ||
| Access to improved water supply | 68% | 3 | ||
| Education | Students participating | 217,474 | 7 | Burkina Faso, El Salvador, El Salvador II, Georgia II, Ghana, Mongolia, Morocco, Morocco II, Namibia |
| Facilities completed | 804 | 6 | ||
| Graduates from MCC-supported education activities | 62,483 | 5 | ||
| Land | Legal and regulatory reforms adopted | 134 | 7 | Benin, Burkina Faso, Cabo Verde II, Ghana, Indonesia, Lesotho, Madagascar, Mali, Morocco II, Mongolia, Mozambique, Namibia, Nicaragua, Niger, Senegal |
| Stakeholders trained | 77,968 | 11 | ||
| Land administration offices established or upgraded | 399 | 8 | ||
| Parcels corrected or incorporated in land system | 352,975 | 8 | ||
| Land rights formalized | 320,722[[Number decreased due to data revision post-compact.]] | 7 | ||
| Power | Kilometers of lines completed | 4,487 | 5 | Benin II, El Salvador, Georgia, Ghana, Ghana II, Indonesia, Liberia, Malawi, Mongolia, Tanzania |
Common Indicators
Agriculture and Irrigation Common Indicators:
A focus on results is one of the core principles on which the Millennium Challenge Corporation (MCC) was founded. Within country-specific plans, MCC uses common indicators to aggregate results across countries within certain sectors. MCAs are not required to report on certain common indicators where collecting that data is too costly or infeasible given existing data collection plans.| Process Indicators | Output Indicators | Outcome Indicators | ||||||||||||
|---|---|---|---|---|---|---|---|---|---|---|---|---|---|---|
| Country | Region | (AI-1) Value of signed irrigation feasibility and design contracts (USD) | (AI-2) Percent disbursed of irrigation feasibility and design contracts | (AI-3) Value of signed irrigation construction contracts (USD) | (AI-4) Percent disbursed of irrigation construction contracts | (AI-5) Temporary employment generated in irrigation | (AI-6) Farmers trained | (AI-7) Enterprises assisted | (AI-8) Hectares under improved irrigation | (AI-9) Loan borrowers | (AI-10) Value of agricultural and rural loans (USD) | (AI-11) Farmers who have applied improved practices as a result of training | (AI-12) Hectares under improved practices as a result of training | (AI-13) Enterprises that have applied improved techniques |
| MCC Total | 54,498,907 | 83.9% | 698,425,169 | 90.2% | 6,908 | 404,477 | 4,223 | 203,963 | 1,195 | 87,074,694 | 126,592 | 42,226 | 1,016 | |
| EAPLA Total | 10,686,574 | 93.0% | 190,892,731 | 88.1% | 2,975 | 213,082 | 1,597 | 11,926 | 1,099 | 66,414,932 | 56,496 | 7,279 | 418 | |
| AFRICA Total | 43,812,333 | 81.7% | 507,532,438 | 90.9% | 3,933 | 191,395 | 2,626 | 192,037 | 96 | 20,659,762 | 70,096 | 34,947 | 598 | |
| Armenia | EAPLA | 4,601,073 | 100.0% | 106,653,443 | 100.0% | 2,389 | 45,639 | 227 | - | 1,008 | 13,133,200 | 26,424 | - | 178 |
| El Salvador | - | - | - | - | - | 15,363 | 281 | - | 29 | 4,598,748 | 11,520 | - | 163 | |
| Georgia | 1,155,881 | 53.4% | - | - | - | - | 291 | - | - | 19,880,003 | - | - | - | |
| Honduras | - | - | - | - | - | 7,265 | 464 | 400 | - | 17,100,000 | 6,996 | - | - | |
| Indonesia | - | - | - | - | - | 129,142 | - | - | - | - | - | - | - | |
| Moldova | 4,929,620 | 95.7% | 84,239,288 | 73.0% | 586 | 6,569 | 334 | 11,526 | 62 | 11,702,981 | 2,452 | 7,279 | 77 | |
| Nicaragua | - | - | - | - | - | 9,104 | - | - | - | - | 9,104 | - | - | |
| Burkina Faso | AFRICA | 17,268,474 | 74.8% | 74,339,448 | 95.3% | 2,414 | 12,307 | 278 | 2,240 | 96 | 2,802,000 | 8,237 | 3,369 | 28 |
| Cabo Verde I | - | - | 5,167,848 | 97.6% | - | 553 | - | 13 | - | 617,000 | 106 | - | - | |
| Ghana | 5,202,887 | 100.0% | 13,009,963 | 100.0% | - | 66,930 | 1,724 | 514 | - | 16,740,762 | 59,060 | - | 535 | |
| Madagascar | - | - | - | - | - | 31,366 | 324 | - | - | - | 1,892 | - | 1 | |
| Mali | 9,077,220 | 98.2% | 148,951,503 | 98.3% | - | 1,308 | - | 97,503 | - | 500,000 | 801 | - | - | |
| Morocco | - | - | 111,353,027 | 99.0% | - | 40,863 | 114 | 53,376 | - | - | - | 31,578 | 34 | |
| Mozambique | - | - | - | - | - | 28,830 | 186 | - | - | - | - | - | - | |
| Namibia | - | - | - | - | - | 9,238 | - | - | - | - | - | - | - | |
| Niger | 2,573,579 | 15.8% | ||||||||||||
| Senegal | 9,690,173 | 86.3% | 154,710,649 | 75.0% | 1,519 | - | - | 38,391 | - | - | - | - | - | |
| Gender* | ||||||||||||||
| Female | 227 | 92,524 | 107 | 121 | 924,102 | 17,660 | 20 | |||||||
| Male | 4,292 | 205,839 | 413 | 1,066 | 13,580,879 | 40,077 | 85 | |||||||
*Gender totals may not match overall totals due to lack of gender counting in earlier Compacts.
Education Common Indicators:
A focus on results is one of the core principles on which the Millennium Challenge Corporation (MCC) was founded. Within country-specific plans, MCC uses common indicators to aggregate results across countries within certain sectors. MCAs are not required to report on certain common indicators where collecting that data is too costly or infeasible given existing data collection plans.| Process Indicators | Output Indicators | Outcome Indicators | |||||||
|---|---|---|---|---|---|---|---|---|---|
| Country | Region | (E-1) Value of signed educational facility construction, rehabilitation, and equipping contracts (USD) | (E-2) Percent disbursed of educational facility construction, rehabilitation, and equipping contracts | (E-3) Legal, financial, and policy reforms adopted | (E-4) Educational facilities constructed or rehabilitated | (E-5) Instructors trained | (E-6) Students participating in MCC-supported education activities | (E-7) Graduates from MCC-supported education activities | (E-8) Employed graduates of MCC-supported education activities |
| MCC Total | 224,523,414 | 92.1% | 5 | 804 | 4,951 | 217,474 | 62,483 | - | |
| EAPLA Total | 82,216,321 | 80.7% | 5 | 98 | 2,342 | 50,466 | 16,524 | - | |
| AFRICA Total | 142,307,093 | 98.7% | - | 706 | 2,609 | 167,008 | 45,959 | - | |
| El Salvador I | EAPLA | 9,857,585 | 99.8% | - | 22 | 378 | 30,672 | 4,285 | - |
| El Salvador II | 1,849,447 | 100% | - | - | - | 494 | - | - | |
| Georgia II | 42,329,961 | 64.2% | - | 58 | 594 | 1,820 | 272 | - | |
| Mongolia | 28,179,328 | 97.6% | 5 | 18 | 1,370 | 17,480 | 11,967 | - | |
| Burkina Faso | AFRICA | 22,758,211 | 99.9% | - | 396 | 557 | 31,065 | 4,035 | - |
| Ghana | 18,689,747 | 100.0% | - | 250 | - | 41,019 | - | - | |
| Morocco | 4,568,837 | 76.2% | - | - | 2,052 | 93,424 | 41,383 | - | |
| Morocco II | - | - | - | - | - | - | - | - | |
| Namibia | 96,290,298 | 99.2% | - | 60 | - | 1,500 | 541 | - | |
| Gender* | |||||||||
| Female | 2,500 | 73,506 | 37,031 | - | |||||
| Male | 2,451 | 65,792 | 20,744 | - | |||||
*Gender totals may not match overall totals due to lack of gender counting in earlier compacts.
Land Common Indicators:
A focus on results is one of the core principles on which the Millennium Challenge Corporation (MCC) was founded. Within country-specific plans, MCC uses common indicators to aggregate results across countries within certain sectors. MCAs are not required to report on certain common indicators where collecting that data is too costly or infeasible given existing data collection plans.| Output Indicators | Outcome Indicators | ||||||||
|---|---|---|---|---|---|---|---|---|---|
| Country | Region | (L-1) Legal and regulatory reforms adopted | (L-2) Land administration offices established or upgraded | (L-3) Stakeholders trained | (L-4) Conflicts successfully mediated | (L-5) Parcels corrected or incorporated in land system | (L-6) Land rights formalized | (L-7) Percentage change in time for property transactions | (L-8) Percentage change in cost for property transactions |
| MCC Total | 134 | 399 | 77,968 | 12,484 | 352,975 | 320,722 | NA | NA | |
| EAPLA Total | 6 | 15 | 8,383 | 10,639 | 18,336 | 20,672 | NA | NA | |
| AFRICA Total | 128 | 384 | 69,585 | 1,845 | 334,639 | 300,050 | NA | NA | |
| Indonesia | EAPLA | - | - | 4,463 | - | - | - | - | - |
| Mongolia | 6 | 15 | 3,920 | 10,639 | 18,336 | 20,672 | - | - | |
| Nicaragua | - | - | - | - | - | - | - | - | |
| Benin | AFRICA | - | - | 50 | - | - | - | - | - |
| Burkina Faso | 54 | 78 | 61,057 | 1,364 | 18,490 | 4,793 | - | - | |
| Cabo Verde II** | 36 | 38 | 442 | 229 | 37,495 | 11,365 | - | - | |
| Ghana | 4 | 3 | 427 | 23 | 1,481 | - | - | - | |
| Lesotho*** | 11 | 1 | 575 | 151 | 53,296 | 19,325 | -93 | - | |
| Madagascar | 4 | 237 | - | - | - | - | - | - | |
| Mali | - | 1 | 1,354 | - | - | - | - | - | |
| Mozambique | - | 26 | 1,516 | - | 205,005 | 251,556 | - | - | |
| Morocco II | - | - | - | - | - | - | - | - | |
| Namibia | 19 | - | 2,524 | - | 8,869 | 4,356 | - | - | |
| Niger | |||||||||
| Senegal | - | - | 1,640 | 78 | 10,003 | 8,655 | - | - | |
| Gender* | |||||||||
| Male | 54,816 | 85,400 | |||||||
| Female | 21,717 | 54,903 | |||||||
| Joint | 19,575 | ||||||||
| Location* | |||||||||
| Urban | 200,922 | 156,232 | |||||||
| Rural | 98,757 | 124,493 | |||||||
*Gender and location totals may not match overall totals due to lack of counting by gender and location in earlier Compacts.
**Number decreased due to a correction in data.
***(L-6) Value was corrected after verifying closeout data.
Power Common Indicators:
A focus on results is one of the core principles on which the Millennium Challenge Corporation (MCC) was founded. Within country-specific plans, MCC uses common indicators to aggregate results across countries within certain sectors. MCAs are not required to report on certain common indicators where collecting that data is too costly or infeasible given existing data collection plans.| Process Indicators | Output Indicators | Outcome Indicators | |||||||||||||||||||||||
|---|---|---|---|---|---|---|---|---|---|---|---|---|---|---|---|---|---|---|---|---|---|---|---|---|---|
| Country | Region | (P-1) Value of signed power infrastructure feasibility and design contracts | (P-2) Percent disbursed of power infrastructure feasibility and design contracts | (P-3) Value of signed power infrastructure construction contracts | (P-4) Percent disbursed of power infrastructure construction contracts | (P-5) Temporary employment generated in power infrastructure construction | (P-6) Generation capacity added | (P-7 and P-10) Km lines upgraded or built | (P-8) Transmission throughput capacity added | (P-9 and P-11) Substation capacity added | (P-12) Customers added by project | (P-13) Maintenance expenditure-asset value ratio | (P-14) Cost-reflective tariff regime | (P-15) Total electricity supply | (P-16) Power plant availability | (P-17) Installed generation capacity | (P-18) Transmission system technical losses (%) | (P-19) Distribution system losses | (P-20) Commercial losses | (P-21) System Average Interruption Duration Index (SAIDI) | (P-22) System Average Interruption Frequency Index (SAIFI) | (P-23) Total electricity sold | (P-24) Operating cost-recovery ratio | (P-25) Percentage of households connected to the national grid | (P-26) Share of renewable energy in the country |
| MCC Total | 66,770,017 | 57.9% | 513,244,714 | 80.6% | 6,407 | 79 | 4,487 | NA | 84 | 44,507 | NA | NA | 18,221,134 | NA | 6,226 | NA | NA | NA | NA | NA | 3,508,844 | NA | NA | NA | |
| EAPLA Total | - | 0.0% | 0 | 0.0% | - | 13 | 1,692 | NA | - | 44,507 | NA | NA | 0 | NA | 0 | NA | NA | NA | NA | NA | 0 | NA | NA | NA | |
| AFRICA total | 66,770,017 | 57.9% | 513,244,714 | 80.6% | 6,407 | 66 | 2,796 | NA | 84 | - | NA | NA | 18,221,134 | NA | 6,226 | NA | NA | NA | NA | NA | 3,508,844 | NA | NA | NA | |
| El Salvador | EAPLA | - | - | - | - | - | - | 1,523 | - | - | 35,412 | - | - | - | - | - | - | - | - | - | - | - | - | - | - |
| Georgia | - | - | - | - | - | - | - | - | - | - | - | - | - | - | - | - | - | - | - | - | - | - | - | - | |
| Indonesia | - | - | - | - | - | 13 | 169 | - | - | 9,095 | - | - | - | - | - | - | - | - | - | - | - | - | - | - | |
| Mongolia | - | - | - | - | - | - | - | - | - | - | - | - | - | - | - | - | - | - | - | - | - | - | - | - | |
| Benin II | AFRICA | 11,490,471 | 15.9% | - | - | - | - | - | - | - | - | - | - | 1,210,105 | - | - | - | - | 983,825 | - | - | - | |||
| Ghana | - | - | - | - | - | - | 99 | - | - | - | - | - | - | - | - | - | - | - | - | - | - | ||||
| Ghana II | 20,390,434 | 23.3% | - | - | - | - | - | - | - | - | 1.0 | - | 15,081,024 | 70.3 | 4,677 | - | 25.46,31.9**** | 20.4 | 18.47; 23.84**** | 17.04; 13.73**** | 694,000 | 60 | - | - | |
| Liberia*** | - | - | 136,638,866 | 100.0% | - | 66 | 24 | - | 84 | - | - | - | 111,724 | 67 | 141 | - | - | 19 | 15 | 43,621 | - | 6 | 47 | ||
| Malawi | 19,141,688 | 78.4% | 223,053,295 | 65.5% | 2,334 | - | - | - | - | - | 13.8 | - | 1,818,282 | 80 | 459 | 5.7 | 15.1 | - | - | - | 1,461,629 | 395 | 11 | 100 | |
| Tanzania | 15,747,424 | 108.6% | 153,552,553 | 85.3% | 4,073 | - | 2,673 | - | - | - | - | - | - | - | 949 | - | - | - | - | - | 325,769 | - | - | - | |
| T&D | |||||||||||||||||||||||||
| Transmission | 24 | - | - | - | - | - | - | - | - | - | - | - | - | - | |||||||||||
| Distribution | 4,294 | - | - | - | - | - | - | - | - | - | - | - | - | - | |||||||||||
| Gender* | |||||||||||||||||||||||||
| Female | 170 | ||||||||||||||||||||||||
| Male | 2,164 | ||||||||||||||||||||||||
| Grid | |||||||||||||||||||||||||
| On-grid | 66 | 8 | 5,212 | ||||||||||||||||||||||
| Off-grid | - | 5 | 65.0 | ||||||||||||||||||||||
| Tariff class | |||||||||||||||||||||||||
| Residential | - | 1,267,299 | |||||||||||||||||||||||
| Commercial | - | 288,350 | |||||||||||||||||||||||
| Industrial | - | 233,281 | |||||||||||||||||||||||
P-13, P-15, P-23 and P-24 are classified as Level (cumulative) indicators. This means that the number will be reported at the end of Compact year as to represent the total value in a given year.
*Gender totals may not match overall totals due to lack of gender counting in earlier compacts.
** This is a monitoring indicator and cannot be attributed solely to MCC investment.
*** Not all common indicator data for Liberia was included for this quarter as the data is still being verified.
****In Ghana II there are two utilities who report different number for Distribution System Losses, SAIDI, and SAIFI. P-19 -ECG: 25.46, NEDCo: 31.9 P-21 - ECG: 18.47, NEDCo: 26.5 P-22 - ECG: 17.04, NEDCo: 13.73
Roads Common Indicators:
A focus on results is one of the core principles on which the Millennium Challenge Corporation (MCC) was founded. Within country-specific plans, MCC uses common indicators to aggregate results across countries within certain sectors. MCAs are not required to report on certain common indicators where collecting that data is too costly or infeasible given existing data collection plans.| Process Indicators | Output Indicators | Outcome Indicators | ||||||||||
|---|---|---|---|---|---|---|---|---|---|---|---|---|
| Country | Region | (R-1) Value of signed road feasibility and design contracts | (R-2) Percent disbursed of road feasibility and design contracts | (R-3) Kilometers of roads under design | (R-4) Value of signed road construction contracts | (R-5) Percent disbursed of road construction contracts | (R-6) Kilometers of roads under works contracts | (R-7) Temporary employment generated in road construction | (R-8) Kilometers of roads completed | (R-9) Roughness | (R-10) Average annual daily traffic | (R-11) Road traffic fatalities |
| MCC Total | 130,499,160 | 96.7% | 4,685 | 2,408,861,462 | 86.5% | 3,944 | 50,245 | 3,035 | NA | NA | 655 | |
| EAPLA Total | 64,075,771 | 93% | 1,791 | 1,147,558,152 | 86% | 1860.8 | 1,732 | 1,749 | - | - | - | |
| AFRICA Total | 67,580,420 | 98% | 2,895 | 1,261,303,310 | 87% | 2083.4 | 48,513 | 1,286 | - | - | 651 | |
| Armenia | EAPLA | - | - | - | - | - | - | - | 24.4 | 3.47 | 735 | - |
| El Salvador I | 18,321,410 | 99% | 223 | 248,378,825 | 97% | 223.0 | - | 223.32 | - | - | - | |
| El Salvador II | - | - | 32.4 | 62,902,840 | 1% | 26.6 | 423 | - | - | - | - | |
| Georgia | 11,980,000 | 99% | - | 197,299,030 | 100% | 220.2 | - | 220.20 | 1.50 | 1,092 | - | |
| Honduras | 9,500,000 | 75% | 673 | 179,400,000 | 72% | 673.0 | - | 610.10 | - | - | - | |
| Moldova | - | - | 96 | 100,807,443 | 96% | 96.0 | 1,309 | 96 | - | - | 4 | |
| Mongolia | 6,083,650 | 89% | 19.3 | 73,108,907 | 91% | 176.4 | - | 176.40 | 1.90 | 353 | - | |
| Nicaragua | - | - | 375.5 | 56,507,526 | 100% | 74.0 | - | 74.0 | - | - | - | |
| Philippines | 15,235,623 | 94% | 222.0 | 173,156,531 | 81% | 222.0 | - | 175.0 | - | - | - | |
| Vanuatu | 2,955,088 | 100% | 149.7 | 55,997,051 | 97% | 149.7 | - | 149.70 | 3.00 | - | - | |
| Burkina Faso | AFRICA | 8,339,651 | 115% | 536 | 140,205,145 | 102% | 419.1 | 4,162 | 277.80 | - | - | 6 |
| Cape Verde I | 3,520,000 | 92% | 63 | 24,280,000 | 100% | 40.6 | - | 40.60 | 2.00 | - | ||
| Ghana | 5,549,044 | 100% | 943 | 250,604,022 | 100% | 446.4 | 35,455 | 445.03 | - | 602 | ||
| Liberia | - | - | - | - | - | - | - | - | - | - | - | |
| Mali | - | - | - | 42,918,038 | 35% | 81.0 | - | 79.00 | - | - | - | |
| Mozambique** | 17,669,992 | 85% | 253 | 132,240,557 | 88% | 253.0 | 2,308 | 253 | - | - | ||
| Niger | 1,157,031 | 220 | ||||||||||
| Senegal | 12,201,371 | 102% | 406 | 271,128,882 | 70% | 375.0 | 2,757 | *** | - | - | 43 | |
| Tanzania | 19,143,331 | 107% | 473 | 399,926,666 | 91% | 468.34 | 3,831 | 190.14 | - | - | - | |
| Gender* | ||||||||||||
| Male | 13,613 | 45 | ||||||||||
| Female | 1,267 | 4 | ||||||||||
| Road Type* | ||||||||||||
| Primary | 65,222,944 | 23% | 2,093 | 1,405,547,708 | 86% | 1,894 | 1,177.58 | |||||
| Secondary | 24,735,623 | 87% | 1,374 | 617,229,323 | 85% | 1,133 | 478.65 | |||||
| Tertiary | 6,719,183 | 112% | 935 | 164,505,401 | 66% | 681 | 1,077.77 | |||||
*Gender and road type totals may not match overall totals due to lack of counting by gender and road type in earlier Compacts.
** The kilometers of roads completed for Mozambique is provisional data. Subject to change after verification of takeover certificates.
*** According to the Common Indicator definition, a road is completed when official certificates are handed over and approved. In Senegal, this was taken to mean final acceptance of the road works, which typically happens after the end of the 1 year defects liability period which starts when the construction is completed and the roads are provisionally accepted. As part of its Compact, Senegal intended to rehabilitate 372 kilometers of national roads. By September 2015, when the Senegal Compact closed, no roads had achieved final acceptance, and therefore were not officially completed, per the common indicator definition. However, by the end of the Compact, 185km of roads had been fully rehabilitated and had received provisional acceptance. An additional 72km were provisionally accepted in November 2015, and the remaining 116km are anticipated to be provisionally accepted with the support of the Government of Senegal by mid-2016.
Water Supply, Sanitation and Hygiene Common Indicators:
A focus on results is one of the core principles on which the Millennium Challenge Corporation (MCC) was founded. Within country-specific plans, MCC uses common indicators to aggregate results across countries within certain sectors. MCAs are not required to report on certain common indicators where collecting that data is too costly or infeasible given existing data collection plans.| Process Indicators | Output Indicators | Outcome Indicators | |||||||||||||||||
|---|---|---|---|---|---|---|---|---|---|---|---|---|---|---|---|---|---|---|---|
| Country | Region | (WS-1) Value of signed water and sanitation feasibility and design contracts (USD) | (WS-2) Percent disbursed of water and sanitation feasibility and design contracts | (WS-3) Value of signed water and sanitation construction contracts (USD) | (WS-4) Percent disbursed of water and sanitation construction contracts | (WS-5) Temporary employment generated in water and sanitation construction | (WS-6) People trained in hygiene and sanitary best practices | (WS-7) Water points constructed | (WS-8) Non revenue water | (WS-9) Continuity of service | (WS-10) Operating cost coverage | (WS-11)** Volume of water produced**** | (WS-12) Access to improved water supply | (WS-13) Access to improved sanitation | (WS-14)** Residential water consumption | (WS-15)** Industrial/Commercial water consumption | (WS-16)** Prevalence of diarrhea | ||
| MCC Total | 54,337,691 | 97.6% | 817,638,658 | 85.6% | 21,776 | 12,386 | 1,191 | 51.1% | NA | NA | 218,574,530 | NA | NA | NA | NA | NA | |||
| EAPLA Total | 5,250,665 | 96.2% | 303,498,694 | 98.8% | 3,825 | 2,406 | - | 50.7% | - | - | - | - | - | - | - | ||||
| AFRICA Total | 49,087,026 | 97.8% | 514,139,963 | 77.8% | 17,951 | 9,980 | 1,191 | 51.4% | - | - | 218,574,530 | - | - | - | - | - | |||
| El Salvador | EAPLA | 4,983,800 | 96.0% | 10,451,448 | 97.5% | - | 2,406 | - | - | - | - | - | 83.0% | 88% | |||||
| Georgia | 266,865 | 100.0% | 54,315,000 | 94.2% | - | - | - | - | - | - | - | - | - | - | - | - | |||
| Jordan | - | - | 238,732,246 | 100% | 3,825 | - | - | 50.7% | 7.35*** | 85.6% | - | - | 67% | 54.1 | - | 3.1 | |||
| Cabo Verde II | AFRICA | 783,369 | 93.6% | 19,315,569 | 97.5% | 759 | 32 | - | 78.9% | 7.7 | 45% | - | 98.52% | 74.8 | 15.6 | - | |||
| Ghana | 1,475,148 | 100.0% | 13,949,465 | 100.0% | - | 778 | 392 | - | - | - | - | - | - | 36.0 | - | - | |||
| Lesotho***** | - | - | 59,733,645 | 79% | 11,527 | 454 | 175 | 27.0% | - | - | - | - | - | - | - | - | |||
| Mozambique | 35,076,009 | 99.1% | 169,500,497 | 87.5% | 2,276 | 8,400 | 614 | - | - | - | - | 23.4% | - | 19.5 | - | - | |||
| Tanzania | 6,861,280 | 102.1% | 45,403,796 | 81.1% | 387 | - | - | 48.8% | - | 113.1% | 200,330,000 | - | - | 166.5 | 998,439.6 | - | |||
| Zambia | 4,891,220 | 82.5% | 206,236,991 | 65.5% | 3,002 | 316 | 10 | 51.0% | 17 | 98.4% | 18,244,530 | - | - | - | - | - | |||
| Gender* | |||||||||||||||||||
| Female | 1,123 | 5,913 | |||||||||||||||||
| Male | 8,739 | 6,019 | |||||||||||||||||
*Gender totals may not match overall totals due to lack of gender counting in earlier compacts.
** This is a monitoring indicator; any change over baseline data represents the current trend and does not represent the direct impact of the MCC-investment.
*** Jordan's M&E Plan has, throughout the life of the compact, defined hours of supply as hours/week. As such all documentation is in this form. The value here has been divided by 7 here to accurately reflect supply hours per day.
****(WS-8): In Cabo Verde II the utility is in transition and during this period it has experienced challenges with its billing system and low collection rates, which accounts for some of the high rates of Non revenue water.
****The current unit for volume of water produced has a discrepancy. MCC M&E is in the process of revising this common indicator to clarify and align with current industry standards.
*****Value decreased after verifying closeout data.
FY 2019 Corporate Goals
For FY 2019, MCC management established three specific goals to guide agency planning and performance for the year. As in past years, these corporate goals are the starting point for annual department and division goal-setting, from which staff develop their individual performance plans. Below you will find MCC’s FY 2019 corporate goals with additional updates.| Corporate Priority | Updates |
|---|---|
| Strengthen MCC as a Leader in Development | To better support the US’s priorities in development, MCC is intensifying its focus on data and evidence-driven results while actively participating in the National Security Strategy and related inter-agency efforts on foreign assistance. Additionally, MCC intends to closely assist with the set-up of the new International Development Finance Corporation in order to ensure seamless coordination with the DFC once operational. MCC had a key participating role in in the President’s launch of the Women’s Global Development and Prosperity (WGDP) Initiative in February 2019, and will continue to incorporate the principles of WGDP into its programs, indicators, and reporting objectives. |
| Develop, Implement, Monitor and Evaluate High Quality and Innovative Programs | MCC signed a $550 million compact with Senegal on December 2018, which includes a $50 million contribution from the Government of Senegal. The agency is closely monitoring ongoing concerns in Sri Lanka to determine the best path forward. MCC is also working with The Gambia to present a successful threshold program to the MCC Board to at the end of FY 2019. In January 2019, MCC successfully completed close out of its first compact with Malawi, and is on schedule to complete close outs in Zambia, Georgia, and Honduras within the year. MCC will enter-into-force on $524 million compact with Cote d’Ivoire in 2019 and is actively exploring regional integration opportunities in five of our current country partners in Africa. The agency is currently engaging with each country to determine if there are project opportunities that meet MCC’s investment criteria, as well as evaluating the countries’ ability to work together in a regional capacity. Lastly, MCC continues to monitor implementation progress across the compact and threshold program portfolio. |
| Enhance Organizational Health, Operational Effectiveness and Agility | For FY 2019, MCC is pursuing five initiatives for enhancing organizational health and operational effectiveness. This includes advancing the agency’s internal knowledge management initiative, investing in human capital, focusing on compact implementation efficiencies, strengthening practice groups to improve the quality of operations, and increasing outreach to U.S. business around opportunities to participate in, leverage and invest alongside MCC’s overseas activities. MCC’s knowledge management initiative is well underway, with a detailed action plan in place to increase internal efficiency and development of a new intranet set to deploy this year. To better prioritize investment in human capital, MCC conducted an organizational health workshop and is codifying feedback from this event into a larger agency plan. Additionally, implementation of a new workforce management system is in progress and is set to launch in late summer. Following last year’s success, MCC plans to conduct another “efficiency challenge” to review staff proposals on potential improvements to the compact implementation process. MCC also plans to strengthen internal practice groups by developing and updating technical guidance, and by issuing the first round of completed Star Reports for closed compacts. |