

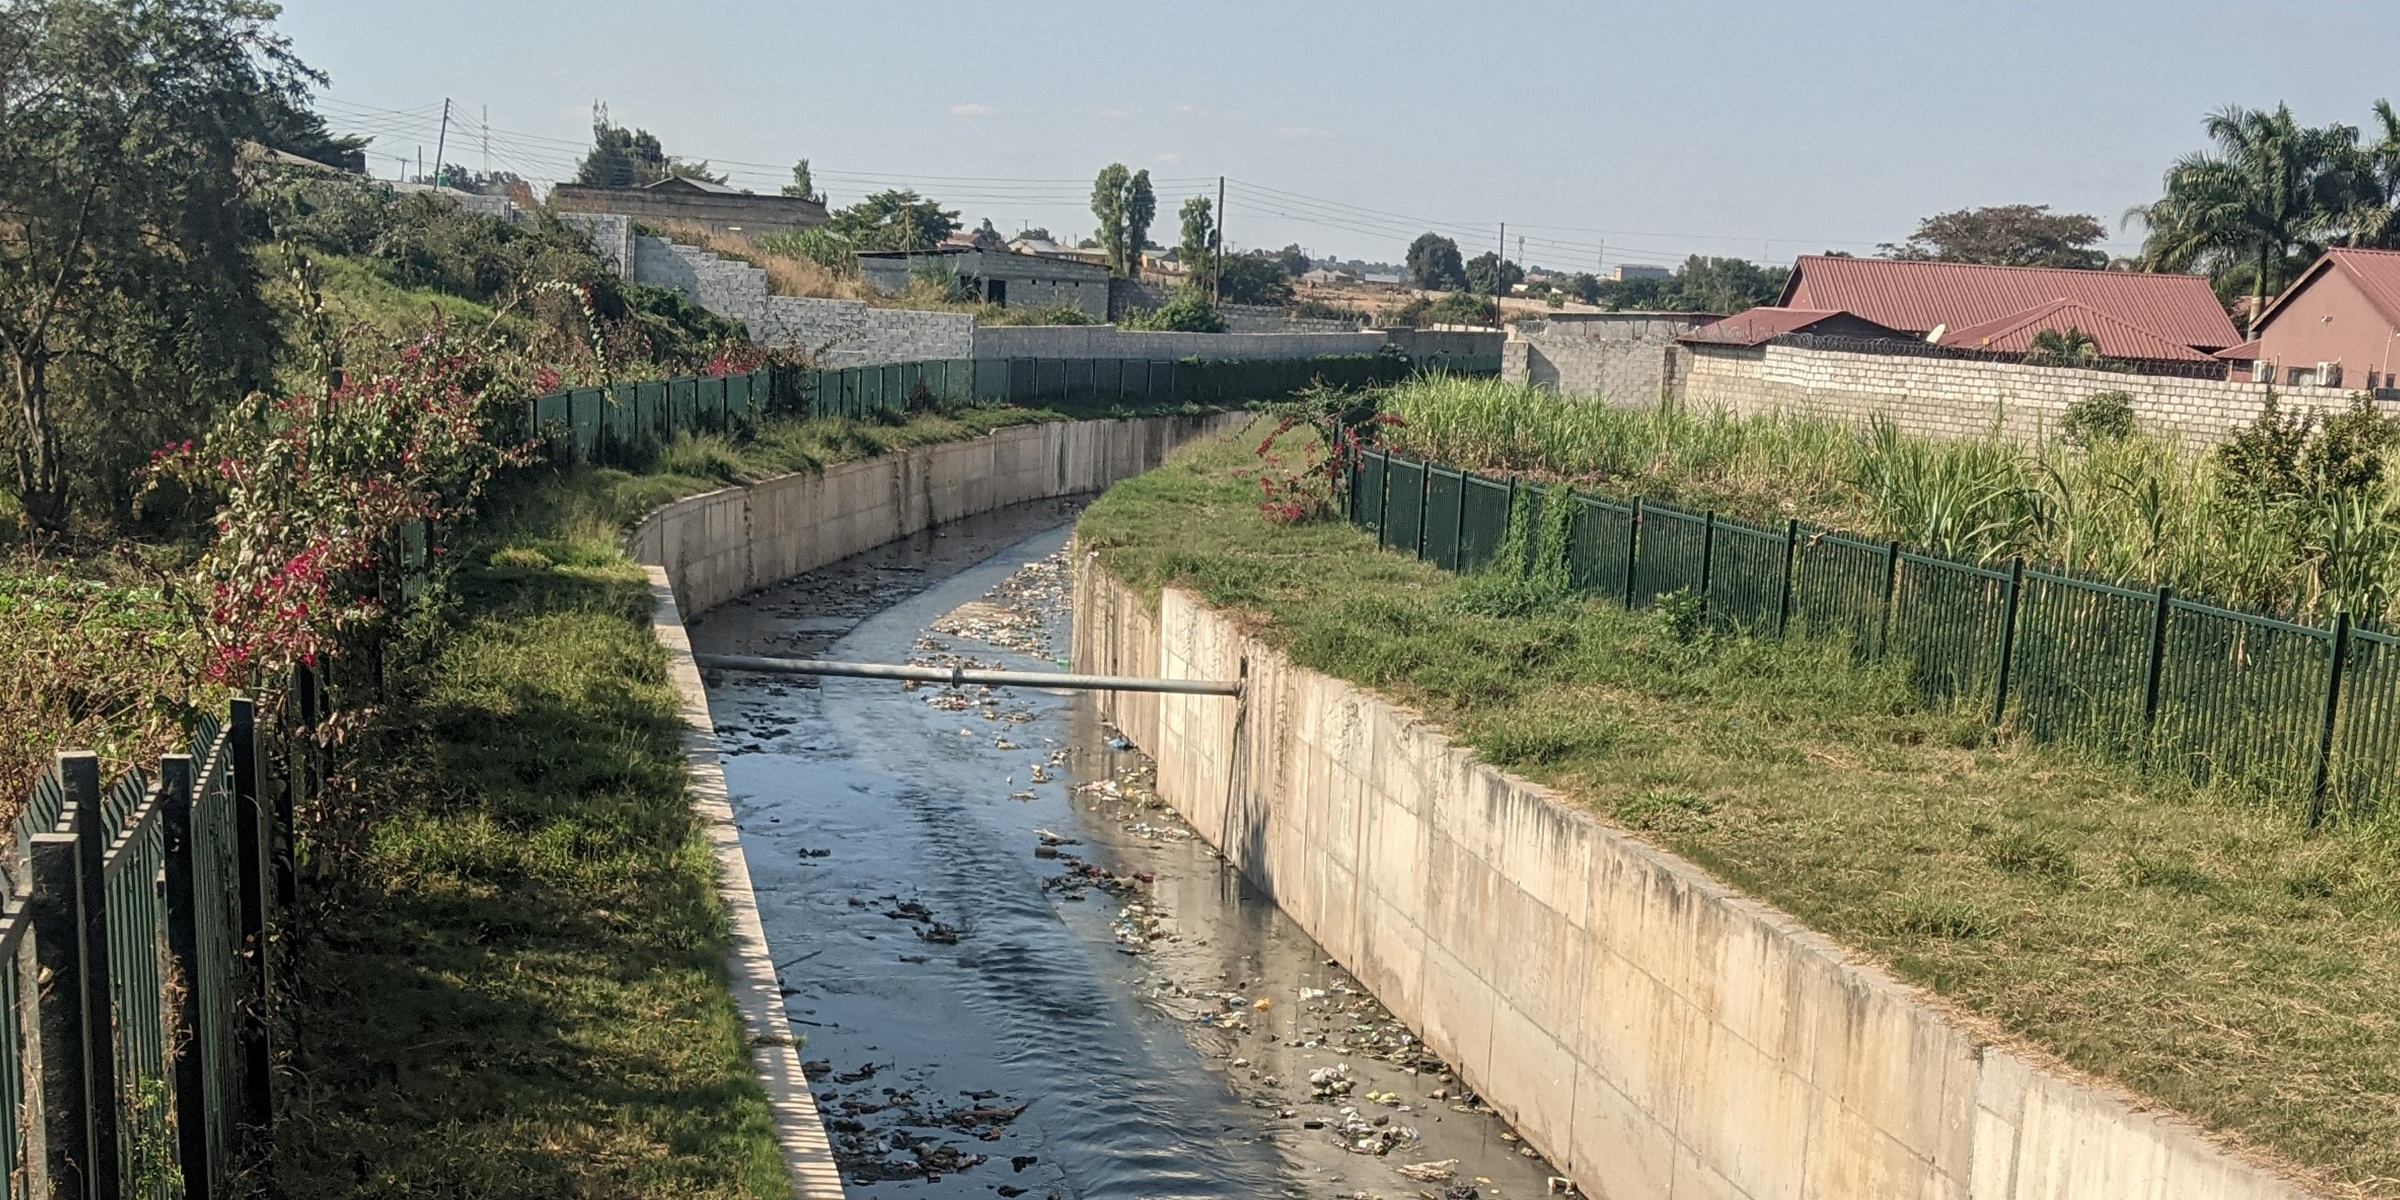
Program Overview
MCC’s $332 million Zambia Compact (2013-2018) funded the $293 million Lusaka Water Supply, Sanitation, and Drainage (LWSSD) Project to rehabilitate and extend infrastructure and strengthen the institutional capacity of Lusaka’s municipal government responsible for drainage and the local water and sanitation utility. These investments were expected to expand access to, and improve the reliability of, water supply and sanitation, and improve drainage services in select urban and peri-urban areas of the city of Lusaka in order to decrease the incidence of water-borne and water-related diseases, generate time savings for households and businesses and reduce non-revenue water in the water supply network.
Evaluator Description
MCC commissioned Mathematica to conduct an independent final performance and impact evaluation of the Lusaka Water Supply, Sanitation, and Drainage Project. Full report results and learning: https://evidence.mcc.gov/evaluations/index.php/catalog/230.
Key Findings
Utility Performance
- The utility did not improve maintenance practices. The new infrastructure was already deteriorating as a result.
- Due to poor management practices, the utility’s key financial indicators did not improve.
Household Benefits from Piped Water
- The utility connected 12,500 customers, only half as many as expected. Those who did get connected increased their water consumption (up to 3x) and spent less time collecting water.
- There were still frequent water outages, piped water was inadequately chlorinated, and few households were connected to the sewer network four years after the compact ended.
Household Benefits from Drainage
Drainage Infrastructure Sustainability
Evaluation Questions
This final performance and impact evaluation was designed to answer the following questions.
- 1
Did the technical assistance achieve its goals of improving institutional governance and promoting infrastructure sustainability? - 2
What were the impacts of the new infrastructure and changes in service delivery on beneficiary households and how were benefits distributed?
Detailed Findings
These findings build upon the interim evaluation report (2020), the Municipal Utility Operations Monitoring and Evaluation Report (2021), and the Innovative Grants Facility Evaluation Report (2018).
Utility Performance
Key outcomes of technical assistance to the water utility did not occur. Despite the asset management technical assistance, many elements of the infrastructure were already starting to deteriorate due to lack of preventative maintenance. In part because the infrastructure intended to help identify and reduce leakages was not completed, and in part due to a persistent culture of not prioritizing leaks, metering, and billing database accuracy, the utility’s rate of non-revenue water was unchanged.
Household Benefits from Piped Water
As of the end of 2022, the utility had connected less than half the targeted 27,000 new customers. Households connected through the compact still collected water due to frequent outages but spent 18-45 minutes less per household member per week than unconnected households. These time savings mainly accrued to females.
Unconnected households also benefitted from the infrastructure—in 2022 they were more likely to use a neighbor’s piped connection and spend less time collecting water when they did so. Connected households used 15-30 liters more water per household member per day, up to three times as much as unconnected households used, reaching the World Health Organization’s recommended minimum target for water consumption. Water was a very small share of household expenses for both connected and unconnected households, averaging less than $0.50 per household member per month. The unit cost of piped water was lower than from alternative sources, but increased consumption among connected households in some neighborhoods offset potential savings. The majority of the water utility’s customers were satisfied with the availability and quality of water, but the evaluation found that only two percent of piped water samples were adequately chlorinated (i.e., protected from bacterial contamination). Construction of the sewer network was delayed and fewer than 400 households had been connected by November 2022.
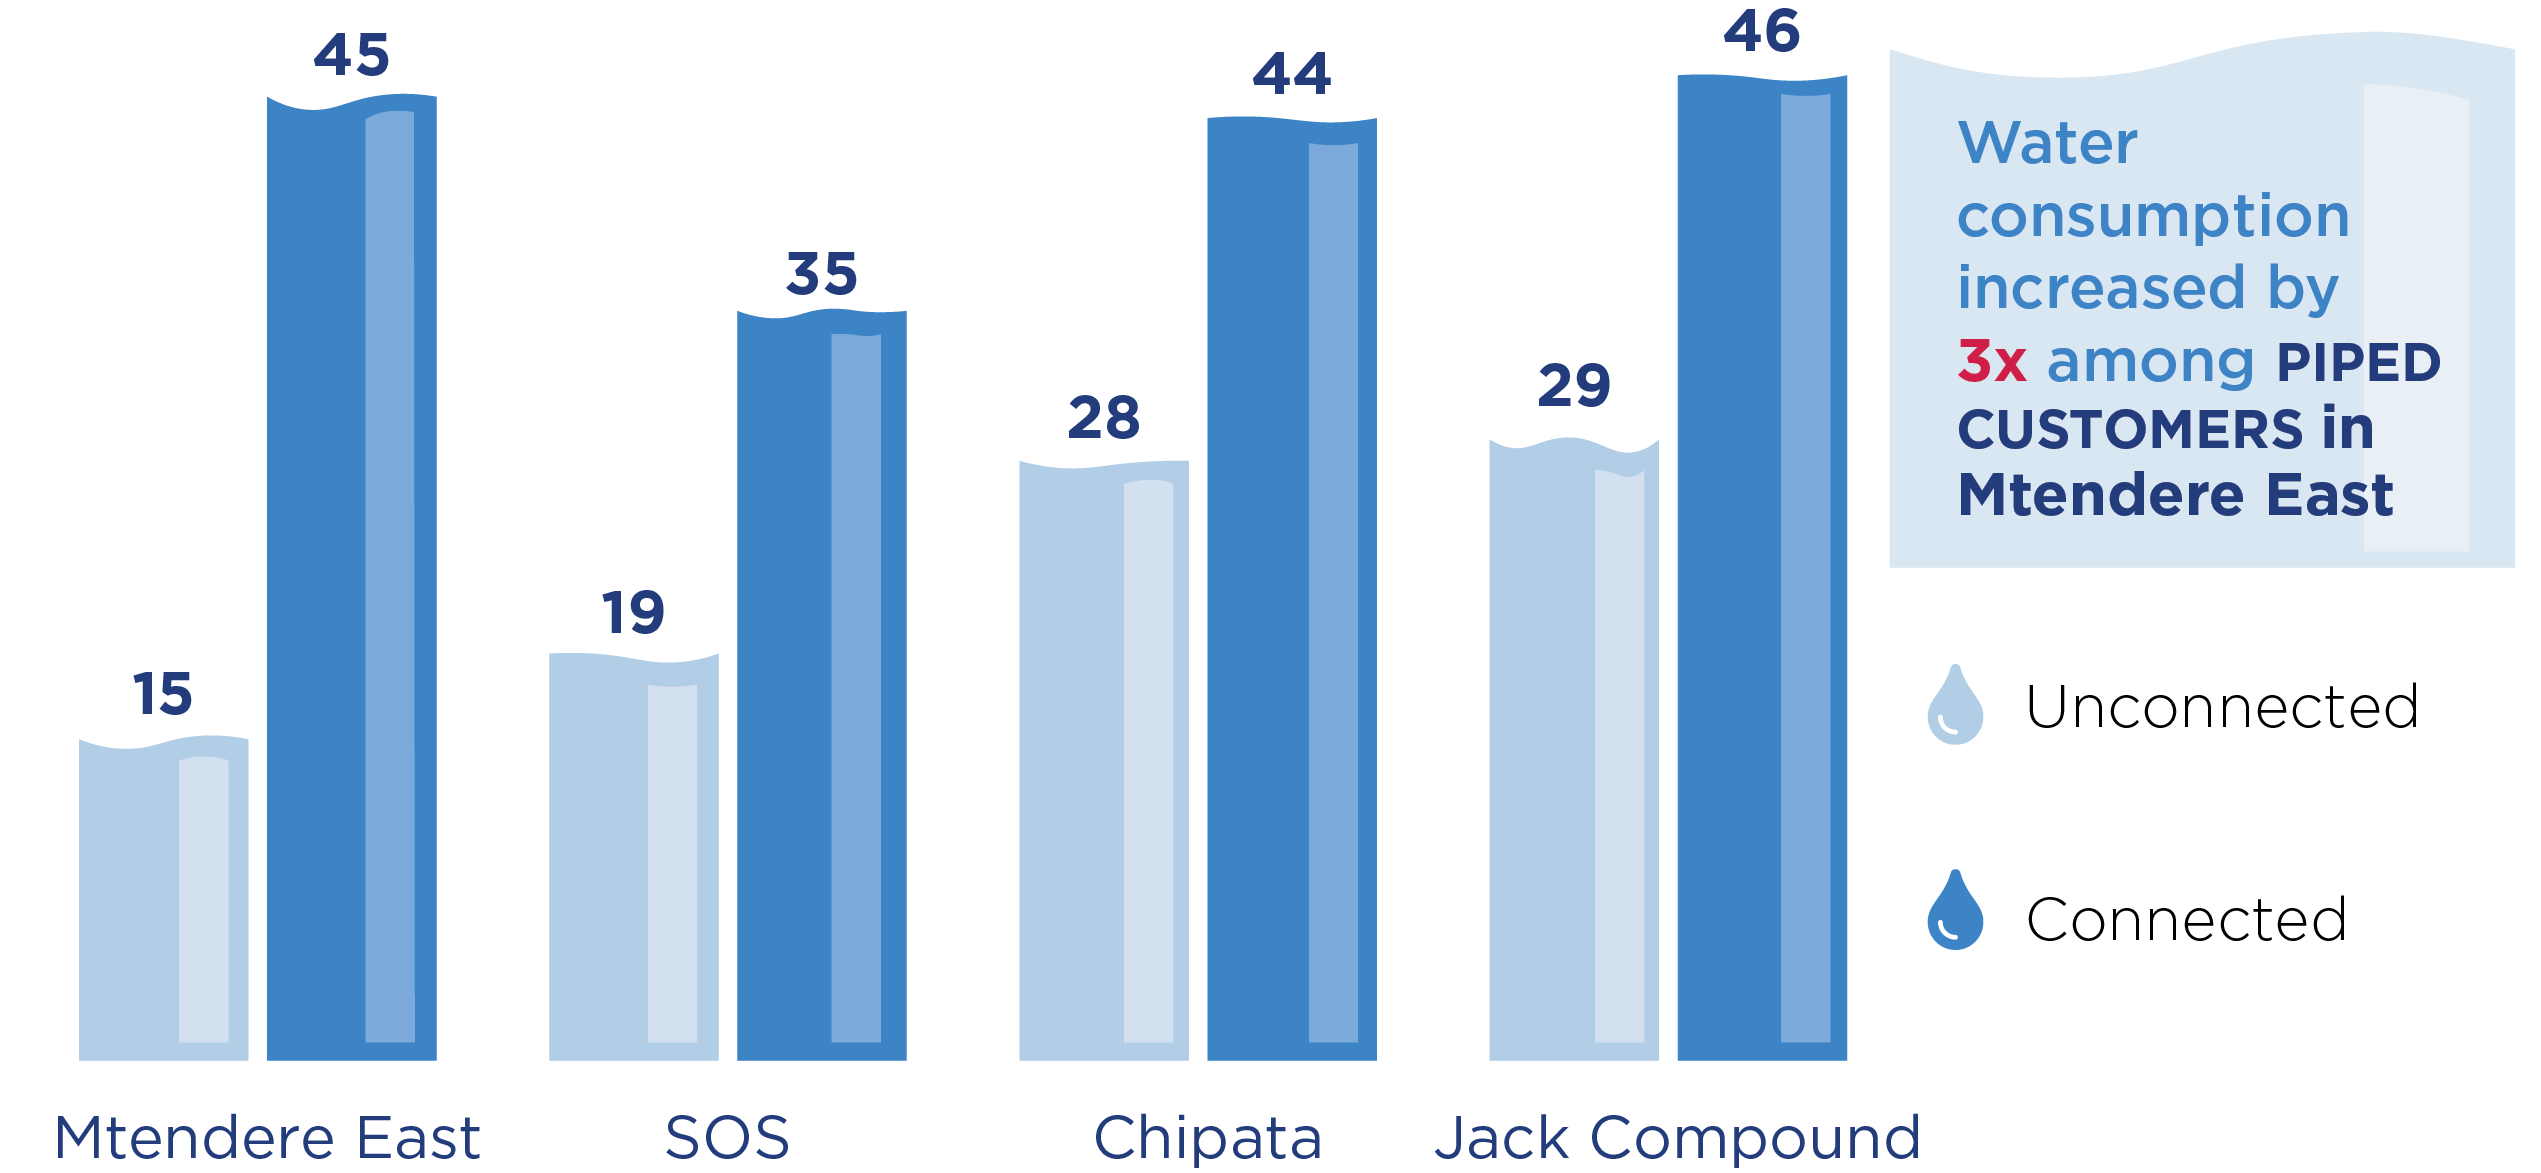
Water consumption (liters) per household, connected and unconnected
Households Benefits from Drainage
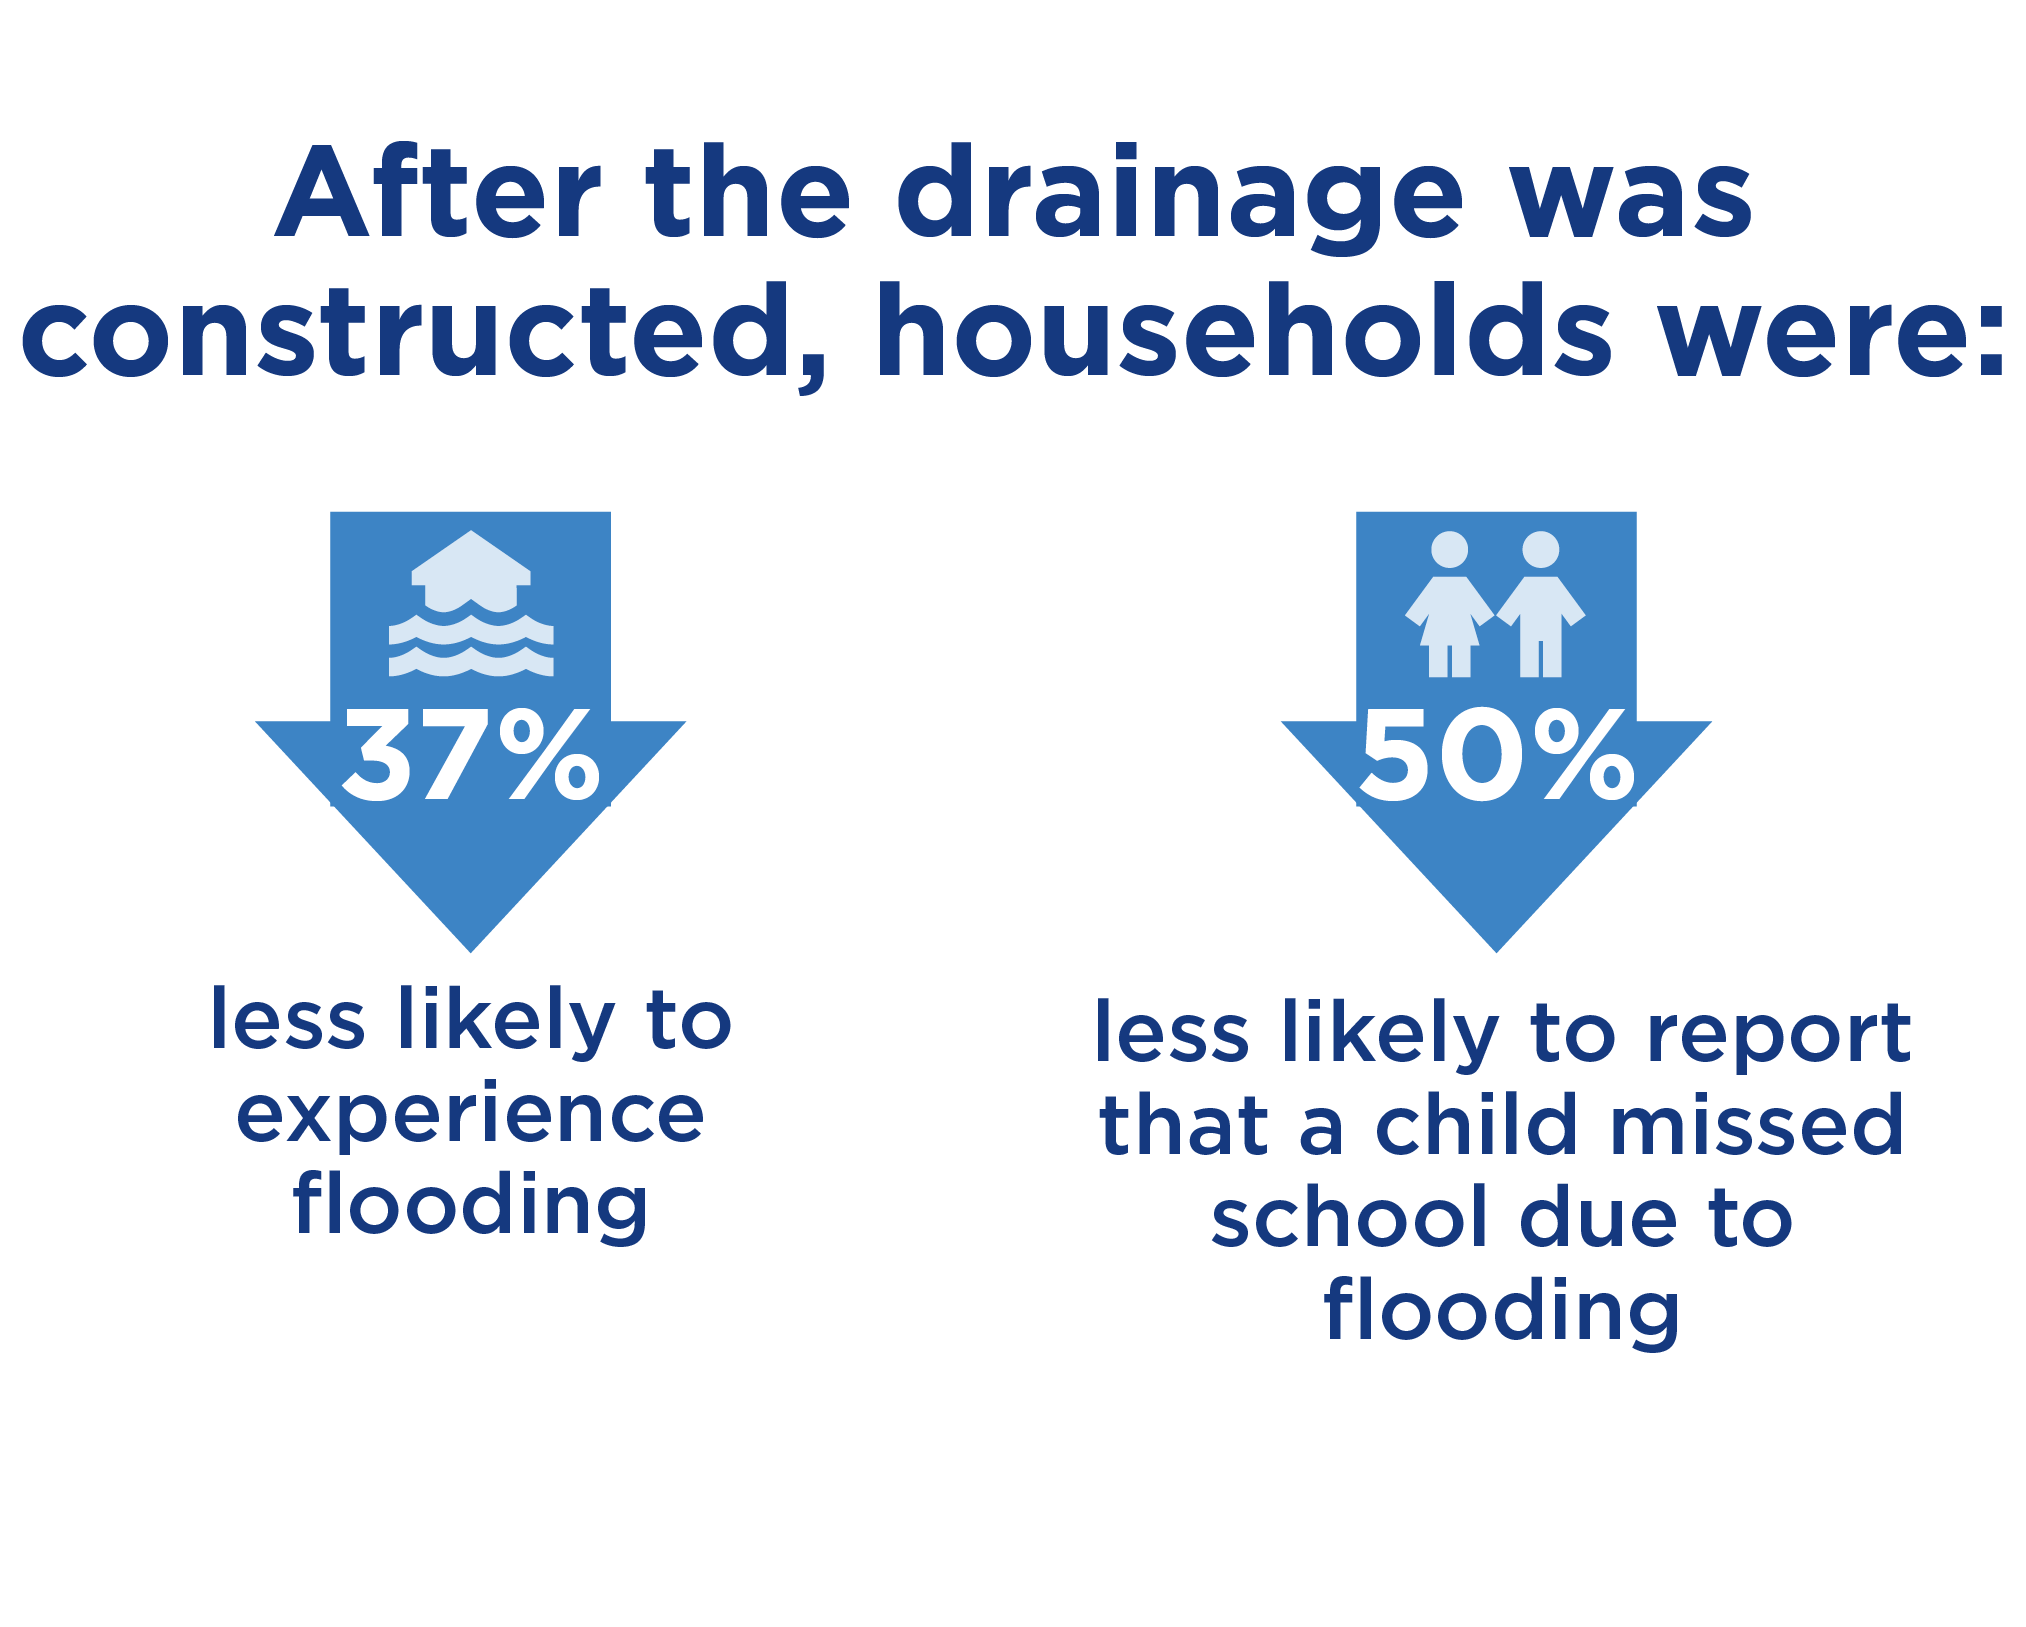
The improved drainage infrastructure reduced flooding in Lusaka by 37 percent, and households were half as likely to have a child miss school because of flooding compared to baseline. Members of households that did not experience flooding saved an estimated six hours on their commutes over the course of the rainy season. However, the drainage did not reduce flooding probability during periods of heavy rainfall (>208mm of rainfall over 30 days) and approximately 30 percent of households still experienced flooding annually. Only 4 percent of households reported property damage due to flooding, a statistic that was unchanged since before the drainage was constructed.
Drainage Infrastructure Sustainability
Garbage dumping threatens the effectiveness of the drainage. A drainage maintenance unit, new solid waste management utility, and public information campaigns to reduce dumping of garbage were intended to ensure proper maintenance and functioning of the drainage. As of June 2022, drainage maintenance was done by a contractor funded by the national government (a solution which was not guaranteed for the future). The new solid waste management utility had not been created and the municipal staff who coordinate community engagement did not have funding for these activities. As a result, several sections of the drainage were clogged with garbage or silt. Only 60 percent of households surveyed in 2022 used formal garbage collection services, and 9 percent reported dumping trash in the drainage or streets.
Economic Rate of Return
MCC considers a 10 percent economic rate of return (ERR) as the threshold to proceed with investment.
- 13.7%
Original ERR - 9.7%
Closeout ERR
The evaluation findings suggest that many of the assumptions in the closeout ERR were still overly optimistic. Adjusting the timing of the benefit streams based on the infrastructure completion dates and the observed deterioration of many elements of the infrastructure would reduce the ERR by several percentage points. Since the lifespan of the infrastructure is as yet unknown, such adjustments would still be speculative. Updating the ERR to reflect the number of new connections and the time saved per household reduces the ERR by over half. In addition, although the evaluation found that the drainage did lead to time savings as a result of reduced flooding, these were not nearly as large as had been assumed in the ERR.
MCC Learning
MCC should adopt a “reform first” approach to working with utilities.
In future water projects, MCC should ensure an adequate understanding of water quality and its determinants.
Validate critical assumptions underlying cost-benefit analyses and project logics during compact development.
Limit the number of evaluation questions to provide focus to the evaluation.
Carefully consider the implications of different acquisition approaches for project evaluations.
Evaluation Methods
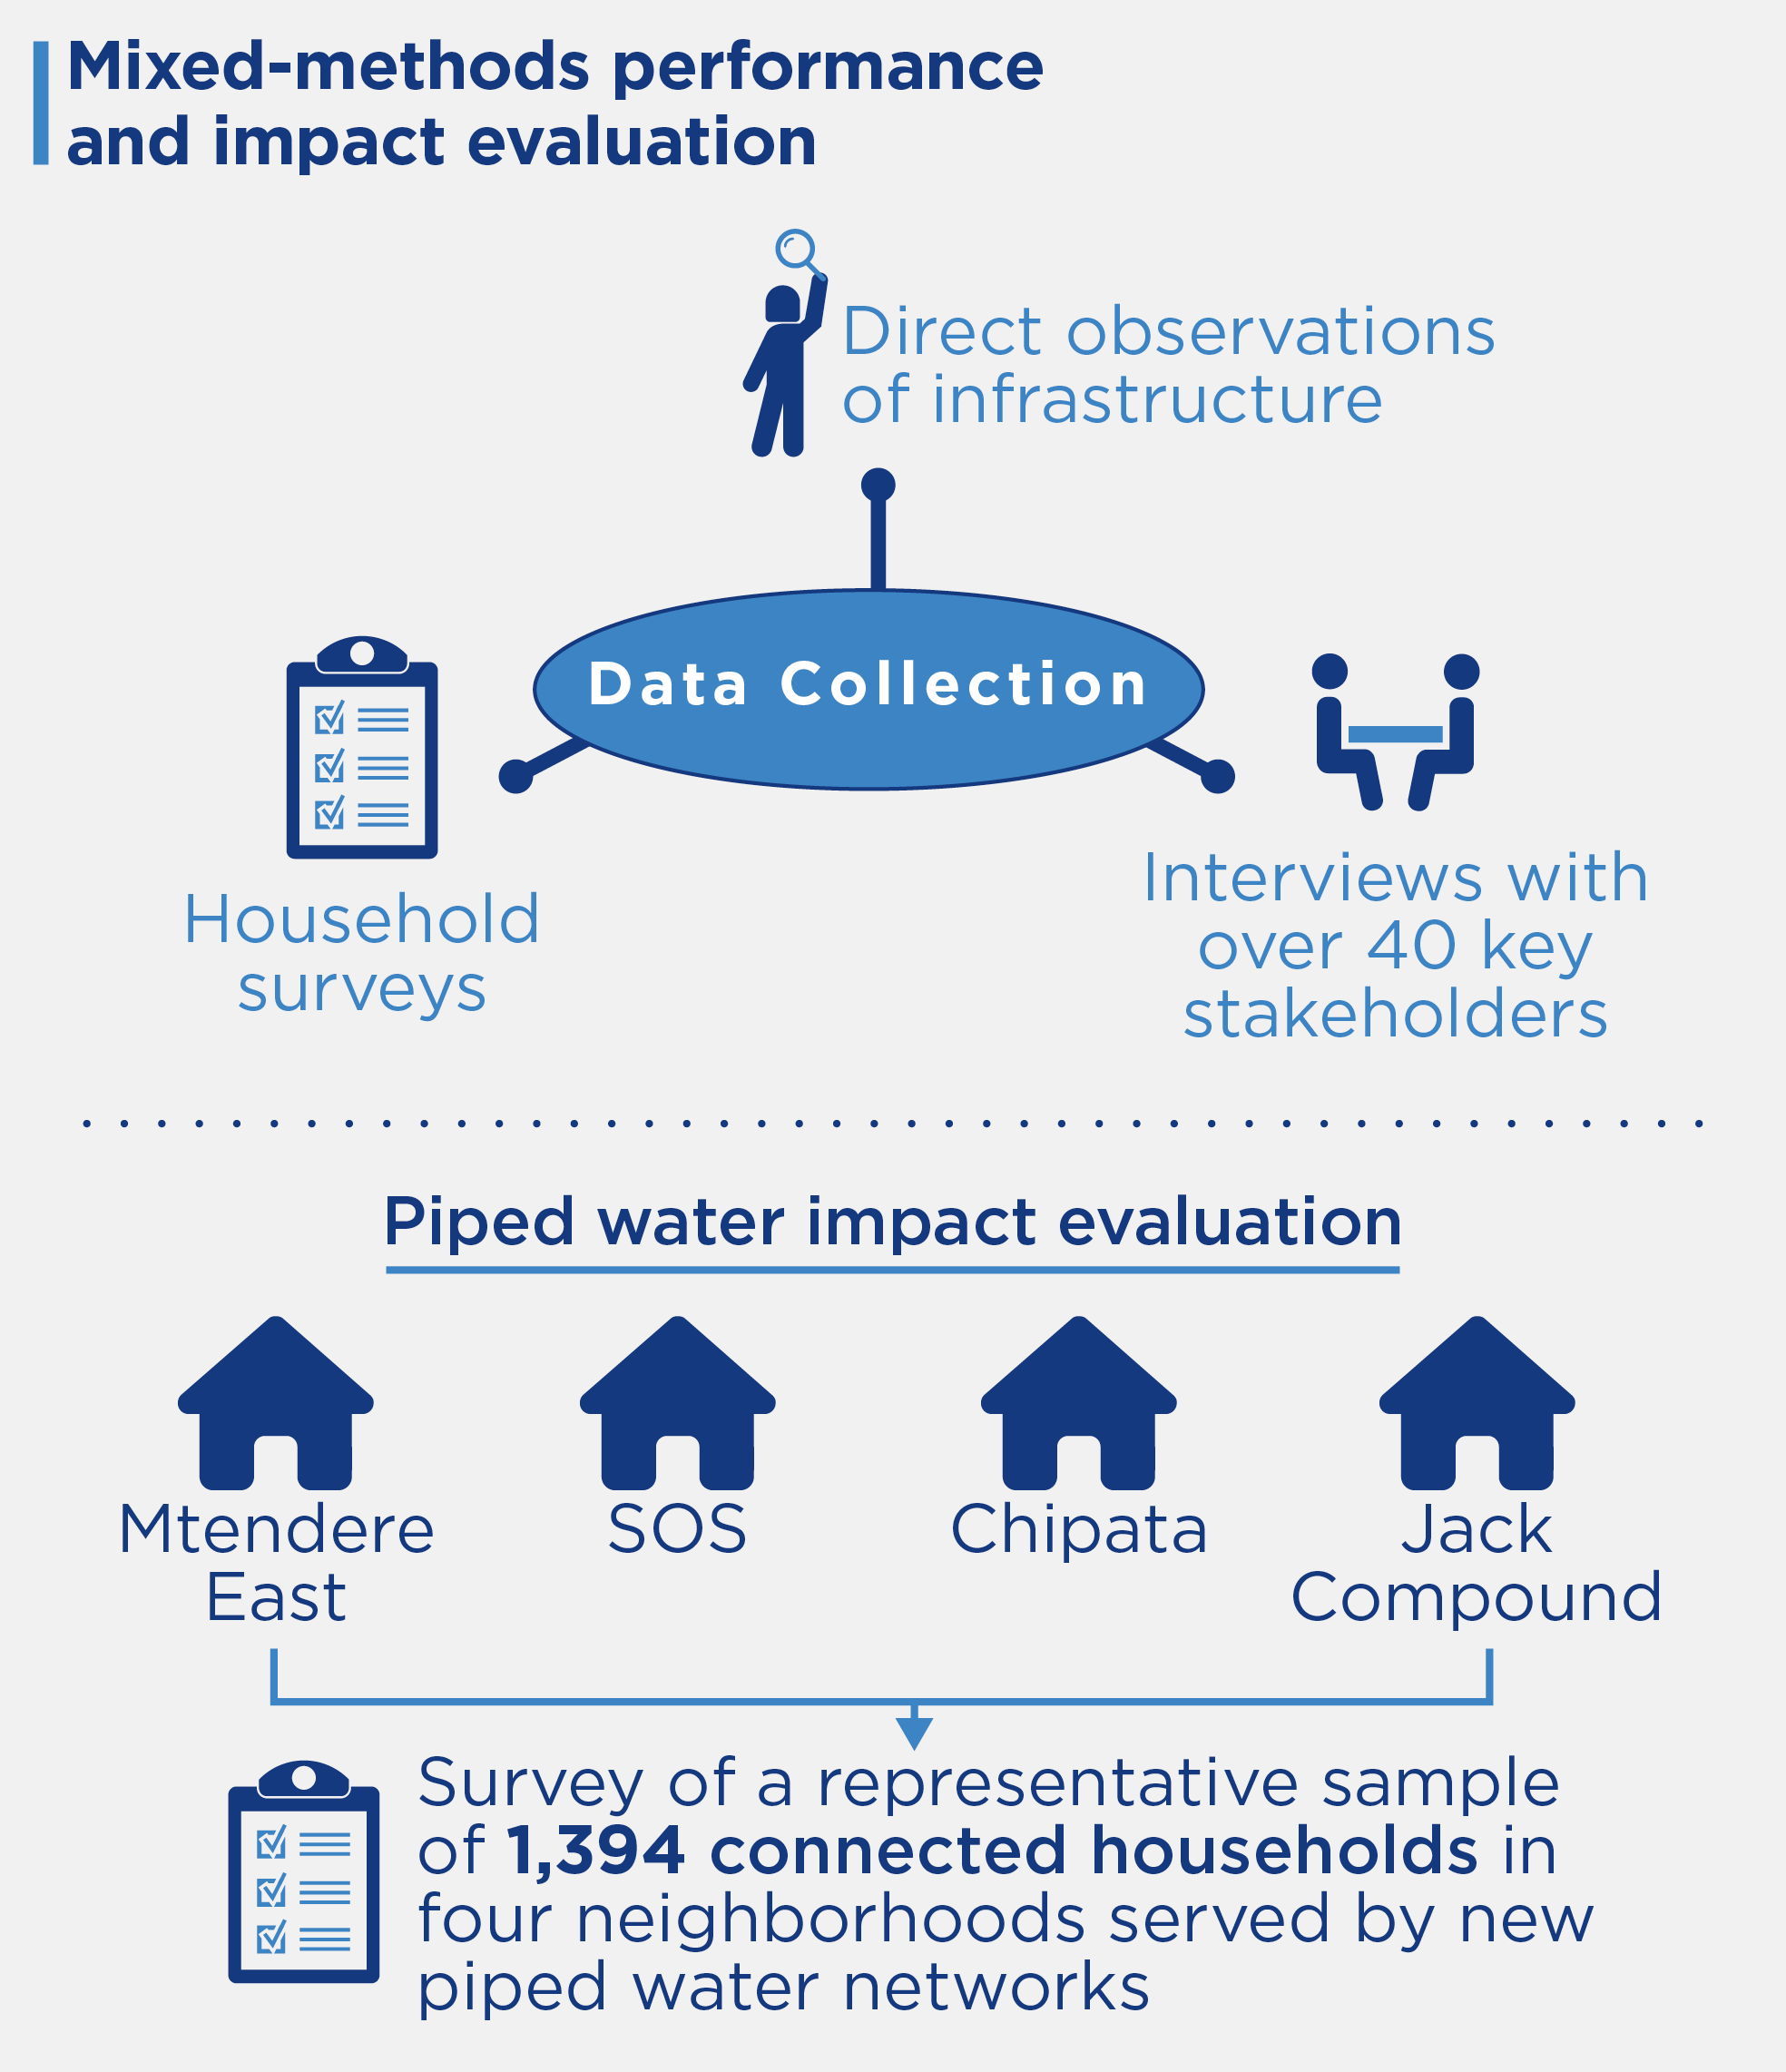
The mixed-methods performance and impact evaluation explored the effects of project activities on the water utility, the municipal government, and beneficiary households. Data sources included household surveys, interviews with over 40 key stakeholders, and direct observations of infrastructure conducted in June 2022. The impact evaluation was based on household surveys collected at baseline (2016-2017) and endline (2022).
For the piped water impact evaluation, Mathematica surveyed a representative sample of 1394 connected households in four neighborhoods served by new piped water networks (Mtendere East, SOS, Chipata, and Jack Compound) between February and June 2022. To estimate the effects of a new piped water connection on time spent collecting water and water consumption and expenditures, Mathematica used coarsened exact matching to adjust for systematic differences between connected and unconnected households. In Mtendere East and SOS, there were enough unconnected households at endline (n = 503) to be able to do contemporaneous comparisons between the two groups, whereas in Chipata and Jack Compound there were very few unconnected households at endline so impact estimates had to be based on comparisons of unconnected households at baseline in 2016 (n=1228) to connected households at endline in 2022.
The drainage household surveys (n=1019) were conducted between February and April 2022 in the same areas as the baseline, selected for their proximity to the new drainage infrastructure, which had been functional for over four years at the time of data collection. To estimate the effects of the drainage on flooding and time savings, Mathematica compared changes over time between the 2016 baseline sample (n=3140) and the 2022 endline sample (n=1019), controlling for rainfall measured at weather stations in Lusaka.
2023-002-2858