An official website of the United States government
Here’s how you know
Official websites use .gov A
.gov website belongs to an official government
organization in the United States.
Secure .gov websites use HTTPS A
lock (
) or https:// means you’ve safely connected to
the .gov website. Share sensitive information only on official,
secure websites.
Guidance
Guidance on Common Indicators
Version 4
September 14, 2021
Introduction
A focus on results is one of the core principles on which the Millennium Challenge Corporation (MCC) was founded. An important aspect of this focus is the monitoring and evaluation (M&E) of its programs. MCC and Millennium Challenge Account entities (MCAs) develop and tailor Monitoring and Evaluation Plans (M&E Plans) to each particular program and country context.
Within these country-specific plans, however, MCC uses common indicators to standardize reporting within certain sectors in order to analyze and report results to key internal and external stakeholders. This document includes guidance for MCC and MCA staff on MCC’s common indicators.
Common indicators should:
Be common to benefit streams in MCC’s common sectors[[MCC’s common sectors are: Agriculture and Irrigation; Land; Roads; Water Supply, Sanitation and Hygiene; Education; and Power.]]
Enable cross-country comparison and aggregation, where appropriate
Track program logic results, including outputs and outcomes
The common indicators in this guidance document are organized by sector. Each indicator is assigned a number which serves only as a unique identifier, it holds no other significance. The numbering of the common indicators may be non-sequential because some indicators have been retired and their assigned numbers cannot be reused. Additionally, numbering for existing indicators cannot be changed, so newer indicators must be given higher numbers. Within each sector, indicators are listed in sequential order by level (i.e., process, output, outcome categories).
At the end of each sector’s section, all indicator inputs and disaggregations are summarized for easy reference. Finally, there is an annex at the end that documents all revisions to the Common Indicator Guidance to-date.
Including Common Indicators in the M&E Plan
According to MCC’s Policy for Monitoring & Evaluation of Compacts and Threshold Programs each MCA must include all common indicators in its M&E Plan that are relevant to that country’s activities. The MCC M&E Lead assigned to each country will provide guidance on which indicators are considered relevant. However, MCAs will not be required to report on certain common indicators if MCC agrees that collecting that data would be too costly or infeasible.
MCAs should include the exact wording of the common indicator and its definition as it appears in this guidance in the M&E Plan and the Indicator Tracking Table (ITT). MCAs are encouraged to include more a detailed definition in the “Additional Information” column in the M&E Plan if there are any country-specific aspects of a common indicator.
All common indicators that are part of the program logic for a particular activity must have targets in the M&E Plan unless otherwise noted in this guidance. In other words, it may not be appropriate or necessary to set targets if certain common indicators are not part of the project logic or conditions precedent.
The common indicators should be reported to MCC in the ITT along with all other indicators in the M&E Plan. In accordance with the ITT Guidance, if any common indicator is a percentage, the inputs to that calculation must be included in the ITT as an indicator input.
Some common indicators are expected to be measured consistently across programs but may not lend themselves to (1) ITT reporting, e.g., if collected and reported as part of an independent evaluation, or (2) aggregation in the Common Indicator Report. The guidance for each common indicator specifies whether the indicator is expected to be reported in the ITT or included in the Common Indicator Report.
Disaggregating Common Indicators
Common indicators must also be reported at certain levels of disaggregation as specified in this guidance. MCAs will not be required to report on certain disaggregations where MCC agrees that disaggregating that data would be irrelevant to the investment or too costly or infeasible. For some indicators, multiple disaggregations are listed and an example is provided below as to how those multiple disaggregations should be recorded in the ITT. Targets are not required for disaggregations unless they are specifically called for in a country’s M&E Plan. For example, targets are required for the number of farmers trained, but not always for the number of male or female farmers trained.
As noted in the M&E Policy, indicators that quantify participants and beneficiaries should be sex-disaggregated to provide information about the number of men and women being served by an activity. Any common indicator that quantifies participants and beneficiaries (e.g., Farmers trained or Students participating in MCC supported education activities) must also be sex-disaggregated.
Example of multiple disaggregations:
Indicator title: Students participating in MCC supported education activities
Disaggregation: (A) Sex (Female/Male); (B) School level (Primary/Secondary/Post-secondary)
Indicator
Actual
Students participating in MCC supported education activities
1,000
Students participating in MCC supported education activities (Female)
400
Students participating in MCC supported education activities (Male)
600
Students participating in MCC supported education activities (Primary)
0
Students participating in MCC supported education activities (Secondary)
0
Students participating in MCC supported education activities (Post-secondary)
1,000
Joint Activities
Some MCC activities are conducted jointly with other organizations. For indicators where this is the case, MCA should report only MCC’s contribution to a particular common indicator. At times this will be challenging and not exact, so the calculation of the indicator and other relevant context should be documented clearly in the M&E Plan.
Attribution
MCC uses these common indicators to report on results; however, MCC recognizes that at the outcome level, it is difficult to attribute changes in some of these indicators to MCC investments. This is because many other factors can influence these outcomes. Therefore, MCC will be explicit in its reporting about which changes in outcome indicators are more likely the result of MCC investments and which changes are trends taking place that could be the result of MCC investments as well as other interventions. MCAs are encouraged to use the notes column in the ITT or in an ITT Progress Report to note such context.
Female Ownership
MCC uses the standard definition for “women (or female) owned business or enterprise” as a business that is no less than 51 percent unconditionally and directly owned and controlled by one or more women. A family enterprise where a man and a woman each own 50 percent of the assets is not a woman owned enterprise and cannot be counted as such. Furthermore, the word “control” relates to management and it requires that both the long-term decision making and the day-to-day management and administration of the business operations must be conducted by one or more women.
Agriculture and Irrigation
Process Indicators
(AI-5) Temporary employment generated in irrigation
Units: Number
Definition: The number of people temporarily employed or contracted by MCA- contracted construction companies to work on construction of irrigation systems.
Guidance: This indicator counts the number of people contracted, not the amount of time that those people were temporarily employed. Even if a person was contracted for 1 day, he/she should be counted. Both local and foreign workers should be included. Informal employment generated by construction activities is not included.
Level: Process Indicator
Classification: Cumulative
Disaggregation: Sex (Female/Male)
Targets: Not required
ITT: Yes
Common Indicator Report: Yes
Output Indicators
(AI-6) Farmers trained[[USG Feed the Future (FTF) Indicator 4.5.2-7]]
Units: Number
Definition: The number of primary sector producers (farmers, ranchers, fishermen, and other primary sector producers) receiving technical assistance or participating in a training session (on improved production techniques and technologies, including post-harvest interventions, developing business, financial, or marketing planning, accessing credit or finance, or accessing input and output markets).
Guidance: Each country should define clearly what it means to “train” a farmer taking into consideration the desired result of training or technical assistance. This should be documented in the Additional Information column of the indicator definition table in the M&E Plan. An individual who receives training or technical assistance multiple times should be counted only once, as one individual trained.
Note that the list of training types listed in the definition is not exhaustive.
Level: Output Indicator
Classification: Cumulative
Disaggregation: Sex (Female/Male)
ITT: Yes
Common Indicator Report: Yes
(AI-7) Enterprise assisted[[USG Feed the Future (FTF) Indicator 4.5.2-11]]
Units: Number
Definition: The number of enterprises; producer, processing, and marketing organizations; water users associations; trade and business associations; and community-based organizations receiving assistance.
Guidance: This assistance includes interventions that focus on enterprise or association/cooperative functions, such as processing, marketing, or any downstream techniques, as well as managerial and financial practices. In the case of training or assistance to associations or cooperatives, if the intervention focuses on the associative functions, such as the management or strategic planning of the association as a whole, individual members are not counted separately, but as one entity. If the training or technical assistance is provided to a group of enterprises but focuses on productive functions at the individual enterprise level, each enterprise is counted separately. An individual can be considered an enterprise.
Level: Output Indicator
Classification: Cumulative
Disaggregation: Sex (Female/Male)(ownership)
ITT: Yes
Common Indicator Report: Yes
(AI-8) Hectares under improved irrigation
Units: Hectares
Definition: The number of hectares served by existing or new irrigation infrastructure that are either rehabilitated or constructed with MCC funding.
Guidance: This indicator reports on the number of hectares affected by infrastructure interventions once they have been completed. The indicator includes all hectares within the service area of an improved irrigation system regardless of whether or not they are under production.
Level: Output Indicator
Classification: Cumulative
Disaggregation: None
ITT: Yes
Common Indicator Report: Yes
(AI-9) Loan borrowers
Units: Number
Definition: The number of borrowers (primary sector producers, rural entrepreneurs, and associations) who access loans for on-farm, off-farm, and rural investment through MCC financial assistance.
Guidance: This indicator does not include loan borrowers that receive loans indirectly as the result of an MCC land activity. If the borrower receives more than one loan, he/she should be counted only once.
Level: Output Indicator
Classification: Cumulative
Disaggregation: Sex (Female/Male)
ITT: Yes
Common Indicator Report: Yes
(AI-10) Value of agricultural and rural loans[[USG Feed the Future (FTF) Indicator 4.5.2-29]]
Units: US Dollars
Definition: The value of agricultural loans and rural loans disbursed for on-farm, off- farm, and rural investments.
Guidance: Loans and credit can be extended to producers and agribusinesses by financial institutions such as commercial banks, government banks, non-bank financial institutions, financial NGOs and input suppliers, or equity financing. Only MCC’s contribution to the loan should be counted. This indicator does not include the value of loans provided indirectly as the result of an MCC land activity. Loan guarantees should be accounted for separately from this indicator. Loan values should be converted to USD using the exchange rate on the date that the loan was disbursed. If the exact date of disbursement is not known, the average exchange rate during the month of disbursement should be used.
Level: Output Indicator
Classification: Cumulative
Disaggregation: Sex (Female/Male)
ITT: Yes
Common Indicator Report: Yes
Outcome Indicators
(AI-11) Farmers who have applied improved practices as a result of training[[USG Feed the Future (FTF) Indicator 4.5.2-5]]
Units: Number
Definition: The number of primary sector producers (farmers, ranchers, fishermen, and other primary sector producers) that are applying new production or managerial techniques introduced or supported by MCC training or technical assistance, such as input use, production techniques, irrigation practices, post- harvest treatment, farm management techniques, or marketing strategies.
Guidance: This indicator should be directly linked to the indicator on number of farmers trained (AI-6). Each country should define clearly what it means to “apply an improved technique,” taking into consideration the specific training or technical assistance being provided. This should be documented in the Additional Information column of the indicator definition table in the M&E Plan. In the case where a farmer applies more than one improved technique, the farmer is counted only once.
Level: Outcome Indicator
Classification: Cumulative
Disaggregation: Sex (Female/Male)
ITT: Yes
Common Indicator Report: Yes
(AI-12) Hectares under improved practices as a result of training[[USG Feed the Future (FTF) Indicator 4.5.2-2]]
Units: Hectares
Definition: The number of hectares on which farmers are applying new production or managerial techniques introduced or supported by MCC, such as input use, production techniques, irrigation practices, post-harvest treatment, farm management techniques, or marketing strategies.
Guidance: This indicator is directly linked to the indicator capturing the number of farmers who applied improved practices (AI-11) when new techniques are crop related. Note that this indicator is cumulative over the period of evaluation and any piece of land that was under improved practices for any period of time should be counted once. Example methods of calculation:
Spot checks on a random sample of plots 1 year after training find that 60% of the hectares surveyed are using improved technology. Assuming a sufficiently large sample was surveyed, this figure would be used to extrapolate the Ha for the total population and the indicator would report [.6*Total Ha under production of farmers trained].
Follow-up surveys with trained farmers might allow for the calculation of the exact number of Ha under improved technology. If later rounds of follow-up surveys are conducted, any additional Ha of land under improved practices that were not previously counted, would be added to the previous indicator value.
Level: Outcome Indicator
Classification: Cumulative
Disaggregation: None
ITT: Yes
Common Indicator Report: Yes
(AI-13) Enterprises that have applied improved techniques[[USG Feed the Future (FTF) Indicator 4.5.2-28]]
Units: Number
Definition: The number of rural enterprises; producer, processing, and marketing organizations; water users associations; trade and business associations; and community-based organizations that are applying managerial or processing techniques introduced or supported by MCC.
Guidance: This indicator should be directly linked to the indicator of number of enterprises assisted (AI-7). In the case where an enterprise applies more than one improved technique, the enterprise is counted only once. Each country should define clearly what it means to “apply an improved technique” taking into consideration the specific training or technical assistance being provided. This should be documented in the Additional Information column of the indicator definition table in the M&E Plan.
Level: Outcome Indicator
Classification: Cumulative
Disaggregation: Sex (Female/Male) (ownership)
ITT: Yes
Common Indicator Report: Yes
Agriculture and Irrigation Common Indicator Inputs and Disaggregations
(AI-5) Temporary employment generated in irrigation
AI-5.1 Temporary employment generated in irrigation (Female)
AI-5.2 Temporary employment generated in irrigation (Male)
(AI-6) Farmers trained
AI-6.1 Famers trained (Female)
AI-6.2 Farmers trained (Male)
(AI-7) Enterprises assisted
AI-7.1 Enterprises assisted (Female)
AI-7.2 Enterprises assisted (Male)
(AI-8) Hectares under improved irrigation
(AI-9) Loan borrowers
AI-9.1 Loan borrowers (Female)
AI-9.2 Loan borrowers (Male)
(AI-10) Value of agricultural and rural loans
AI-10.1 Value of agricultural and rural loans (Female)
AI-10.2 Value of agricultural and rural loans (Male)
(AI-11) Farmers who have applied improved practices as a result of training
AI-11.1 Farmers who have applied improved practices as a result of training (Female)
AI-11.2 Farmers who have applied improved practices as a result of training (Male)
(AI-12)Hectares under improved practices as a result of training
(AI-13) Enterprises that have applied improved techniques
AI-13.1 Enterprises that have applied improved techniques (Female)
AI-13.2 Enterprises that have applied improved techniques (Male)
Land
Output Indicators
(L-1) Legal and regulatory reforms adopted
Units: Number
Definition: The number of specific pieces of legislation or implementing regulations adopted by the compact country and attributable to compact support.
Guidance: To date, adopted reforms have focused on amendments to existing property and land laws, and on new land tenure laws and implementing regulations, including streamlining procedures and recognition of land rights for women, communities and informal settlements. The indicator may include reforms at either national or lower levels. Each new or revised law should be counted as one unit.
Multiple amendments to the same law should not be counted separately.
Level: Output Indicator
Classification: Cumulative
Disaggregation: None
ITT: Yes
Common Indicator Report: Yes
(L-2) Land administration offices established or upgraded
Units: Number
Definition: The number of land administration and service offices or other related facilities that the project physically establishes or upgrades.
Guidance: This includes construction or rehabilitation of offices and the hiring of new staff to support the office or the installation of equipment or software, including IT equipment, office equipment, aerial or satellite imagery, software and geodetic equipment. The office is considered established or upgraded after construction, the provision and installation of equipment and the mobilization of new staff as required to be functional. The M&E plan should indicate in the Additional Information column of the indicator definition table at what level or point of completion across all sub-activities the office establishment or upgrade is considered complete.
Level: Output Indicator
Classification: Cumulative
Disaggregation: None
ITT: Yes
Common Indicator Report: Yes
(L-3) Stakeholders trained
Units: Number
Definition: The number of public officials, traditional authorities, project beneficiaries and representatives of the private sector, receiving formal on-the-job land training or technical assistance regarding registration, surveying, conflict resolution, land allocation, land use planning, land legislation, land management or new technologies.
Guidance: Sensitization and other public outreach events do not count as training. The curricula, length, method and intensity of training programs vary from compact to compact and may include workshops, seminars, study trips, or courses. Each country should define clearly what it means to “train” a stakeholder taking into consideration the desired result of training. This should be documented in the Additional Information column of the indicator definition table in the M&E Plan. An individual who receives training or technical assistance multiple times should be counted only once, as one individual trained.
Level: Output Indicator
Classification: Cumulative
Disaggregation: Sex (Female/Male)
ITT: Yes
Common Indicator Report: Yes
(L-4) Conflicts successfully mediated
Units: Number
Definition: The number of disputed land and property rights cases that have been resolved by local authorities, contractors, mediators or courts with compact support.
Guidance: This may include resolution of property border disputes, disputes over existing ownership, and disputes over the right to own, inherit, use or access the property or land-based resources.[[If no activities are included in the compact to reduce conflicts, this may be tracked without targets.]]
Level: Output Indicator
Classification: Cumulative
Disaggregation: None
ITT: Yes
Common Indicator Report: Yes
(L-5) Parcels corrected or incorporated in land system
Units: Parcels
Definition: The number of parcels with relevant parcel information corrected or newly incorporated into an official land information system (whether a system for the property registry, cadaster or an integrated system).
Guidance: This may include parcel rights newly digitized, parcels with boundary revisions or ownership rights corrected, and parcels with newly formalized rights. Include only parcels corrected or incorporated directly by the project.
Level: Output Indicator
Classification: Cumulative
Disaggregation: Land zones (Rural/Urban)
ITT: Yes
Common Indicator Report: Yes
(L-6) Land rights formalized[[The household disaggregation is USG Feed the Future (FTF) Indicator 4.5.1-25]]
Units: Number
Definition: The number of household, commercial and other legal entities (e.g., NGOs, churches, hospitals) receiving formal recognition of ownership and/or use rights through certificates, titles, leases, or other recorded documentation by government institutions or traditional authorities at national or local levels.
Guidance: This can include secondary rights. The formalization process varies by project but can include the recordation or registration of a customary or informal right, as well as the regularization or adjudication of rights. Include only rights formalized directly by the project.
Level: Output Indicator
Classification: Cumulative
Disaggregation: (A) Land zones (Rural/Urban); (B) Household head (Community- owned/Male-headed household/Female-headed household/Co-headed household (Note that the disaggregations in B should be mutually exclusive and not include multiple selections.)); (C) Landholder (Household/Commercial and other legal entity)
ITT: Yes
Common Indicator Report: Yes
Outcome Indicators
(L-7) Percentage change in time for property transactions
Units: Percentage
Definition: The average percentage change in number of days for an individual or company to conduct a property transaction within the formal system.
Guidance: This indicator is designed to refer to duration of time in calendar days and not time spent on a task. It includes all informal and formal steps to register a property for the first time or transfer a property between owners or users.[[Registry is the final step, but time should incorporate all steps necessary for property registration or transfer including related time spent by the notary, cadastral, registry and other relevant offices.]] Transactions can include first time registration (for those parcels not directly registered by the project) or secondary transactions through sales.[[Other transfers such as inheritances and gifts can be tracked by the M&E plan but should not be included as part of this common indicator.]] Secondary transactions can include transfers, mortgages, or legal conflicts. The Additional Information column in the indicator definition table should clearly state which type(s) of transactions are being tracked as part of this indicator. This indicator should be calculated as the average of the Percentage change in time for each type of property transaction. Time is tracked for the same transaction per country as defined in the M&E Plan, depending on the specific compact activities. Time reductions are usually the result of legal, regulatory, or procedural improvements, introduction of new or modified information management systems, or introduction of new facilities or equipment. The data should be collected by administrative data or survey if available or feasible. If from survey data, the question and methods should be informed by other MCA surveys. Indicator inputs should be used to track the actual number of days in order to calculate the percentage change.
Level: Outcome Indicator
Classification: Level
Disaggregation: (A) Customer class (Commercial/Non-commercial)
ITT: Yes
Common Indicator Report: No
(L-7.1) Percentage change in time for property transactions (First time registration)
Units: Percentage
Definition: The average percentage change in number of days for an individual or company to conduct a first-time registration property transaction within the formal system.
Guidance: In order for this indicator to be properly calculated, a baseline figure for Time for first time registration property transactions is required. Numerator = Time for property transactions (First time registration) (L-7.2) – the baseline for Time for property transactions (First time registration). Denominator = Baseline for Time for property transactions (First time registration).
Level: Outcome
Classification: Level
Disaggregation: None
ITT: Yes
Common Indicator Report: No
(L-7.2) Time for property transactions (First time registration)
Units: Days
Definition: The average number of days for an individual or company to conduct a first-time registration property transaction within the formal system.
Level: Outcome
Classification: Level
Disaggregation: None
ITT: Yes
Common Indicator Report: No
(L-7.3) Percentage change in time for property transactions (Secondary transactions)
Units: Percentage
Definition: The average percentage change in number of days for an individual or company to conduct a secondary property transaction within the formal system.
Guidance: Secondary transactions can include transfers, mortgages, or legal conflicts. The specific types of secondary transactions being tracked should be included in the Additional Information column of the indicator definition table in the M&E Plan. In order for this indicator to be properly calculated, a baseline figure for Time for secondary property transactions is required. Numerator = Time for property transactions (Secondary transactions) (L-7.2) – the baseline for Time for property transactions (Secondary transactions). Denominator = Baseline for Time for property transactions (Secondary transactions).
Level: Outcome
Classification: Level
Disaggregation: None
ITT: Yes
Common Indicator Report: No
(L-7.4) Time for property transactions (Secondary transactions)
Units: Days
Definition: The average number of days for an individual or company to conduct a secondary property transaction within the formal system.
Level: Outcome
Classification: Level
Disaggregation: None
ITT: Yes
Common Indicator Report: No
Land Common Indicator Inputs and Disaggregations
(L-1) Legal and regulatory reforms adopted
(L-2) Land administration offices established or upgraded
(L-3) Stakeholders trained
L-3.1 Stakeholders trained (Female)
L-3.2 Stakeholders trained (Male)
(L-4) Conflicts successfully mediated
(L-5) Parcels corrected or incorporated in land system
L-5.1 Parcels corrected or incorporated in land system (Rural)
L-5.2 Parcels corrected or incorporated in land system (Urban)
(L-6) Land rights formalized
L-6.1 Land rights formalized (Rural)
L-6.2 Land rights formalized (Urban)
L-6.3 Land rights formalized (Community-owned)
L-6.4 Land rights formalized (Female-headed household)
L-6.5 Land rights formalized (Male-headed household)
L-6.6 Land rights formalized (Co-headed household)
L-6.7 Land rights formalized (Household)
L-6.8 Land rights formalized (Commercial and other legal entity)
(L-7) Percentage change in time for property transactions
L-7.1 Percentage change in time for property transactions (First time registration)
L-7.2 Time for property transactions (First time registration)
L-7.3 Percentage change in time for property transactions (Secondary transactions)
L-7.4 Time for property transactions (Secondary transactions)
L-7.5 Percentage change in time for property transactions (Commercial)
L-7.6 Percentage change in time for property transactions (Non-commercial)
Transportation
General Program Logic for Transportation Investments
As illustrated in the figure below, the key outcome (or Objective) of most MCC investments in transportation is reductions in transportation costs for road users. These reductions are achieved by investments in road construction (such as new sections or upgrades), road rehabilitation (fixing badly degraded roads), periodic road maintenance works (preventive maintenance to avoid costly rehabilitation), road improvement (such as widening or realignment), or road maintenance technical assistance. Complementary bridge structures may be included too, as relevant. These investments improve the quality of the road(s), as measured through characteristics of the road, such as its roughness. Improved road quality means vehicles can move at faster speeds along the road, reducing the amount of time drivers, passengers and cargo spend travelling from one place to another, valued at the cost of their time. Improved road quality also means other vehicle operating costs, such as wear and tear on the vehicle from bouncing up and down, are reduced. This time savings and reduced vehicle operating costs contribute to increased incomes for existing users of the road. Users that typically use other routes may change to use the route where MCC invested (diverted traffic), saving costs over the old routes. Finally, there may be new road trips as a result of the investment: users that did not find the value of travelling on the road to be worth the cost prior to the investment, but now consider it worth it, or users that used the road previously but are now making more trips (generated/induced traffic).
Definitions:
Primary: Includes national or main trunk networks
Secondary: Includes regional, departmental or state networks
Tertiary: Includes rural and community roads, tracks and trails
Key Routes: The most frequent origin-destination pairs for road users; determined through an origin-destination survey.
Road cross-section: the geometric configuration that defines the width of the roadway from ditch to ditch on the sides, including shoulders, sidewalks, driving lanes, etc.
Homogeneous segment: A road segment with the same cross-section
Road centerline: The center of a given cross-section of the road. No matter what direction the road takes, the centerline is always kept.
Lane-kilometers: Measuring the total km of lanes. Counting the kilometers of each lane separately and adding them together, as if each lane was its own road. For example, if you have a 100 km road with two lanes, it is 200 lane-km.
Notes:
The list does not include a common indicator for accidents and injuries, as we are still working out what is best. Ideally, it will be linked to the iRAP assessment that is part of many investments. Once an indicator proves useful, we will need to add it to the list.
Indicators are not required to be disaggregated by homogenous segment for the ITT, but this level of detail will be necessary for evaluation. All indicators below refer to roads constructed, rehabilitated, maintained and improved unless stated otherwise. See descriptions in the program logic section.
Common Indicators[[The Transportation common indicators were previously referred to as “Roads” common indicators and retain numbering that begins with “R-”.]]
Process Indicators
(R-3) Kilometers of roads under design
Units: Kilometers
Definition: The length of roads in kilometers (measured regardless of number of lanes) under design contracts.
Guidance: This indicator refers to the centerline (the line in the middle of the roadway), and not lane-kilometers (counting the kilometers of each lane separately). This should include all roads under design with MCC funding, even roads that MCC is not planning to build.
Level: Process Indicator
Classification: Cumulative
Disaggregation: Road class (Primary/Secondary/Tertiary), Investment type (Construction/Rehabilitation/Periodic maintenance/Improvement)
ITT: Yes
Common Indicator Report: Yes
(R-6) Kilometers of roads under works contracts
Units: Kilometers
Definition: The length of roads in kilometers (measured regardless of number of lanes) under works contracts for MCC roads investments.
Guidance: This indicator refers to the centerline, not lane-kilometers.
Level: Process Indicator
Classification: Cumulative
Disaggregation: Road class (Primary/Secondary/Tertiary); Investment type (Construction/Rehabilitation/Periodic maintenance/Improvement)
ITT: Yes
Common Indicator Report: Yes
(R-7) Temporary employment generated in road construction
Units: Number
Definition: The number of people temporarily employed or contracted by MCA-contracted construction companies to work on MCC roads investments.
Guidance: This indicator counts the number of unique people contracted, not the amount of time that those people were temporarily employed. Even if a person was contracted for 1 day, he/she should be counted. Both local and foreign workers should be included. Informal employment generated by these activities is not included. Procurement documents may state a target for women’s employment that can be used as a target for this indicator.
Level: Process Indicator
Classification: Cumulative
Disaggregation: Sex (Female/Male)
Targets: Not required
ITT: Yes
Common Indicator Report: Yes
(R-12) Vehicle operating cost files saved
Units: Date
Definition: Date by which the vehicle operating cost files have been received and saved by MCC.
Guidance: These are important to hand over to the independent evaluator, hence their inclusion as an indicator. These costs are typically collected as part of project design. They may be collected as primary data during project design, or project design may use existing data from the relevant government transportation entity. There is typically one set of files per country. The location of where they are saved at MCC should be noted in the Indicator Tracking Table. If the files are received prior to EIF, the date of EIF should be used.
Level: Process Indicator
Classification: Date
Disaggregation: None
ITT: Yes
Common Indicator Report: No
Output Indicators
(R-8) Kilometers of roads completed[[USG Feed the Future (FTF) Indicator 4.5.1-17. Any Km of road reported to FTF through this indicator must connect rural-based production (such as agriculture) with population centers and market activity.]]
Units: Kilometers
Definition: The length of roads in kilometers (measured regardless of number of lanes) on which an MCC investment is complete (certificates handed over and approved).
Guidance: This indicator refers to the centerline, not lane-kilometers. Be sure to exclude kilometers of bridges (R-14), so as not to double-count.
Level: Output Indicator
Classification: Cumulative
Disaggregation: Road class (Primary/Secondary/Tertiary); Investment type (Construction/Rehabilitation/Periodic maintenance/Improvement)
ITT: Yes
Common Indicator Report: Yes
(R-13) Lane-kilometers completed
Units: Kilometers
Definition: The length of lanes in kilometers on which MCC investment is complete (certificates handed over and approved).
Guidance: Include only lanes for vehicles.
Level: Output Indicator
Classification: Cumulative
Disaggregation: Road class (Primary/Secondary/Tertiary); Investment type (Construction/Rehabilitation/Periodic maintenance/Improvement)
ITT: Yes
Common Indicator Report: Yes
(R-14) Meters of bridges completed
Units: Meters
Definition: The length of bridges measured along the centerline in meters on which construction of new bridges or reconstruction, rehabilitation, resurfacing or upgrading of existing bridges is complete (certificates handed over and approved).
Guidance: Bridges cross water – structures that do not cross water (for example, an overpass) should not be included.
Level: Output Indicator
Classification: Cumulative
Disaggregation: Road class (Primary/Secondary/Tertiary); Investment type (Construction/Rehabilitation/Periodic maintenance/Improvement)
ITT: Yes
Common Indicator Report: Yes
(R-15) As-built drawings received
Units: Date
Definition: Date by which all as-built drawings have been received and saved by MCC.
Guidance: These are important to hand over to the independent evaluator, hence their inclusion as a reference indicator. These drawings come from the construction firms and will be ready a few months after completion. The files are large and may require special arrangements. The location of where they are saved at MCC should be noted in the Indicator Tracking Table. Every contractor will submit a set. The date should only be recorded once all drawings have been received.
Level: Output Indicator
Classification: Date
Disaggregation: None
ITT: Yes
Common Indicator Report: No
(R-26) People trained in network prioritization
Units: Number
Definition: The number of people trained in network prioritization, including prioritization using HDM-4, RED, and HMIS.
Guidance: May want to consider disaggregation by ministry/institution if it would be useful to know who is being targeted for the training. Each country should define clearly what it means to “train” a stakeholder taking into consideration the desired result of training. This should be documented in the Additional Information column of the indicator definition table in the M&E Plan. An individual who receives training or technical assistance multiple times should be counted only once, as one individual trained.
Level: Output Indicator
Classification: Cumulative
Disaggregation: Sex (Female/Male)
ITT: Yes
Common Indicator Report: Yes
Output/Outcome Indicators
(R-9) International Roughness Index
Units: Meters per kilometer
Definition: The measure of the roughness of the road surface, in meters of height per kilometer of distance traveled.
Guidance: If MCC invested directly in improving road roughness, this should be an output immediately after completion (see note on timing below) and an outcome subsequently, as it is an indicator of adequate maintenance over time.
This should be measured in the outer wheel path of each lane by a Class 3 or better (Class 1, Class 2) device. The device, device class, standard (for example: “ASTM” - American Standard for Testing and Materials) and data processing software used must be specified. The device should be validated for precision and bias prior to measurement. Data should be reported at 10m intervals.
A lower value means a smoother road.
Typically, a paved road will have an IRI of 3m/km or lower, while an impassible road will have an IRI of greater than 14m/km.
Timing: Right after completion, this measurement is typically done by the contractor in the Final Construction Report, Take Over Certificates or Defects Notifications Period Report. This is considered the output indicator measurement. Subsequent measures are outcome measures.
Level: Output/Outcome Indicator
Classification: Level
Disaggregation: Road class (Primary/Secondary/Tertiary)
ITT: No
Common Indicator Report: No
Outcome Indicators
(R-10) Average annual daily traffic
Units: Number
Definition: The average number and type of vehicles per day, averaged over different times (day and night) and over different seasons to arrive at an annualized daily average.
Guidance: In cases where it is not economically feasible to collect average annual daily traffic in each road segment, a representative sample of segments may be selected, but the sampling strategy should be thoroughly documented. Raw data and government adjustment factors should be noted separately. Sample locations shall be representative of the of the segment's traffic flow.
Minimum vehicle class categories are non-motorized traffic, motorcycles, passenger cars, light trucks, medium/heavy trucks, mini-buses, and heavy buses.
For each traffic count station, note the day(s) of the week collected, hours collected each day, and the geo-code.
Level: Outcome Indicator
Classification: Level
Disaggregation: Road class (Primary/Secondary/Tertiary)
ITT: Maybe, if available annually
Common Indicator Report: No
(R-11) Road traffic fatalities
Units: Number
Definition: The number of road traffic fatalities per year on roads constructed, rehabilitated, improved or maintained with MCC funding.
Guidance: When reporting this indicator, it should be compared to the average annualized daily traffic multiplied by 365 days.
Level: Outcome Indicator
Classification: Level
Disaggregation: Sex (Female/Male)
Targets: Not required
ITT: No
Common Indicator Report: No
(R-16) Average daily road users
Units: Number
Definition: The average number of road users per day, averaged over different times (day and night) and over different seasons to arrive at an annualized daily average.
Guidance: Number of drivers may come from a traffic count, number of passengers often collected as part of an origin-destination survey.
Level: Outcome Indicator
Classification: Level
Disaggregation: Vehicle type (at a minimum: Non-motorized traffic, Motorcycles, Passenger cars, Light trucks, Medium/heavy trucks, Mini-buses, and Heavy buses); Key routes (see introduction for definition)
ITT: No
Common Indicator Report: No
(R-17) Travel time
Units: Minutes
Definition: Average amount of time it takes to travel a key route.
Guidance: Often collected as part of an origin-destination survey. These are reported times, not the travel times modelled by HDM-4. Note the day of the week, time of day, and season, if relevant, of data collection.
Level: Outcome Indicator
Classification: Level
Disaggregation: Vehicle type (at a minimum: Non-motorized traffic, Motorcycles, Passenger cars, Light trucks, Medium/heavy trucks, Mini-buses, and Heavy buses); Key routes
ITT: No
Common Indicator Report: No
(R-18) Travel speed
Units: Kilometers per hour
Definition: Average actual speed of a vehicle travelling the full road segment, including any time stopped for/by congestion, traffic lights, and/or traffic control people.
Guidance: Note the day of the week and time of day in the Evaluation Design Report. And season, if relevant.
Level: Outcome Indicator
Classification: Level
Disaggregation: Vehicle type (at a minimum: Non-motorized traffic, Motorcycles, Passenger cars, Light trucks, Medium/heavy trucks, Mini-buses, and Heavy buses); Key routes
ITT: No
Common Indicator Report: No
(R-19) Trip purpose – business
Units: Percentage
Definition: Number of road users travelling for business (work or commuting to/from work) (numerator) out of the total number of road users travelling (denominator), expressed as a percentage.
Guidance: Often collected as part of an origin-destination survey.
Level: Outcome Indicator
Classification: Level
Disaggregation: Key routes
ITT: No
Common Indicator Report: No
(R-20) Trip purpose - leisure
Units: Percentage
Definition: Number of road users travelling for leisure (visiting family/friends, entertainment) (numerator) out of the total number of road users travelling (denominator), expressed as a percentage.
Guidance: Often collected as part of an origin-destination survey.
Level: Outcome Indicator
Classification: Level
Disaggregation: Key routes
ITT: No
Common Indicator Report: No
(R-21) Cargo weight
Units: Kilograms
Definition: Average weight, measured in kilograms, of cargo being transported in a vehicle using the road.
Guidance: Often collected as part of an origin-destination survey or from truck monitoring data (i.e., weigh stations), with the latter being more reliable.
Level: Outcome Indicator
Classification: Level
Disaggregation: Vehicle type (at a minimum: Non-motorized traffic, Motorcycles, Passenger cars, Light trucks, Medium/heavy trucks, Mini-buses, and Heavy buses); Trade type (Import/Export/Domestic); Key routes; Cargo type (International Standard Industrial Classification of All Economic Activities (ISIC) Broad Structure[[https://unstats.un.org/unsd/publication/seriesm/seriesm_4rev4e.pdf, page 43]]); Direction of travel
ITT: No
Common Indicator Report: No
(R-22) Cargo value
Units: US Dollars
Definition: Average value in US dollars of cargo being transported in a vehicle using the road.
Guidance: Often collected as part of an origin-destination survey or from truck monitoring data (i.e., respondents to a survey at weigh stations), with the latter being more reliable. The exchange rate used to calculate cargo value should be documented where results are reported (for example, the final evaluation report). Exchange rate should align with the year the costs are measured.
Level: Outcome Indicator
Classification: Level
Disaggregation: Trade type (Import/Export/Domestic); Key routes; Cargo type (International Standard Industrial Classification of All Economic Activities (ISIC) Broad Structure[[https://unstats.un.org/unsd/publication/seriesm/seriesm_4rev4e.pdf, page 43]]); Direction of travel
ITT: No
Common Indicator Report: No
(R-23) Cost of transportation
Units: US Dollars/kilometer
Definition: The estimated cost of using the road in USD per kilometer, by vehicle type.
Guidance: Note that this is the cost, not the price. Typically modelled by HDM-4 or RED, and includes all costs such as the cost of driver, passenger and cargo time, wear and tear on the vehicle leading to maintenance/replacement parts, fuel, etc. This is the key outcome measure for most transportation investments.
Level: Outcome Indicator
Classification: Level
Disaggregation: Vehicle type (at a minimum: Non-motorized traffic, Motorcycles, Passenger cars, Light trucks, Medium/heavy trucks, Mini-buses, and Heavy buses); Investment type (Construction/Rehabilitation/Periodic maintenance/Improvement)
ITT: No
Common Indicator Report: No
(R-24) Average vehicle weights
Units: Metric tons
Definition: Average weight of an unloaded vehicle, in metric tons, of each vehicle type.
Guidance: Only to be used alongside the “Cost of Transportation” indicator above for gauging comparison across countries, as the weight of a given vehicle type may vary from place to place. Note that this is the unloaded vehicle. The typical source will be the HDM-4 calibration used to model the “Cost of Transportation” indicator, which will likely come from the Ministry of Transportation or similar institution in-country.
Level: Assumption/risk Indicator
Classification: Level
Disaggregation: Vehicle type (at a minimum: Non-motorized traffic, Motorcycles, Passenger cars, Light trucks, Medium/heavy trucks, Mini-buses, and Heavy buses)
ITT: No
Common Indicator Report: No
(R-25) Transport fares
Units: US Dollars
Definition: Price in US dollars of travel along a particular road for a particular route.
Guidance: Often collected as part of an origin-destination survey. This indicator is for actual prices paid by consumers. If regulated prices exist, report those separately (disaggregated). Disaggregations should provide necessary details about what the fare is for. Bus fares are typically reported as between a particular origin and destination. Taxi fares are typically reported per km. Freight fares are typically reported as the cost per ton-km.
Level: Outcome Indicator
Classification: Level
Disaggregation: Mode of transportation (Bus/Taxi/Freight/Others as applicable); Key routes; Price type (Regulated/Unregulated) (if applicable)
ITT: No
Common Indicator Report: No
(R-27) Evidenced-based maintenance planning
Units: Percentage
Definition: Number of kilometers of the whole road network for which network prioritization data is complete (numerator) over total kilometers of road in the whole network (denominator), expressed as a percentage.
Guidance: Network prioritization is the process of analyzing which maintenance investments will be most cost-effective, based on the information such as traffic counts and road deterioration. It may be completed with a variety of tools, such as HDM-4, RED, Excel.
Level: Outcome Indicator
Classification: Level
Disaggregation: None
ITT: Yes
Common Indicator Report: No
(R-27.1) Kilometers of road network with prioritization data
Units: Kilometers
Definition: Number of kilometers of the whole road network for which network prioritization data is complete.
Guidance: See R-27 for information on network prioritization.
Level: Outcome Indicator
Classification: Level
Disaggregation: None
ITT: Yes
Common Indicator Report: No
(R-27.2) Kilometers of road network (planning)
Units: Kilometers
Definition: Number of kilometers of road in the whole network.
Guidance: See R-27 for information on network prioritization.
Level: Outcome Indicator
Classification: Level
Disaggregation: None
ITT: Yes
Common Indicator Report: No
(R-28) Evidence-based maintenance execution
Units: Percentage
Definition: Number of kilometers of executed maintenance that is supported by a network prioritization (numerator) over total kilometers of road in the whole network (denominator), expressed as a percentage.
Guidance: See R-27 for information on network prioritization.
Level: Outcome Indicator
Classification: Level
Disaggregation: None
ITT: Yes
Common Indicator Report: No
(R-28.1) Kilometers of road network with evidence-based maintenance execution
Units: Percentage
Definition: Number of kilometers of executed maintenance that is supported by a network prioritization
Guidance: See R-27 for information on network prioritization.
Level: Outcome Indicator
Classification: Level
Disaggregation: None
ITT: Yes
Common Indicator Report: No
(R-28.2) Kilometers of road network (execution)
Units: Kilometers
Definition: Number of kilometers of road in the whole network.
Guidance: See R-27 for information on network prioritization.
Level: Outcome Indicator
Classification: Level
Disaggregation: None
ITT: Yes
Common Indicator Report: No
(R-29) Percentage of annual maintenance budget allocated
Units: Percentage
Definition: Amount of road maintenance funds allocated by the central government to the road maintenance agency for the year (numerator) out of the total amount requested by the national road maintenance agency for the year (denominator), expressed as a percentage.
Guidance: None
Level: Outcome Indicator
Classification: Level
Disaggregation: Maintenance type (Routine/Periodic/Emergency)
ITT: Yes
Common Indicator Report: No
(R-29.1) Annual road maintenance funds allocated
Units: US Dollars
Definition: Amount of road maintenance funds allocated by the central government to the road maintenance agency for the year.
Guidance: None
Level: Outcome Indicator
Classification: Level
Disaggregation: Maintenance type (Routine/Periodic/Emergency)
ITT: Yes
Common Indicator Report: No
(R-29.2) Requested annual maintenance budget
Units: US Dollars
Definition: Total amount requested for road maintenance from the central government by the national road maintenance agency for the year.
Guidance: None
Level: Outcome Indicator
Classification: Level
Disaggregation: Maintenance type (Routine/Periodic/Emergency)
ITT: Yes
Common Indicator Report: No
(R-30) Percentage of annual maintenance budget spent
Units: Percentage
Definition: Amount of road maintenance budget spent by the roads maintenance agency for the year (numerator) out of the amount of road maintenance funds allocated by the central government to the road maintenance agency for the year (denominator), expressed as a percentage.
Guidance: None. See R-29.1 for denominator
Level: Outcome Indicator
Classification: Level
Disaggregation: Maintenance type (Routine/Periodic/Emergency)
ITT: Yes
Common Indicator Report: No
(R-30.1) Annual road maintenance budget spent
Units: US Dollars
Definition: Amount of road maintenance budget spent by the road maintenance agency for the year
Guidance: None
Level: Outcome Indicator
Classification: Level
Disaggregation: Maintenance type (Routine/Periodic/Emergency)
ITT: Yes
Common Indicator Report: No
(R-30.2) Annual road maintenance budget allocated
Units: US Dollars
Definition: Amount of road maintenance funds allocated by the central government to the road maintenance agency for the year
Guidance: None
Level: Outcome Indicator
Classification: Level
Disaggregation: Maintenance type (Routine/Periodic/Emergency)
ITT: Yes
Common Indicator Report: No
(R-31) Road network roughness
Units: Percentage
Definition: The share of the road network that falls into country-defined categories of road roughness (for example: bad (IRI>8), poor (6<IRI<8), fair (4<IRI<6), and good (IRI<4)). Road roughness will be measured in terms of the International Roughness Index (IRI).
Guidance: The categories and corresponding IRI values will vary from country to country. Specify the categories and corresponding IRI values when reporting on the indicator.
Level: Outcome Indicator
Classification: Level
Disaggregation: Roughness level (will be country-specific, but for example: (Bad (IRI>8) / Poor (6<IRI<8) / Fair (4<IRI<6) / Good (IRI<4))
ITT: Maybe, depending on frequency of data availability
Common Indicator Report: No
(R-32) Total transportation cost savings
Units: US Dollars
Definition: Total cumulative cost savings for operating a vehicle on the road as a result of the MCC investment, as modelled by HDM-4, and expressed in monetized form.
Guidance: This includes time savings, vehicle operating cost savings, and savings from reduced accidents, as applicable. Time savings is monetized by the value of time of the road users, which is estimated taking into account local wages and the purposes of the trips on the road as measured in an origin-destination survey, where trips for work purposes are valued higher than trips for leisure purposes. Vehicle operating cost savings are the cost savings because of reduced wear and tear on the vehicle.
Level: Outcome Indicator
Classification: Cumulative
Disaggregation: Savings type (Time savings/Vehicle operating cost savings/ Accidents/Other); Investment type (Construction/Rehabilitation/Periodic maintenance/Improvement)
ITT: No
Common Indicator Report: No
(R-33) Percentage overloading
Units: Percentage
Definition: Number of trucks that are overloaded (numerator) over total number of trucks on the road (denominator), as a percentage.
Guidance: The threshold for “overloaded” will vary based on the standards in-country. Actual weights of vehicles on the road will typically come from weigh stations, which may need to be established as part of the project in order to get the necessary data.
Level: Outcome Indicator
Classification: Level
Disaggregation: Road class (Primary/Secondary/Tertiary)
ITT: No
Common Indicator Report: No
Transportation Common Indicator Inputs and Disaggregations
(R-3) Kilometers of roads under design
R-3.1 Kilometers of roads under design (Primary)
R-3.2 Kilometers of roads under design (Secondary)
R-3.3 Kilometers of roads under design (Tertiary)
R-3.4 Kilometers of roads under design (Construction)
R-3.5 Kilometers of roads under design (Rehabilitation)
R-3.6 Kilometers of roads under design (Periodic maintenance)
R-3.7 Kilometers of roads under design (Improvement)
(R-6) Kilometers of roads under works contracts
R-6.1 Kilometers of roads under works contracts (Primary)
R-6.2 Kilometers of roads under works contracts (Secondary)
R-6.3 Kilometers of roads under works contracts (Tertiary)
R-6.4 Kilometers of roads under works contracts (Construction)
R-6.5 Kilometers of roads under works contracts (Rehabilitation)
R-6.6 Kilometers of roads under works contracts (Periodic maintenance)
R-6.7 Kilometers of roads under works contracts (Improvement)
(R-7) Temporary employment generated in road construction
R-7.1 Temporary employment generated in road construction (Female)
R-7.2 Temporary employment generated in road construction (Male)
(R-8) Kilometers of roads completed
R-8.1 Kilometers of roads completed (Primary)
R-8.2 Kilometers of roads completed (Secondary)
R-8.3 Kilometers of roads completed (Tertiary)
R-8.4 Kilometers of roads completed (Construction)
R-8.5 Kilometers of roads completed (Rehabilitation)
R-8.6 Kilometers of roads completed (Periodic maintenance)
R-14.5 Meters of bridges completed (Rehabilitation)
R-14.6 Meters of bridges completed (Periodic maintenance)
R-14.7 Meters of bridges completed (Improvement)
(R-15) As-built drawings received
(R-16) Average daily road users
R-16.1 Average daily road users (Non-motorized traffic)
R-16.2 Average daily road users (Motorcycles)
R-16.3 Average daily road users (Passenger cars)
R-16.4 Average daily road users (Light trucks)
R-16.5 Average daily road users (Medium/heavy trucks)
R-16.6 Average daily road users (Mini-buses)
R-16.7 Average daily road users (Heavy buses)
R-16.8 Average daily road users (Key routes)[[Key route disaggregations do not require unique common indicator codes in the M&E Plan.]]
(R-17) Travel time
R-17.1 Travel time (Non-motorized traffic)
R-17.2 Travel time (Motorcycles)
R-17.3 Travel time (Passenger cars)
R-17.4 Travel time (Light trucks)
R-17.5 Travel time (Medium/heavy trucks)
R-17.6 Travel time (Mini-buses)
R-17.7 Travel time (Heavy buses)
R-17.8 Travel time (Key routes)[[Key route disaggregations do not require unique common indicator codes in the M&E Plan.]]
(R-18) Travel speed
R-18.1 Travel speed (Non-motorized traffic)
R-18.2 Travel speed (Motorcycles)
R-18.3 Travel speed (Passenger cars)
R-18.4 Travel speed (Light trucks)
R-18.5 Travel speed (Medium/heavy trucks)
R-18.6 Travel speed (Mini-buses)
R-18.7 Travel speed (Heavy buses)
R-18.8 Travel speed (Key routes)[[Key route disaggregations do not require unique common indicator codes in the M&E Plan.]]
(R-19) Trip purpose - business
R-19.1 Trip purpose - business (Key routes)[[Key route disaggregations do not require unique common indicator codes in the M&E Plan.]]
(R-20) Trip purpose - leisure
R-20.1 Trip purpose - leisure (Key routes)[[Key route disaggregations do not require unique common indicator codes in the M&E Plan.]]
(R-21) Cargo weight
R-21.1 Cargo weight (Non-motorized traffic)
R-21.2 Cargo weight (Motorcycles)
R-21.3 Cargo weight (Passenger cars)
R-21.4 Cargo weight (Light trucks)
R-21.5 Cargo weight (Medium/heavy trucks)
R-21.6 Cargo weight (Mini-buses)
R-21.7 Cargo weight (Heavy buses)
R-21.8 Cargo weight (Import)
R-21.9 Cargo weight (Export)
R-21.10 Cargo weight (Domestic)
R-21.11 Cargo weight (Key routes)[[Key route disaggregations do not require unique common indicator codes in the M&E Plan.]]
R-21.12 Cargo weight (International Standard Industrial Classification of All Economic Activities (ISIC) Broad structure)[[ISIC Broad structure disaggregations do not require unique common indicator codes in the M&E Plan.]]
R-21.13 Cargo weight (Direction of travel)[[Direction of travel disaggregations do not require unique common indicator codes in the M&E Plan.]]
(R-22) Cargo value
R-22.1 Cargo value (Import)
R-22.2 Cargo value (Export)
R-22.3 Cargo value (Domestic)
R-22.4 Cargo value (Key routes)[[Key route disaggregations do not require unique common indicator codes in the M&E Plan.]]
R-22.5 Cargo value (International Standard Industrial Classification of All Economic Activities (ISIC) Broad structure)[[ISIC Broad structure disaggregations do not require unique common indicator codes in the M&E Plan.]]
R-22.6 Cargo value (Direction of travel)[[Direction of travel disaggregations do not require unique common indicator codes in the M&E Plan.]]
(R-23) Cost of transportation
R-23.1 Cost of transportation (Non-motorized traffic)
R-23.2 Cost of transportation (Motorcycles)
R-23.4 Cost of transportation (Passenger cars)
R-23.5 Cost of transportation (Light trucks)
R-23.6 Cost of transportation (Medium/heavy trucks)
R-23.7 Cost of transportation (Mini-buses)
R-23.8 Cost of transportation (Heavy buses)
R-23.9 Cost of transportation (Construction)
R-23.10 Cost of transportation (Rehabilitation)
R-23.11 Cost of transportation (Periodic maintenance)
R-23.12 Cost of transportation (Improvement)
(R-24) Average vehicle weights
R-24.1 Average vehicle weights (Non-motorized traffic)
R-24.2 Average vehicle weights (Motorcycles)
R-24.4 Average vehicle weights (Passenger cars)
R-24.5 Average vehicle weights (Light trucks)
R-24.6 Average vehicle weights (Medium/heavy trucks)
R-24.7 Average vehicle weights (Mini-buses)
R-24.8 Average vehicle weights (Heavy buses)
(R-25) Transport fares
R-25.1 Average vehicle weights (Bus)
R-25.2 Average vehicle weights (Taxi)
R-25.4 Average vehicle weights (Freight)
R-25.5 Average vehicle weights (Other)
R-25.6 Average vehicle weights (Key routes)[[Key route disaggregations do not require unique common indicator codes in the M&E Plan.]]
R-25.7 Average vehicle weights (Regulated)
R-25.8 Average vehicle weights (Unregulated)
(R-26) People trained in network prioritization
R-26.1 People Trained in Network Prioritization (Female)
R-26.2 People Trained in Network Prioritization (Male)
(R-27) Evidence-based maintenance planning
R-27.1 Kilometers of road network with prioritization data
R-27.2 Kilometers of road network (planning)
(R-28) Evidence-based maintenance execution
R-28.1 Kilometers of road network with evidence-based maintenance execution
R-28.2 Kilometers of road network (execution)
(R-29) Percentage of annual maintenance budget allocated
R-29.1 Annual road maintenance funds allocated
R-29.2 Requested annual maintenance budget
R-29.3 Percentage of annual maintenance budget allocated (Routine)
R-29.4 Percentage of annual maintenance budget allocated (Periodic)
R-29.5 Percentage of annual maintenance budget allocated (Emergency)
(R-30) Percentage of annual maintenance budget spent
R-30.1 Annual road maintenance budget spent
R-30.2 Annual road maintenance budget allocated
R-30.3 Percentage of annual maintenance budget spent (Routine)
R-30.4 Percentage of annual maintenance budget spent (Periodic)
R-30.5 Percentage of annual maintenance budget spent (Emergency)
(R-31) Road network roughness
R-31.1 Road network roughness (Bad)
R-31.2 Road network roughness (Poor)
R-31.3 Road network roughness (Fair)
R-31.4 Road network roughness (Good)
(R-32) Total transportation cost savings
R-32.1 Total transportation cost savings (Time savings)
R-32.2 Total transportation cost savings (Vehicle operating cost savings)
R-32.3 Total transportation cost savings (Accidents)
R-32.4 Total transportation cost savings (Other)
R-32.5 Total transportation cost savings (Construction)
R-32.6 Total transportation cost savings (Rehabilitation)
R-32.7 Total transportation cost savings (Periodic maintenance)
R-32.8 Total transportation cost savings (Improvement)
(R-33) Percentage overloading
R-33.1 Percentage overloading (Primary)
R-33.2 Percentage overloading (Secondary)
R-33.3 Percentage overloading (Tertiary)
Water Supply, Sanitation, and Hygiene (WASH)
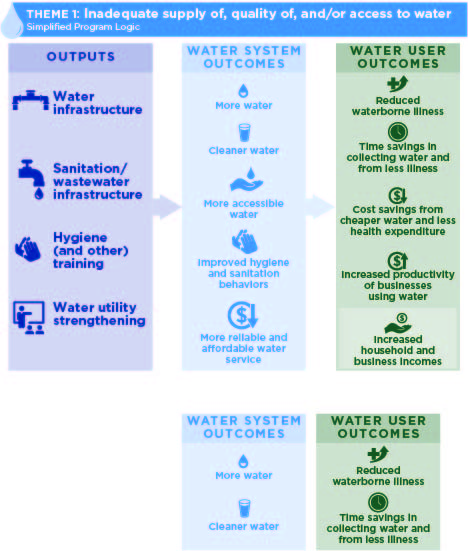
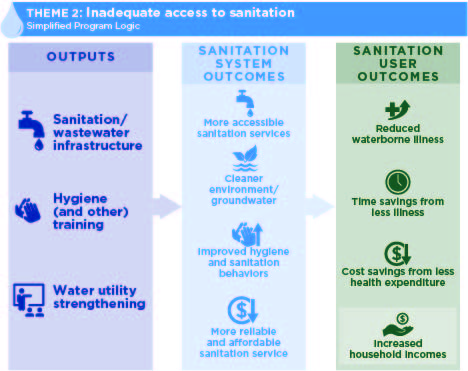
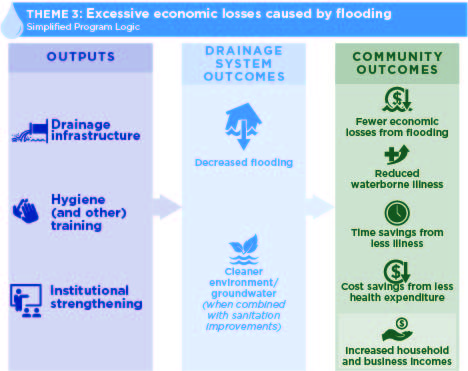
Water Supply, Sanitation, and Hygiene (WASH) common indicators map to outputs and outcomes identified within the three themes summarized in the simplified program logics below: (1) Inadequate supply of, quality of, and/or access to water; (2) Inadequate access to sanitation; and (3) Excessive economic losses caused by flooding. Each indicator maps to one or more output or outcome at the system or user/community level.
A summary of the indicators and categories is provided in the table below.
The WASH Indicator Framework does not include indicators related to irrigation, which refers specifically to the supply of water to land or crops, typically by means of channels, because those are covered by the Agriculture and Irrigation common indicators.
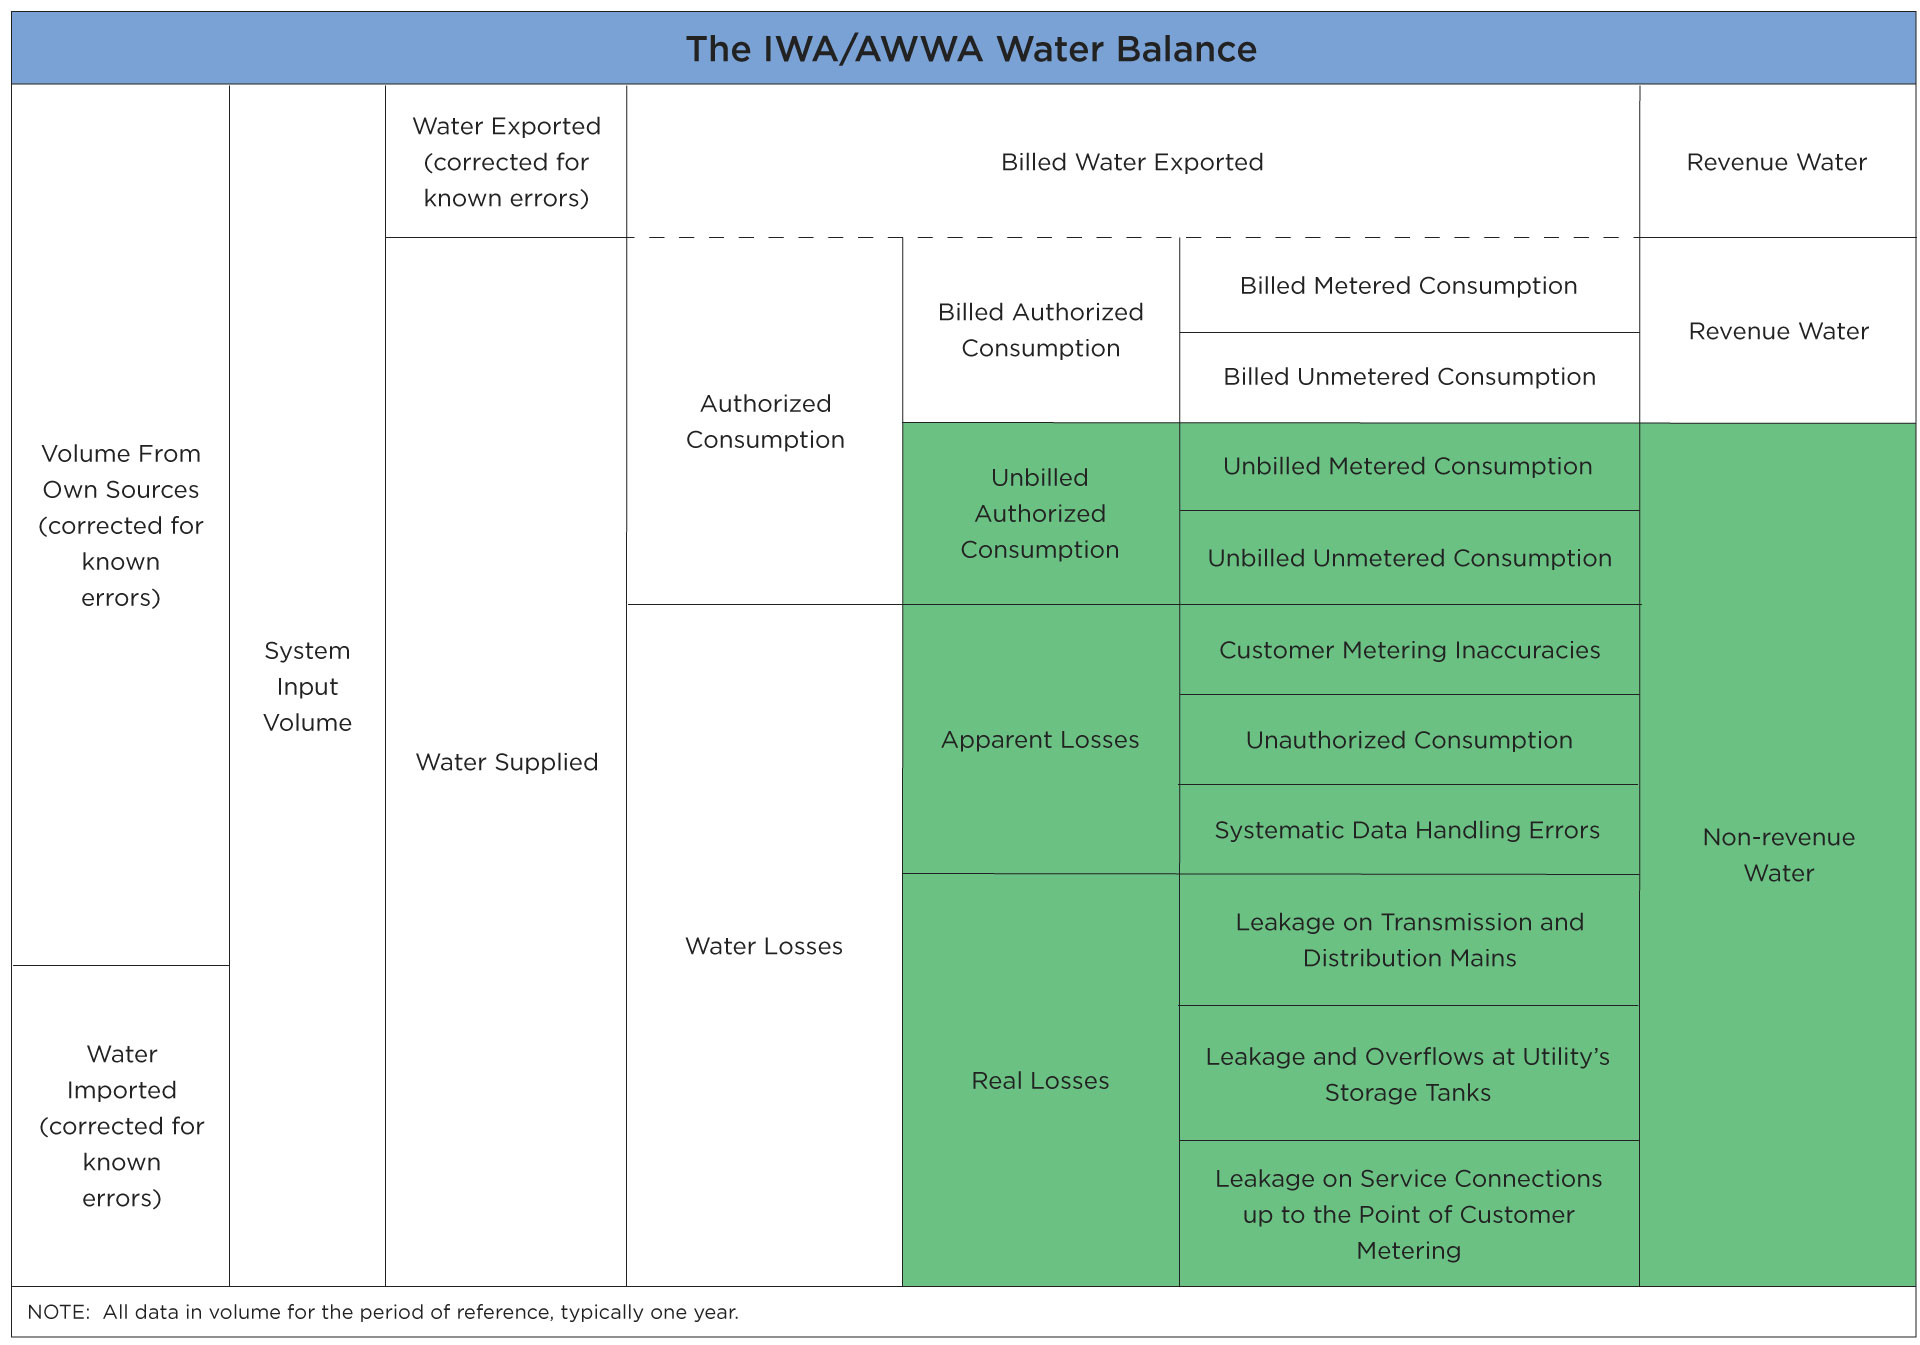
Where possible, indicators have been aligned with existing frameworks such as the International Benchmarking Network for Water and Sanitation Utilities (IBNET), the Sustainable Development Goals (SDGs), and AquaRating. Note that the common indicator codes have been preserved from Version 3 of the Common Indicators Guidance for internal consistency. A summary of all changes made to the indicators in the current version along with justifications for those changes are located at the end of this document.
General Program Logics for WASH Investments
Summary of the Wash Common Indicator Framework
Result
Theme 1:Water
Theme 2:Sanitation
Theme 3:Drainage
Process
(WS-5)Temporary employment generated in water and sanitation
Outputs
Water infrastructure
(WS-7)
Water points constructed
(WS- 27)
Length of water pipelines constructed or replaced
(WS-29)
Reservoirs or pumping stations constructed or rehabilitated
(WS-31)
Water supply kiosks built
(WS-33)
Water production capacity added
Hygiene (and other) training
(WS-6)
Individuals trained in social and behavior change
Water and sanitation/
wastewater infrastructure
(WS-26)
Sanitation facilities constructed
(WS-28)
Length of sewers constructed or replaced
(WS-30)
Customer water meters installed or replaced
(WS-32)
Treatment process units within centralized water or wastewater treatment facilities constructed, rehabilitated, or expanded
Drainage infrastructure
(WS-17)
Length of drains constructed or rehabilitated
System Outcomes
More water
(WS-9)
Continuity of service
(WS-14)
Residential water consumption
(WS-15)
Industrial/Commercial water consumption
(WS-20)
Customer complaints relative to total connections
(WS-36)
Water production available per customer connection
More accessible water
(WS-12)
Use of safely managed drinking water services
(WS-14)
Residential water consumption
(WS-15)
Industrial/Commercial water consumption
(WS-23)
Water service coverage
(WS-25)
Total customer connections
Cleaner water
(WS-12)
Use of safely managed drinking water services
(WS-20)
Customer complaints relative to total connections
(WS-21)
Proportion of tests passing drinking water quality criteria
Improved hygiene and sanitation behaviors
(WS-12)
Use of safely managed drinking water services
(WS-13)
Use of safely managed sanitation and a hand-washing facility
More accessible sanitation services
(WS-13)
Use of safely managed sanitation and a hand-washing facility
(WS-22)
Proportion of wastewater treated
(WS-24)
Sewerage service coverage
(WS-25)
Total customer connections
More reliable and affordable water and sanitation services
(WS-8)
Proportion of non-revenue water
(WS-10)
Proportion of operating costs covered by revenue
(WS-11)
Supplied water volume
(WS-18)
Proportion of billing collected
(WS-19)
Utility staff per 1000 connections
(WS-35)
Affordability of service
(WS-20)
Customer complaints relative to total connections
Cleaner environment/groundwater
User/Community Outcomes
Time savings in collecting water and from less illness
(WS-34)
Time spent collecting water
Reduced waterborne illness
(WS-16)
Prevalence of diarrhea
List of Common Indicators for WASH Sector
Process Indicators
(WS-5) Temporary employment generated in water and sanitation construction
Units: Number
Definition: The number of people temporarily employed or contracted by MCA- contracted construction companies to work on construction of water or sanitation systems.
Guidance: This indicator counts the number of unique people contracted, not the amount of time that those people were temporarily employed. Even if a person was contracted for 1 day, he/she should be counted. Both local and foreign workers should be included. Informal employment generated by construction activities is not included. Procurement documents may state a target for women’s employment that can be used as a target for this indicator.
Level: Process Indicator
Classification: Cumulative
Disaggregation: Sex (Female/Male)
ITT: Yes
Common Indicator Report: Yes
Output Indicators
(WS-6) Individuals trained in social and behavior change
Units: Number
Definition: The number of individuals in a community trained towards achieving a specific social or behavior change, particularly pertaining to sustaining access to services, and to hygiene behaviors that block the fecal-oral pathogen transmission pathways.
Guidance: Each country should define clearly what it means to “train” a person taking into consideration the desired result of training or technical assistance. This indicator is designed to provide a generic monitoring function for social and behavior change communications training. This indicator should be specifically disaggregated based on training of community members with various roles (e.g., community leader, health service provider, religious leader, person monitoring behavior change events, other person of influence). For example, for Community Led Total Sanitation (CLTS) in Indonesia I compact, the number of health service providers trained in CLTS triggering were monitored, as were number of service providers trained in the M&E of CLTS triggering events. Under the current framework, both indicators would be tracked as disaggregation’s of this indicator. Details should be clearly documented in the Additional Information column of the indicator definition table in the M&E Plan.
Level: Output Indicator
Classification: Cumulative
Disaggregation: Sex (Female/Male). Consider disaggregating by role of individual in community, depending on program context.
ITT: Yes
Common Indicator Report: Yes
(WS-7) Water points constructed
Units: Number
Definition: The number of non-networked, stand-alone water supply systems constructed, such as: protected dug wells, tube-wells / boreholes, protected natural springs and rainwater harvesting / catchment systems.
Guidance: General geographical location of the communities served should be included in the Additional Information of the M&E Plan. A brief description of whether the water point is attached to a small network of pipes should also be included.
Level: Output Indicator
Classification: Cumulative
Disaggregation: None
ITT: Yes
Common Indicator Report: Yes
(WS-17) Length of drains constructed or rehabilitated
Units: Kilometers
Definition: Total length in kilometers of covered and uncovered storm stormwater drains constructed, rehabilitated, or replaced.
Guidance: Stormwater drains include can be open channels (canals) or underground pipes that are designed specifically to manage rainwater or storm water in an urban areas to reduce flooding. Combined sewer systems that accept both stormwater, and wastewater or sewage are common in colonial urban centers (e.g., most Eastern US cities have combined sewage systems). This indicator is intended to capture the MCC investment in stormwater management regardless of the specific type of drain constructed or rehabilitated.
Level: Output Indicator
Classification: Cumulative
Disaggregation: None
ITT: Yes
Common Indicator Report: Yes
(WS-26) Sanitation facilities constructed
Units: Number
Definition: Number of sanitation facilities constructed as part of the project. The facility is counted as operational when it has been handed over to the community for use. Sanitation facilities to be included in this indicator include flush toilet, flush or pour-flush pit latrine, pit latrine with slab, ventilated improved pit latrine (VIP latrine), composting toilet, or any other appropriately sanitary form of feces disposal for protection of public health.
Guidance: Details of the categories of sanitation facilities being built should be included in the Additional Information column of the indicator definition table in the M&E Plan.
Level: Output Indicator
Classification: Cumulative
Disaggregation: None
ITT: Yes
Common Indicator Report: Yes
(WS-27) Length of water pipelines constructed or replaced
Units: Kilometers
Definition: Total length in kilometers of water network pipelines that are newly constructed to expand the water distribution network or replaced along sections of existing network. This indicator should include all pipes within the transmission and distribution network. The pipes are considered complete and counted in this indicator after handover to the utility by the contractor and once operational.
Guidance: The works contractors’ geographical scope, including the contractual pipe length targets, should be included in the Additional Information column of the indicator definition table in the M&E Plan. The definition of this indicator deliberately includes “handover to utility” to confirm completion of the output and expectation of the beginning of the exposure period for subsequent outcomes in the theory of change. If the M&E Lead wishes to monitor progress of construction of the pipe, they are encouraged to create an indicator for that purpose in the ITT.
Level: Output Indicator
Classification: Cumulative
Disaggregation: Disaggregating this indicator by works contract and/or the geographical area or neighborhood so there is one disaggregated indicator per contractor is suggested, though not required. This is suggested to minimize calculations by the MCA, which might be difficult to explain or track for the M&E Lead.
ITT: Yes
Common Indicator Report: Yes
(WS-28) Length of sewers constructed or replaced
Units: Kilometers
Definition: Total length in kilometers of the sewage network constructed or replaced including service network and interceptors. This indicator should include all sewers including laterals to individual homes and interceptors conveying the sewage to a treatment facility. The sewers are considered completed and counted in this indicator after handover to the utility by the contractor and once operational.
Guidance: The works contractors’ geographical scope, including the contractual sewer length targets, should be included in the Additional Information column of the indicator definition table in the M&E Plan. The definition of this indicator deliberately includes “handover to utility” to confirm completion of the output and expectation of the beginning of the exposure period for subsequent outcomes in the theory of change. If the M&E Lead wishes to monitor progress of construction of the sewer, they are encouraged to create an indicator for that purpose in the ITT.
Level: Output Indicator
Classification: Cumulative
Disaggregation: Disaggregating this indicator by works contract and/or the geographical area or neighborhood so there is one disaggregated indicator per contractor is suggested, though not required. This is suggested to minimize calculations by the MCA, which might be difficult to explain or track for the M&E Lead.
ITT: Yes
Common Indicator Report: Yes
(WS-29) Reservoirs or pumping stations constructed or rehabilitated
Units: Number
Definition: Number of water reservoirs or pumping stations constructed or rehabilitated for reliable water supply from all (surface and groundwater) sources.
Guidance: This indicator is intended to capture any construction done on the core water supply backbone infrastructure, which typically includes pumps, and reservoirs to transport water from the source (river/ groundwater boreholes) to the population center. The reservoirs and pumping stations may be co-located but the project may replace or rehabilitate either pumping stations or reservoirs or both. For accountability purposes, the detailed breakdown of the expected outputs on the two types of facilities should be included in the Additional Information section of the M&E Plan. This is strongly suggested to be able to keep track of the investment and to ultimately follow up on downstream impacts through the evaluation.
Level: Output Indicator
Classification: Cumulative
Disaggregation: None
ITT: Yes
Common Indicator Report: Yes
(WS-30) Customer water meters installed or replaced
Units: Number
Definition: Total number customer water meters installed or replaced in the project area. Replacement of non-functional meters should be recorded separately from new meters installed for the first time.
Guidance: New meters installed for the first time may coincide with New Connections (WS-24) due to expansion of service to new service areas and to new customers. If meters are installed for service expansion, that should be explicitly noted in the Additional Information column of the indicator definition table in the M&E Plan. Note that in that case, care should be taken to identify which subset of this indicator are New Connections (WS-24). Data reporting processes must be set up through the implementing contractor to ensure that this specific delineation is captured.
Level: Output Indicator
Classification: Cumulative
Disaggregation: Installation type (New/Replacement)
ITT: Yes
Common Indicator Report: Yes
(WS-31) Water supply kiosks built
Units: Number
Definition: Number of new kiosks built or rehabilitated to become operational through an active connection to a water utility and provision of water to customers.
Guidance: Water kiosks are booths for the sale of tap water and are common in Sub-Saharan countries (e.g., they were included as indicators in Zambia and Sierra Leone Programs). The kiosk should not be counted towards this indicator until evidence of its operation either through the utility, or direct observation of water sales at the source. If the kiosk is not directly connected to a piped network or is operated by a third party, the kiosk must be judged to be operational for customers to be counted toward this indicator.
Level: Output Indicator
Classification: Cumulative
Disaggregation: Neighborhood income, if possible
ITT: Yes
Common Indicator Report: Yes
(WS-32) Treatment process units within centralized water or wastewater treatment facilities constructed, rehabilitated, or expanded
Units: Number
Definition: The number of treatment process units within centralized water or wastewater treatment facilities constructed, rehabilitated, or expanded. The specific treatment process units for each centralized facility must be identified by the engineering expertise on the program.
Guidance: Conventional water treatment processes include coagulation, flocculation, filtration, and disinfection. Conventional wastewater treatment processes include grit removal, sedimentation (primary treatment), biological treatment (secondary treatment), and disinfection (tertiary treatment). These treatment process units are typical but not universal. Wastewater stabilization ponds are another common centralized wastewater treatment technology commonly employed in Africa. The specific treatment process units must be identified by the engineers and included in the Additional Information section of the M&E Plan.
Level: Output Indicator
Classification: Cumulative
Disaggregation: Treatment facility type (Water/Wastewater)
ITT: Yes
Common Indicator Report: Yes
(WS-33) Water production capacity added
Units: Millions of liters per day
Definition: The volume of water supply or production capacity added to the relevant water system, resulting from the introduction of new water sources (freshwater or recycled wastewater) and/or the expansion of water treatment plants paid for by MCC. This additional water would be expected to flow into the distribution system.
Guidance: This indicator is intended to capture MCC investment in potential capacity of the water production facilities rather than what is actually supplied (which is measured by WS-11). The capacity of the water production system will always be higher than or equal to the volume actually supplied to the customers. This indicator would report the combined increase in sticker capacity of pumps for the relevant water production system added through the MCC investment (e.g., boreholes pumps obtaining groundwater, intake pumps for a river or lake, pipe/ pump capacity for recycled wastewater coming from the advanced wastewater treatment facility). If production capacity of multiple sources is increased, the specific breakdown must be reported in the Additional Information section of the M&E Plan.
Level: Output Indicator
Classification: Cumulative
Disaggregation: None
ITT: Yes
Common Indicator Report: Yes
Outcome Indicators
(WS-8) Proportion of non-revenue water
Units: Percentage
Definition: The difference between the volume of water supplied and the volume of water billed (i.e., volume of water “lost”) expressed as a percentage of water volume supplied in a year.
Guidance: This is aligned with IBNET indicator 6.1. The volume of water lost from the distribution network is defined as Non-Revenue Water (NRW). The volume of water that does not generate revenue for the utility consists of three components, real losses, apparent losses, and authorized unbilled consumption. The “Real” or technical NRW results from physical leakages in the water distribution network. “Apparent” NRW could be due to customer metering inaccuracies (measuring volumes that are higher or lower than actual, like in Jordan), unauthorized (illegal) consumption, or systematic data handling errors in the utility’s customer database. Authorized unbilled consumption could come from the customers that the utility is providing water to but not expecting a payment e.g., government entities or hospitals (see figure below). Discerning the contribution of each of the three NRW components requires a system-wide assessment using the water balance method.
NRW can be difficult to estimate because utilities may not know the total system input (multiple unmetered sources), and the billed amount may not be based on volume of water sold (customers not metered). If these components are known with some degree of certainty, the formula below can provide an estimate for the total NRW. Otherwise, it is important to note data quality concerns to contextualize the reported data.
Calculation: NRW = (1 – (P/S))*100 where: NRW = Non Revenue Water
P = Paid Billed Volume by all customers
S = Supplied Volume
Level: Outcome Indicator
Classification: Level (cumulative)
Disaggregation: The M&E Lead may consider a geographical disaggregation (by DMA or sub-network) to make this indicator more useful.
ITT: Yes
Common Indicator Report: No
(WS-8.1) Paid billed volume for all customers
Units: Cubic meters
Definition: The volume of metered/unmetered water that is billed and produces revenue. Equal to Billed Metered Consumption plus Billed Unmetered Consumption for the referenced time period for which payment has been received.
Guidance: Billed Metered Consumption includes all groups of customers such as domestic, commercial, industrial or institutional. Billed Unmetered Consumption includes all billed consumption which is calculated based on estimates or norms but is not metered. This might be a very small component in a fully metered system (for example billing based on estimates for the period a customer meter is out of order) but can be the key consumption component in systems without universal metering. These components also include water transferred across operational boundaries (water exported) which is metered/unmetered and billed.
Note that the period of time for which this indicator is calculated should be explicitly defined. This period should be the same for WS-8.2 (Supplied water volume). For indicator reporting purposes, quarterly reporting is recommended.
Level: Outcome Indicator
Classification: Level (cumulative)
Disaggregation: None
ITT: Yes
Common Indicator Report: No
(WS-8.2) Supplied water volume (WS-8)
Units: Cubic meters
Definition: The volume of water supplied to the entire distribution system, which equals the total volume of water produced by the utility for a referenced time period.
Guidance: See WS-11
Level: Outcome Indicator
Classification: Level (cumulative)
Disaggregation: None
ITT: Yes
Common Indicator Report: No
(WS-9) Continuity of service
Units: Hours per day
Definition: Average hours of service per day for water supply.
Guidance: This is aligned with IBNET indicator 15.1. Source of data can either be utility hours of operation or a household survey. A household survey will provide the most accurate data but due to its infrequency, attempts should be made to gather disaggregated data from the utility. If data will only be available through a household survey, the indicator should not be included in the ITT due to the low frequency of measurement/reporting. Most utilities with intermittent supply have norms and schedules associated with supplying water to different areas of the city. It is not uncommon for wealthier areas to have near continuous (24/7) water supply, even as poorer areas receive restricted hours. These very important differences will disappear in the average value, so it is important to attempt disaggregation at the neighborhood level. This is particularly the case if MCC investments are only in a few neighborhoods of the city and it would be important to gather information about whether hours of supply in that particular area have improved.
Level: Outcome Indicator
Classification: Level
Disaggregation: Income level (Relative high-income neighborhood/ Relative low-income neighborhood)
ITT: Maybe, depending on frequency of data availability
Common Indicator Report: No
(WS-10) Proportion of operating costs covered by revenue
Units: Percentage
Definition: Total annual operational revenues divided by total annual operating costs. Also known as “operating cost coverage.”
Guidance: The purpose of this indicator is to assess whether a utility is financially viable and able to cover all its operation and maintenance (O&M) costs using the revenues collected from customers (close to 100% is best but must review whether appropriate O&M is budgeted in the utility’s finances). The ability of a utility to cover its costs is salient for sustainability of any MCC investment in utility infrastructure assets, and ultimately for service delivery to beneficiaries. Note that if additional infrastructure assets are being provided to a utility as part of the MCC investment, the utility will need to budget additional funds to cover O&M of the new assets going forward and this number may drop after handover if appropriate O&M is budgeted.
This is aligned with IBNET indicator 24.1. This indicator focuses on financial performance of the utility to make a determination if the utility is financially viable and can cover its costs. Each country should clearly define in the Additional Information column of the indicator definition table in the M&E Plan how depreciation and maintenance are incorporated into the financial calculation. If the utility is underestimating the costs of planned maintenance and under-budgeting asset maintenance, then this indicator will appear artificially high. Such a situation will falsely give the impression that the utility is performing well in covering costs, whereas it is simply deferring maintenance costs into the future.
Calculation: OPC = R/C *100 where:
OPC = Operation Cost Coverage
R = Total Annual Operational Revenue
C = Total Annual Operational Cost (including maintenance)
Level: Outcome Indicator
Classification: Level
Disaggregation: None
ITT: Yes
Common Indicator Report: No
(WS-10.1) Total annual operational revenue
Units: US Dollars
Definition: The monetary amount billed and collected annually by the utility for utility service rendered and for other services incidental thereto.
Level: Outcome Indicator
Classification: Level
Disaggregation: None
ITT: Yes
Common Indicator Report: No
(WS-10.2) Total annual operational cost (including maintenance)
Units: US Dollars
Definition: Annual expenses, including maintenance costs, and capital costs incurred as part of the water utility’s operations.
Guidance: A due diligence assessment should be done to determine whether the utility is adequately factoring in planned maintenance into its operational costs. The outcome of this assessment should be documented in the Additional Information column of the indicator definition table in the M&E Plan.
Level: Outcome Indicator
Classification: Level
Disaggregation: None
ITT: Yes
Common Indicator Report: No
(WS-11) Supplied water volume[[Note WS-11 is also an input for WS-8 Proportion of non-revenue water]]
Units: Cubic meters
Definition: The volume of water supplied to the entire distribution system, which equals the total volume of water produced by the utility for a referenced time period.
Guidance: Production sources of this water may include production from groundwater (boreholes, wells), surface water (rivers, lakes), desalination (seawater), reuse (reclaimed water), and any water purchased from another jurisdiction. The utility may not have bulk meters measuring the total volume produced from all combined sources and may have to estimate this indicator. In other cases (e.g., Mongolia), measurements may be available for all water production sources as well as water supply into the distribution system; in such cases, the volume of water supplied to the distribution system must be used. All major sources of production should be included in the notes section and the data quality of each production category should be assessed. Some sources will have higher quality and more reliable volume data than others and it is important to identify those sources.
Note that the period of time for which this indicator is calculated should be the same as WS-8.1 (Paid billed volume for all customers). For indicator reporting purposes, quarterly reporting is recommended.
Level: Outcome Indicator
Classification: Level (cumulative)
Disaggregation: Water source type (Surface water/Groundwater/Desalination/Reclaimed water/Other)
ITT: Yes
Common Indicator Report: No
(WS-12) Use of safely managed drinking water services
Units: Percentage
Definition: The percentage of households in the MCC project area whose main source of drinking water is through safely managed (‘improved’) drinking water services.
Guidance: ‘Improved’ drinking water sources include: piped water into dwelling, yard or plot; public taps or standpipes; boreholes or tube wells; protected dug wells; protected springs; packaged water; delivered water and rainwater. This water source should be located on premises, available when needed, and free of fecal (and priority chemical) contamination. This indicator is aligned with the Sustainable Development Goals; indicator 6.1.1.
Additional guidance on this indicator is provided in the SDG metadata for indicator 6.1.1.
Depending on the area served, a census count or household survey could be conducted to identify the percentage of households with access to improved water supply and its specific source.
Level: Outcome Indicator
Classification: Level
Disaggregation: None
ITT: No
Common Indicator Report: No
(WS-13) Use of safely managed sanitation and a hand-washing facility
Units: Percentage
Definition: Proportion of households in the MCC project area using safely managed sanitation (‘improved’) services and a hand-washing facility with soap and water. ‘Improved’ sanitation facilities include: flush or pour flush toilets to sewer systems or to onsite septic tanks, dry pit latrines, ventilated improved pit latrines, pit latrines with a slab, and composting toilets. Basic handwashing facilities include: a device to contain, transport or regulate the flow of water to facilitate handwashing with soap and water in the household.
Guidance: To be counted as part of this indicator, sanitation and hand-washing facilities should not be shared with other households and excreta must be safely disposed in situ or treated off-site. This indicator is aligned with the Sustainable Development Goals; indicator 6.2.1.
Additional guidance on this indicator is provided in the SDG metadata for indicator 6.2.1. The Additional Information column of the M&E Plan indicator definition table should specify the definition of ‘improved’ being used under the project.
Depending on the area served, a census count or household survey could be conducted to identify the percentage of households with access to improved sanitation and its specific source
Calculation: Households using safely managed facilities/Total Households *100
Level: Outcome Indicator
Classification: Level
Disaggregation: None
ITT: No
Common Indicator Report: No
(WS-14) Residential water consumption
Units: Liters per capita per day
Definition: The average water consumption in liters per person per day.
Guidance: This indicator is aligned with IBNET Indicators 4.7 and 4.3 designed on urban measurements but also applicable to rural measurements. The data can be calculated based on water consumed by households as registered from water meter or the utility’s database, or by a household survey. If survey data is used, this indicator should not be reported in the ITT. The persons served would be calculated by multiplying the households by persons per households. Household survey data is preferred as accurate service population information may not be available from utilities unless the utilities undertake analysis to understand their consumer profiles. This indicator should be disaggregated based on the type of consumer e.g., direct household connection, shared tap, standpipe or kiosk. The differences in water quantity consumed depends on the ease of access to the water. All assumptions used to calculate liters per person per day should be documented in the Additional Information column of the indicator definition table in the M&E Plan.
Level: Outcome Indicator
Classification: Level
Disaggregation: Consider disaggregations based on consumer profile, if available (e.g., household connection; shared tap; standpipe or kiosk)
ITT: Maybe, depending on frequency of data availability
Common Indicator Report: No
(WS-15) Industrial/Commercial water consumption
Units: Cubic meters per month
Definition: The average amount of commercial water consumed measured in cubic meters per month.
Guidance: The purpose of this indicator is to identify the volume of water consumed by entities registered as commercial businesses/ industrial customers with the utility. These customers would pay for the water under a “commercial tariff” regime and would not include any small household-run businesses paying for the water under a “residential tariff” regime. The data can be calculated based on water consumed by businesses as registered from water meter or the utility’s database, or by a survey. Survey data is preferred as accurate service population information may not be available from utilities unless the utilities undertake analysis to understand their consumer profiles. If survey data is used, this should not be reported in the ITT. This indicator is aligned with the International Benchmarking Network for Water and Sanitation Utilities (IBNET) Indicator 4.4 All assumptions used to calculate cubic meters per month should be documented in the Additional Information column of the indicator definition table in the M&E Plan.
Level: Outcome Indicator
Classification: Level
Disaggregation: Consider disaggregation based on the cost-benefit model and subsequent economic benefit of commercial consumption, if applicable (e.g., if there are a handful of large commercial consumers, they should be monitored separately. The rest can be included in a “small commercial consumers” category).
ITT: Maybe, depending on frequency of data availability
Common Indicator Report: No
(WS-16) Prevalence of diarrhea
Units: Percentage
Definition: The percentage of individuals reported as having diarrhea in the two weeks preceding the survey.
Guidance: This information is typically sourced from a household survey. The exact question(s), sampling frequencies and methodology used to collect data for this indicator should be documented in the Additional Information column of the indicator definition table of the M&E Plan. To the extent possible, Compacts should use the WHO definition for diarrhea: the passage of 3 or more loose or liquid stools per day, or more frequently than is normal for the individual. For more information on diarrhea measurement and recall periods, see the 2011 publication on diarrhea measurement in the International Journal of Epidemiology.[[A practical guidance for diarrhea measurement in studies is included in the following publication: Wolf-Peter Schmidt, Benjamin F Arnold, Sophie Boisson, and 1 Bernd Genser, Stephen P Luby, Mauricio L Barreto, Thomas Clasen and Sandy Cairncross “Epidemiological methods in diarrhea studies— an update” Int. J. Epidemiology. Advance Access published November 8, 2011.]] Although a 7 day recall period is recommended, Living Standard Measurement Surveys (LSMS) and the current Phase 6 Demographic Health Surveys (DHS)[[http://www.measuredhs.com/pubs/pdf/DHSQ6/DHS6_Questionnaires_3Jan2012.pdf]] measure the percentage of children under the age of five who have had diarrhea in the two weeks preceding the survey, as these are the most vulnerable populations. MCC recommends collecting data on incidence in the last 2 weeks, but will assess the country context and research questions to determine whether or not additional questions with varying recall periods (3 days, 7 days, 2 weeks) are necessary. Illness diaries for children under 15 are also a reliable method for data collection and have been used in studies to record frequency of fever, diarrhea or vomiting over time and may require smaller sample sizes to capture incidence of disease.[[Florence Devoto, Esther Duflo, Pascaline Dupas, William Pariente, Vincent Pons, “Happiness on Tap: Piped Water in Urban Morocco,” The Abdul Latif Jameel Poverty Action Lab, April 2011.]] To the extent possible, data collection for this indicator should capture seasonal variations, particularly in countries with dry and rainy seasons. Statements made to attribute health impacts to the MCC project should only be made in the context of a rigorous, counterfactual-based impact evaluation.
Level: Outcome Indicator
Classification: Level
Disaggregation: Age (Under age 5, 5 years and older)
ITT: No
Common Indicator Report: No
(WS-18)Proportion of billing collected
Units: Percentage
Definition: The total revenue collected in a year as a percentage of the total billed revenue (expected revenue) for the same year.
Guidance: This is aligned with IBNET indicator 23.2. Billing customers, and getting paid are two different things. The effectiveness of the collections process is measured by the total amount collected as a percentage of the billed amount. The collection ratio provides an assessment of how good a utility is in collecting on the bills it has issued to its customers. It is important to note that Billing and Collections Departments are often separate in large utilities. The collections team is not concerned with the accuracy of billing; their job is to collect on the bills that have already been issued. It is also important to note that there may be inaccuracies in the issuance of the bills themselves because of an outdated customer database; that issue is addressed by the non-revenue water indicator. There may be instances where the collections suffer due to customers unable/ refusing to pay or if the customer cannot be located. Any utility policies to disconnect service in case of non-payment are enforced by the collections department. Any customer assistance programs to support vulnerable customers in payment of their bills would also liaise with this department. A utility that is diligent in collecting on all its bills would have a collection ratio of 100%.
Definition: The total revenue collected in a year.
Guidance: See WS-18.
Level: Outcome Indicator
Classification: Level
Disaggregation: If the utility database includes a variable for identifying poor customers (e.g., a customer assistance program), it would be useful to disaggregate by income (poor/ non-poor), particularly for cross-cutting work by GSI, HCD, and EA.
ITT: Yes
Common Indicator Report: No
(WS-18.2) Total billed revenue
Units: U.S. Dollars
Definition: The total billed revenue (expected revenue) for the year.
Guidance: See WS-18.
Level: Outcome Indicator
Classification: Level
Disaggregation: If the utility database includes a variable for identifying poor customers (e.g., a customer assistance program), it would be useful to disaggregate by income (poor/non-poor), particularly for cross-cutting work by GSI, HCD, and EA.
ITT: Yes
Common Indicator Report: No
(WS-19) Utility staff per 1000 connections
Units: Ratio
Definition: The number of full-time equivalent (FTE) staff members working on water and wastewater service delivery for one full year per 1,000 water and wastewater connections.
Guidance: This is aligned with IBNET indicator 12.2. This indicator is intended to measure the optimization of staffing levels based on service delivery. A public utility may not have control over human resources decisions and may not have the appropriate number of staff to accomplish the tasks required for adequate service delivery. These utilities may also be illicitly overstaffed, taking resources away from operations and maintenance. This indicator allows the utility’s staffing levels to be benchmarked, identify gap, and areas for improvement. Staff should be full-time equivalents (FTEs) working on water and wastewater service delivery for one full year. Water connections, and water-wastewater connections should all be counted towards the total number of connections.
Calculation: Staff per 1000 connections = (1000 * FTEs)/ total connections. Round to nearest whole number.
Level: Outcome Indicator
Classification: Level
Disaggregation: None
ITT: Yes
Common Indicator Report: No
(WS-19.1) Utility staff * 1,000
Units: Number
Definition: The number of full-time equivalent (FTE) staff members working on water and wastewater service delivery for one full year multiplied by 1,000.
Guidance: See WS-19
Level: Outcome Indicator
Classification: Level
Disaggregation: None
ITT: Yes
Common Indicator Report: No
(WS-19.2) Total customer connections (WS-19)
Units: Number
Definition: Total number of water only, or water and wastewater connections operational through billing by the utility in a year.
Guidance: See WS-19
Level: Outcome Indicator
Classification: Level
Disaggregation: None
ITT: Yes
Common Indicator Report: No
(WS-20) Customer complaints relative to total connections
Units: Percentage
Definition: Total number of water and wastewater complaints in a year expressed as a percentage of the total number of water and wastewater connections.
Guidance: This is aligned with IBNET indicator 16.1. This indicator tracks all complaints made to the utility through the appropriate channels about any service delivery concerns. If the utility does not have a formal system for taking in and logging complaints or service delivery requests, or if the records are unreliable, it should be noted in the Additional Information column of the indicator definition table in the M&E Plan.
Calculation: (Number of applicable customer complaints/ total number of customer connections) * 100
Level: Outcome Indicator
Classification: Level
Disaggregation: None
ITT: Yes
Common Indicator Report: No
(WS-20.1) Customer complaints
Units: Number
Definition: Total number of water and wastewater complaints in a year.
Guidance: See WS-20.
Level: Outcome Indicator
Classification: Level
Disaggregation: None
ITT: Yes
Common Indicator Report: No
(WS-20.2) Total customer connections (WS-20)
Units: Number
Definition: Total number of water only, or water and wastewater connections operational through billing by the utility in a year.
Guidance: See WS-20.
Level: Outcome Indicator
Classification: Level
Disaggregation: None
ITT: Yes
Common Indicator Report: No
(WS-21) Proportion of tests passing drinking water quality criteria
Units: Percentage
Definition: The percentage of recommended total number of samples tested for residual chlorine that pass the relevant standard (for drinking water, WHO recommends: 0.2 mg/L < residual chlorine concentration < 5 mg/L).
Guidance: This is aligned with IBNET indicator 15.4. Best practice for a drinking water utility requires that there is a certain number of water quality samples tested from across the entire system.
The required quality testing framework may or may not be present in the relevant utility. If it is not, and the indicator therefore must be measured through the evaluation, it should not be included in the ITT due to the low frequency of measurement. If there is no such plan in place to monitor water quality from across the distribution network, the specific number of total samples tested should be noted in the Additional Information column of the indicator definition table in the M&E Plan. This indicator can be used for non-networked water systems as well.
Level: Outcome Indicator
Classification: Level
Disaggregation: None
ITT: Maybe, depending on frequency of data availability
Common Indicator Report: No
(WS-22) Proportion of wastewater treated
Units: Percentage
Definition: The percentage of the total collected sewage volume that receives at least primary wastewater treatment.
Guidance: This is aligned with IBNET indicator 17.1. Primary wastewater treatment involves sedimentation of solid particles within the water, after screening out larger debris (grit removal). Secondary treatment involves biological treatment through waste stabilization ponds or mechanical treatment. Direct discharge of sewage into a water body (river or sea) does not comprise primary treatment; that sewage is untreated. Note that a prerequisite to wastewater treatment is the collection of sewage through piped sewers, which may not exist. Make a note of the sanitation conditions (sewers do not exist, on-site sanitation/ pit latrines in use) in the Additional Information column of the indicator definition table in the M&E Plan.
Level: Outcome Indicator
Classification: Level
Disaggregation: None
ITT: Yes
Common Indicator Report: No
(WS-23) Water service coverage
Units: Percentage
Definition: Population with access to water services (either with direct service connection or within reach of a public water point) as a percentage of the total population under utility’s nominal responsibility.
Guidance: This is aligned with IBNET indicator 1.1. The numerator of this indicator should include all direct paying customers of the utility through a direct connection or public water point multiplied by the average household size. It would not include customers who receive water through a private intermediary e.g., a truck or bowser since they are not direct customers of the utility (the private intermediary is the utility customer). The denominator must include the total population that the utility is responsible for serving as a natural monopoly regardless of where the population actually receives their water.
Level: Outcome Indicator
Classification: Level
Disaggregation: None
ITT: Yes
Common Indicator Report: No
(WS-23.1) Population with access to water services
Units: Number
Definition: All direct paying customers of the utility through a direct connection or public water point multiplied by the average household size.
Guidance: See WS-23.
Level: Outcome Indicator
Classification: Level
Disaggregation: Water service type (Household connections/Public water points). Additional suggested disaggregation within Household Connections is income (poor and non-poor) if the utility database includes a variable for identifying poor customers (e.g., a customer assistance program).
ITT: Yes
Common Indicator Report: No
(WS-23.2) Population in water service area
Units: Number
Definition: Total population under utility’s nominal responsibility.
Guidance: See WS-23.
Level: Outcome Indicator
Classification: Level
Disaggregation: None
ITT: Yes
Common Indicator Report: No
(WS-24) Sewerage service coverage
Units: Percentage
Definition: Population with sewerage services (direct service connection) as a percentage of the total population under utility’s nominal responsibility.
Guidance: This is aligned with IBNET indicator 2.1. Sewerage Coverage.
Level: Outcome Indicator
Classification: Level
Disaggregation: None
ITT: Yes
Common Indicator Report: No
(WS-24.1) Population with access to sewerage services
Units: Number
Definition: All direct paying customers of the utility through a direct sewerage service connection multiplied by the average household size.
Guidance: See WS-24.
Level: Outcome Indicator
Classification: Level
Disaggregation: None
ITT: Yes
Common Indicator Report: No
(WS-24.2) Population in sewerage service area
Units: Number
Definition: Total population under utility’s nominal responsibility.
Guidance: See WS-24.
Level: Outcome Indicator
Classification: Level
Disaggregation: None
ITT: Yes
Common Indicator Report: No
(WS-25) Total customer connections
Units: Number
Definition: Total number of water only, or water and wastewater connections operational through billing by the utility in a year.
Guidance: The specific neighborhood where the network extension is taking place because of the compact should be noted in the Additional Information column of the indicator definition table in the M&E Plan.
Level: Outcome Indicator
Classification: Level
Disaggregation: Connection type (Water only/Water and wastewater)
ITT: Yes
Common Indicator Report: No
(WS-34) Time spent collecting water
Units: Hours
Definition: Average time spent by household on water gathering activities performed during a one week period (one day recall), including time spent getting to the closest water point, time queuing to wait for one's turn, time queuing to wait for water supply, time drawing/collecting water and time spent returning from the closest water point.
Guidance: Time Use Survey or other survey methodology will be required to capture these data. The M&E Lead is advised to schedule the survey data collection once during each relevant season to capture any seasonality differences (e.g., dry season versus wet season) that may influence the indicator. Time spent collecting water is a form of unpaid work generally performed by women, teenage girls and children, and considered to be a major contributing factor to gender inequality and women’s poverty. Time spent on water collecting activities can be at the expense of children’s education, particularly girls’ education. The time of day or night when the water is collected is also important as it may have implications for gender based violence, therefore the survey should attempt to gather this information as well. This indicator will be an important input into the cost-benefit model, but will only likely be collected once or twice over the course of the compact through an evaluator.
Level: Outcome Indicator
Classification: Level
Disaggregation: Consider disaggregating by age (adult male, adult female, male child under 15 years, and female child under 15 years). Other useful disaggregations include time spent waiting in line; time spent traveling to the water source; and poverty status.
ITT: No
Common Indicator Report: No
(WS-35) Affordability of service
Units: USD/year
Definition: Annual water bill for a household consuming 6 cubic meters (m3) of water per month through a household or shared yard tap.
Guidance: This is aligned with IBNET indicator 19.2. The indicator is intended to be used in conjunction with any available granular income or willingness-to-pay data to assess whether customers will connect to newly expanded service for due diligence purposes. This indicator can be calculated using the tariff regime approved for the utility for the year. Based on the specific country context, this indicator can include wastewater charges or any other fixed charges that the customer would incur. There is no universally agreed upon threshold for affordability (annual cost of water bills as a percentage of median household income) and will depend on the country context. For reference, the UNDP recommends 3% and the US EPA recommends 2-2.5%). Any modifications to the definition of this indicator should be documented in the Additional Information column of the indicator definition table in the M&E Plan.
Calculation: Cost in local currency to a household per month of 6 m3 water * 12 months / Exchange rate with US$
Level: Outcome Indicator
Classification: Level
Disaggregation: None
ITT: No
Common Indicator Report: No
(WS-36) Monthly water production available per customer connection
Units: Cubic meters
Definition: Average monthly water supplied to the distribution system (including purchased water, if any) divided by total connections within the utility’s service area.
Guidance: This is aligned with IBNET indicator 3.1. This indicator provides insight into the average volume that will be available to individual connections and is useful to estimate whether existing water production will be able to support expansion of service. This is an important indicator for due diligence and planning when considering expansion of service to new customers with the same source of water. Note that the calculation calls for annual supplied volume (WS-11) divided by 12 months to calculate average monthly supply volume, which is then divided by total number of connections. This indicator can have data availability issues if total water production volume is not known (e.g., from multiple sources, unmetered production boreholes), there is high physical losses in the distribution network, and if the customer database is not updated with the most accurate count of customer connections.
Calculation: Annual supplied volume in cubic meters/(total customer connections*12 months)
Level: Outcome Indicator
Classification: Level
Disaggregation: None
ITT: Yes
Common Indicator Report: No
Water Supply, Sanitation and Hygiene Common Indicator Inputs and Disaggregations
(WS-5) Temporary employment generated in water and sanitation construction
WS-5.1 Temporary employment generated in water and sanitation construction (Female)
WS-5.2 Temporary employment generated in water and sanitation construction (Male)
(WS-6) Individuals trained in social and behavior change
WS-6.1 Individuals trained in hygiene and sanitary best practices (Female)
WS-6.2 Individuals trained in hygiene and sanitary best practices (Male)
WS-6.3 Individuals trained in hygiene and sanitary best practices (Role)[[Disaggregations by role do not require unique common indicator codes in the M&E Plan.]]
(WS-7) Water points constructed
(WS-8) Proportion of non-revenue water
WS-8.1 Paid billed volume by all customers
WS-8.2 Supplied water volume (WS-8)
WS-8.3 Proportion of non-revenue water (Geographical area)[[Disaggregations by geographic area do not require unique common indicator codes in the M&E Plan.]]
(WS-9) Continuity of service
WS-9.1 Continuity of service (Relative high-income neighborhood)
WS-9.2 Continuity of service (Relative low-income neighborhood)
(WS-10) Proportion of operating costs covered by revenue
WS-10.1 Total annual operational revenue
WS-10.2 Total annual operational cost (including maintenance)
(WS-11) Supplied water volume
WS-11.1 Supplied water volume (Surface water)
WS-11.2 Supplied water volume (Groundwater)
WS-11.3 Supplied water volume (Desalination)
WS-11.4 Supplied water volume (Reclaimed water)
WS-11.5 Supplied water volume (Other)
(WS-12) Use of safely managed drinking water services
(WS-13) Use of safely managed sanitation and a hand-washing facility
(WS-14) Residential water consumption
WS-14.1 Residential water consumption (Customer profile)[[Disaggregations by customer profile do not require unique common indicator codes in the M&E Plan.]]
(WS-15) Industrial/Commercial water consumption
WS-15.1 Industrial/Commercial water consumption (Size of consumer)[[Disaggregations by size of the commercial consumer do not require unique common indicator codes in the M&E Plan.]]
(WS-16) Prevalence of diarrhea
WS-16.1 Prevalence of diarrhea (Under age 5)
WS-16.2 Prevalence of diarrhea (5 years and older)
(WS-17) Length of drains constructed or rehabilitated
(WS-18)Proportion of billing collected
WS-18.1 Total revenue collected
WS-18.2 Total billed revenue
WS-18.3 Total revenue collected (Poor)
WS-18.4 Total revenue collected (Non-poor)
WS-18.5 Total billed revenue (Poor)
WS-18.6 Total billed revenue (Non-poor)
(WS-19) Utility staff per 1000 connections
W-19.1 Utility staff * 1,000
W-19.2 Total customer connections (WS-19)
(WS-20)Customer complaints relative to total connections
WS-20.1 Customer complaints
WS-20.2 Total customer connections (WS-20)
(WS-21) Proportion of tests passing drinking water quality criteria
(WS-22) Proportion of wastewater treated
(WS-23) Water service coverage
WS-23.1 Population with access to water services
WS-23.2 Population in water service area
WS-23.3 Population with access to water services (Household connections)
WS-23.4 Population with access to water services (Public water points)
WS-23.5 Population with access to water services (Poor)
WS-23.6 Population with access to water services (Non-poor)
(WS-24) Sewerage service coverage
WS-24.1 Population with access to sewerage services
WS-24.2 Population in sewerage service area
(WS-25) Total customer connections
WS-25.1 Total customer connections (Water only)
WS-25.2 Total customer connections (Water and wastewater)
(WS-26) Sanitation facilities constructed
(WS-27) Length of water pipes constructed, replaced or rehabilitated
WS-27.1 Length of water pipes constructed, replaced or rehabilitated (Contract/geographical area/neighborhood)[[Disaggregations of WS-27 do not require unique common indicator codes in the M&E Plan.]]
(WS-28) Length of sewers constructed or replaced
WS-28.1 Length of sewers constructed or replaced (Contract/geographical area/neighborhood)[[Disaggregations of WS-28 do not require unique common indicator codes in the M&E Plan.]]
(WS-29) Reservoirs or pumping stations constructed or rehabilitated
(WS-30) Customer water meters installed or replaced
WS-30.1 Customer water meters installed or replaced (New)
WS-30.2 Customer water meters installed or replaced (Replacement)
(WS-31) Water supply kiosks built
WS-31.1 Water supply kiosks built (Neighborhood income)[[Disaggregations of WS-31 do not require unique common indicator codes in the M&E Plan.]]
(WS-32) Treatment process units within centralized water or wastewater treatment facilities constructed, rehabilitated, or expanded
WS-32.1 Treatment process units within centralized water or wastewater treatment facilities constructed, rehabilitated, or expanded (Water)
WS-32.2 Treatment process units within centralized water or wastewater treatment facilities constructed, rehabilitated, or expanded (Wastewater)
(WS-33) Water production capacity added
(WS-34) Time spent collecting water
WS-34.1 Time spent collecting water (Adult male)
WS-34.2 Time spent collecting water (Adult female)
WS-34.3 Time spent collecting water (Male child under 15)
WS-34.4 Time spent collecting water (Female child under 15)
(WS-35) Affordability of service
(WS-36) Monthly water production available per customer connection
Education
Output Indicators
(E-3) Legal, financial, and policy reforms adopted
Units: Number
Definition: The number of reforms adopted by the public sector attributable to compact support that increase the education sector’s capacity to improve access, quality, and /or relevance of education at any level, from primary to post-secondary.
Level: Output Indicator
Classification: Cumulative
Disaggregation: None
ITT: Yes
Common Indicator Report: Yes
(E-4) Educational facilities constructed or rehabilitated
Units: Number
Definition: The number of educational facilities constructed or rehabilitated according to standards stipulated in MCA contracts signed with implementers.
Guidance: Facilities include classrooms, labs, schools and administrative offices. A facility that receives multiple improvements should be counted only once, as one facility constructed or rehabilitated.
Level: Output Indicator
Classification: Cumulative
Disaggregation: None
ITT: Yes
Common Indicator Report: Yes
(E-5) Instructors trained
Units: Number
Definition: The number of classroom instructors who complete MCC-supported training focused on instructional quality as defined by the compact training activity.
Guidance: Each country should define clearly what it means to “train” an instructor. This should be documented in the Additional Information column of the indicator definition table in the M&E Plan. An individual who receives training or technical assistance multiple times should be counted only once, as one individual trained.
Level: Output Indicator
Classification: Cumulative
Disaggregation: Sex (Female/Male)
ITT: Yes
Common Indicator Report: Yes
Outcome Indicators
(E-6) Students participating in MCC-supported education activities
Units: Number
Definition: The number of students enrolled or participating in MCC-supported educational schooling programs.
Guidance: To report on this indicator, the total enrollment in an education activity should be reported and then each year only the additional enrollment should be added to the existing actual. An individual who receives training or technical assistance multiple times should be counted only once, as one individual trained.
Level: Outcome Indicator
Classification: Cumulative
Disaggregation: (A) Sex (Female/Male); (B) Education level (Primary/Secondary/Post-secondary)
ITT: Yes
Common Indicator Report: Yes
(E-7) Graduates from MCC-supported education activities
Units: Number
Definition: The number of students graduating from the highest grade (year) for that educational level in MCC-supported education schooling programs.
Level: Outcome Indicator
Classification: Cumulative
Disaggregation: (A) Sex (Female/Male); (B) Education level (Primary/Secondary/Post-secondary)
ITT: Yes
Common Indicator Report: Yes
(E-8) Employed graduates of MCC-supported education activities
Units: Number
Definition: The number of MCC-supported training program graduates employed in their field of study within one year after graduation.
Guidance: Each country should define “field of study” clearly and this should be documented in the Additional Information column of the indicator definition table in the M&E Plan.
Level: Outcome Indicator
Classification: Cumulative
Disaggregation: Sex (Female/Male)
ITT: Yes
Common Indicator Report: Yes
Education Common Indicator Inputs and Disaggregations
(E-3) Legal, financial, and policy reforms adopted
(E-4) Educational facilities constructed or rehabilitated
(E-5) Instructors trained
E-5.1 Instructors trained (Female)
E-5.2 Instructors trained (Male)
(E-6) Students participating in MCC-supported education activities
E-6.1 Students participating in MCC-supported education activities (Female)
E-6.2 Students participating in MCC-supported education activities (Male)
E-6.3 Students participating in MCC-supported education activities (Primary)
E-6.4 Students participating in MCC-supported education activities (Secondary)
E-6.5 Students participating in MCC-supported education activities (Post-secondary)
(E-7) Graduates from MCC-supported education activities
E-7.1 Graduates from MCC-supported education activities (Female)
E-7.2 Graduates from MCC-supported education activities (Male)
E-7.3 Graduates from MCC-supported education activities (Primary)
E-7.4 Graduates from MCC-supported education activities (Secondary)
E-7.5 Graduates from MCC-supported education activities (Post-secondary)
(E-8) Employed graduates of MCC-supported education activities
E-8.1 Employed graduates of MCC-supported education activities (Female)
E-8.2 Employed graduates of MCC-supported education activities (Male)
Power (in Energy)
Introduction to Power Common Indicators
This section includes two lists of indicators for power investments, i.e., those that involve the provision of electricity, which fall under the broader Energy Sector. The first is the list of common indicators for all power projects. These indicators aim to meet the criteria for common indicators at MCC (listed below) and provide a snapshot of all power investments in MCC’s portfolio. Due to the complexity of the sector, the indicators have been broken down into generation, transmission, distribution, and institutional reform (as indicated in Table 1). As not all compacts target every portion of a country’s power infrastructure, this table provides guidance on which common indicators are applicable to the different types of projects funded by MCC. Each compact should only include common indicators that are relevant to the intervention; if the country team would also like to include indicators from a different type of project for information purposes, these should not be assigned the common indicator code.
The second list is a set of reference indicators that may be useful and relevant measures for a power sector compact to monitor, but may not meet the criteria for a common indicator. The goal of this list is to provide an initial guide for M&E leads new to the power sector on which indicators they may consider for their projects.
This list of indicators is intended to supplement the list of common indicators for power.[[In situations where data quality or measurement capability cannot support reporting on some common indicators, proxy indicators are also provided in this supplemental list. In particular, alternative indicators for measuring the duration (P-21) and frequency (P-22) of outages are provided in this reference list.]]
Both the common indicators and the list of reference indicators reflect input from M&E leads, the infrastructure team, and economic analysis. Lastly, some of the common indicators align with those that MCC will report to Power Africa, a USG interagency effort to help countries expand electricity access across the African continent, as part of MCC’s contribution to this broader initiative. These indicators, along with their corresponding Power Africa indicators, are identified and footnoted in the document.
Table 1: Power Common Indicators by Sector Segment
Generation (4)
Transmission(66 kV and above) (4)
Distribution (Below 66 kV)(6)
Institutional Reform (7)
Process(1)
(P-5) Temporary employment generated in power infrastructure construction
Output(9)
(P-6)Generation capacity added
(P-7) Kmtransmission lines upgraded or built
(P-8) Transmission throughput capacity added
(P-9) Transmission substation capacity added
(P-10) Kmdistribution lines upgraded or built
(P-11) Distribution substation capacity added
(P-12) Customers added by project
(P-13) Maintenance expenditure-asset value ratio
(P-14) Cost-reflective tariff regime
Outcome (12)
(P-15) Total electricity supply
(P-16) Power plant availability
(P-17) Installed generation capacity
(P-18) Transmission system technical losses (%)
(P-19) Distribution system losses
(P-21) System Average Interruption Duration Index (SAIDI)
(P-22) System Average Interruption Frequency Index (SAIFI)
(P-23) Total electricity sold
(P-20) Commercial losses
(P-24) Operating cost- recovery ratio
(P-25) Percentage of households connected to the national grid
(P-26) Share of renewable energy in the country
Common Indicators for Power Sector
Process Indicators
(P-5) Temporary employment generated in power infrastructure construction
Units: Number
Definition: The number of people temporarily employed or contracted by MCA- contracted construction companies to work on construction of new power infrastructure or reconstruction, rehabilitation, or upgrading of existing power infrastructure.
Guidance: This indicator counts the unique number of people contracted, not the amount of time that those people were temporarily employed. Even if a person was contracted for 1 day, he/she should be counted. Both local and foreign workers should be included but identified separately. Foreign workers are any workers who require a residential permit to be working in the country; anyone considered a national in the country should be counted as a local worker. Those performing labor that requires specialized training or a learned skill-set to perform the work should be counted as skilled workers. Those performing labor that requires some skill that may not be performed by an unskilled worker, but not highly specialized skills, should be counted as semi-skilled workers. Those performing labor that does not require special training or skills should be counted as unskilled workers.
Informal employment generated by construction activities is not included. However, if an individual worked on the project in one quarter, stopped working, and rejoined later, s/he should only be counted once. Therefore, tracking this indicator requires a process for uniquely identifying workers, which should be required in the scope of work for relevant contractors.
Level: Process Indicator
Classification: Cumulative
Disaggregation: Sex (Female/Male); Labor source (Foreign/Local); Skill level (Skilled/Semi-skilled/Un-skilled)
Targets: Not required
ITT: Yes
Common Indicator Report: Yes
Output Indicators
(P-6) Generation capacity added[[USG Power Africa (PA) Indicator: Generation Capacity Commissioned]]
Units: Megawatts
Definition: Generation capacity added, measured in megawatts, resulting from construction of new generating capacity or reconstruction, rehabilitation, or upgrading of existing generating capacity funded with MCC support.
Guidance: This will measure change in rated generating capacity. Therefore, all generation sources will be counted at their nameplate capacities at the facility level. This indicator will measure the change in the electricity generation capacity that is due to MCC support. As this is an output indicator, and not an outcome indicator, it will not take into account mitigating circumstances that may lower the capacity available at a generation station, such as lower capacity due to water level or silt build up or weed infestation, etc.
Level: Output Indicator
Classification: Cumulative
Disaggregation: (A) Power generation source (On-grid/Off-grid); (B) Power source type (Renewable (including hydro)/Thermal)[[Thermal generation includes energy from burning a fuel source, such as coal or natural gas.]]
ITT: Yes
Common Indicator Report: Yes
(P-7) Kilometers of transmission lines upgraded or built[[USG Power Africa (PA) Indicator: Kilometers of Power Lines Constructed or Rehabilitated]]
Units: Kilometers
Definition: The sum of linear kilometers of new, reconstructed, rehabilitated, or upgraded transmission lines that have been energized, tested and commissioned with MCC support.
Guidance: Electrical lines of 66 kV or above shall be classified as transmission lines. Transmission consists of all lines connecting the generation sites to transmission substations.
Level: Output Indicator
Classification: Cumulative
Disaggregation: None
ITT: Yes
Common Indicator Report: Yes
(P-8) Transmission throughput capacity added
Units: Megawatts
Definition: The increase in throughput capacity, measured in megawatts, added by new, reconstructed, rehabilitated, or upgraded transmission lines that have been energized, tested and commissioned with MCC support.
Guidance: The target for the indicator should be informed by feasibility and load flow studies of the relevant MCC investment in the transmission network, and should reflect the increase in capacity of the network to transmit electricity between key transmission and distribution nodes. At minimum, the indicator should be reported as an overall change in network throughput capacity. However, as feasible and appropriate, the value of the indicator should be disaggregated by voltage level. Values reported across separate investments in higher capacity lines at different parts of the network are not additive with each other, so reporting on the indicator cannot be easily aggregated across the whole network, although more detailed modeling may allow for this. The value of this indicator should ideally be informed by load flow analysis after the new or upgraded lines have been energized, tested and commissioned.
Level: Output Indicator
Classification: Level
Disaggregation: None
ITT: Yes
Common Indicator Report: Yes
(P-9) Transmission substation capacity added[[USG Power Africa (PA) Indicator: Substation Capacity Added]]
Units: Megavolt ampere
Definition: The total added transmission substation capacity, measured in megavolt amperes, that is energized, commissioned and accompanied by a test report and supervising engineer’s certification resulting from new construction or refurbishment of existing substations that is due to MCC support.
Guidance: This indicator shall include the total capacity installed at a substation. As this is an output indicator, and not an outcome indicator, it will not take into account mitigating circumstances that may lower the capacity available at a substation, such as percentage of use or reserve capacity in substations.
Level: Output Indicator
Classification: Cumulative
Disaggregation: None
ITT: Yes
Common Indicator Report: Yes
(P-10) Kilometers of distribution lines upgraded or built[[USG Power Africa (PA) Indicator: Kilometers of Power Lines Constructed or Rehabilitated]]
Units: Kilometers
Definition: The sum of linear kilometers of new, reconstructed, rehabilitated, or upgraded distribution lines that have been energized, tested and commissioned with MCC support.
Guidance: Electrical lines below 66 kV shall be classified as distribution Distribution consists of all lines connecting from transmission substations down to end consumers or as close to end customers as the lines are constructed with MCC support (typically they include 33kV, 11kV and 0.4kV).
Level: Output Indicator
Classification: Cumulative
Disaggregation: None
ITT: Yes
Common Indicator Report: Yes
(P-11) Distribution substation capacity added[[USG Power Africa (PA) Indicator: Substation Capacity Added]]
Units: Megavolt ampere
Definition: The total added substation capacity, measured in megavolt amperes, that is energized, commissioned and accompanied by a test report and supervising engineer’s certification resulting from new construction or refurbishment of existing substations supported by MCC.
Guidance: This indicator shall include the total capacity installed at a substation. As this is an output indicator, and not an outcome indicator, it will not take into account mitigating circumstances that may lower the capacity available at a substation, such as percentage of use or reserve capacity in substations.
Level: Output Indicator
Classification: Cumulative
Disaggregation: None
ITT: Yes
Common Indicator Report: Yes
(P-12) Customers added by project[[USG Power Africa (PA) Indicator: Electricity Access]]
Units: Number
Definition: The number of new customers that have gained access to a legal connection to electricity service from an electrical utility or service provider as a direct output of an MCC-funded project or intervention.
Guidance: Since new customers are continually added by most electric utilities independently of MCC support, this indicator should capture new connections only for customers targeted by an MCC-funded project or intervention where MCC has funded connection costs either partially or in full. Reporting for this indicator should be based on monitoring data submitted by the MCA, in coordination with the electric utility. Residential customers should be disaggregated by male vs. female- headed households.
Level: Output Indicator
Classification: Cumulative
Disaggregation: (A) Tariff class (Residential/Commercial/Industrial); (B) Household head (Female-headed household/ Male-headed household)
ITT: Yes
Common Indicator Report: Yes
(P-13) Maintenance expenditure-asset value ratio
Units: Percentage
Definition: Actual maintenance expenditures / Total value of fixed assets.
Guidance: In order to report on this indicator, electric utilities require an organized planning process and strategy for asset management, which includes maintenance budgeting for their network. Maintenance expenditures are classified as those that are directed at conducting preventive, operational, or corrective maintenance and repairs to existing assets, rather than for the procurement or installation of new assets, equipment upgrades, or write-offs. Relevant assets subject to maintenance include any equipment required for the proper functioning of the network that the utility is responsible for, such as transmission and distribution lines, transformers, or power generation plants.
Percent deviation from the target is calculated for this indicator instead of percent complete. Progress for this indicator is best tracked by percent deviation from the target, because the actual should be as close to the target as possible. A percent deviation of 0% implies the target has been reached, and percent deviation closer to 0% implies better achievement than a higher percent deviation.
Percent deviation is calculated using the following formula: 100*|Actual- Target|/Target.
Level: Output Indicator
Classification: Level (Cumulative)
Disaggregation: None
ITT: Yes
Common Indicator Report: No
(P-13.1) Actual maintenance expenditures
Units: US Dollars
Definition: Maintenance expenditures are classified as the amount of funds expended by the electric utility that are directed at conducting preventive, operational, or corrective maintenance and repairs to existing assets, rather than for the procurement or installation of new assets, equipment upgrades, or write-offs.
Level: Output Indicator
Classification: Level (Cumulative)
Disaggregation: None
ITT: Yes
Common Indicator Report: No
(P-13.2) Total value of fixed assets
Units: US Dollars
Definition: The value in dollars of the fixed assets that are owned, operated or maintained by the electric utility for the purposes of supplying electricity. Relevant assets subject to maintenance include any equipment required for the proper functioning of the network that the utility is responsible for, such as transmission and distribution lines, transformers, or power generation plants.
Level: Output Indicator
Classification: Level (Cumulative)
Disaggregation: None
ITT: Yes
Common Indicator Report: No
(P-14) Cost-reflective tariff regime
Units: Percentage
Definition: Average tariff per kilowatt-hour / Long-run marginal cost per kilowatt- hour of electricity supplied to customers.
Guidance: Long-run costs are a source of debate in the power sector. Many times energy utilities either do not have a clear understanding of their long-run cost, or have incentives to inflate those costs to receive a higher tariff from regulators. On the other hand, the regulator may have an incentive to keep tariffs down and to underestimate the true long-run costs of the sector.
To obtain a reliable estimate of long-run marginal cost, MCC should use the figure calculated by a third party (i.e., neither the regulator, nor the utility). This could be part of a cost of service study, tariff reform study, or other due diligence materials. It is advisable that any studies consult an integrated or least cost expansion master plans adopted by government for the sector.
Percent deviation from the target is calculated for this indicator instead of percent complete. Progress for this indicator is best tracked by percent deviation from the target, because the actual should be as close to the target as possible. A percent deviation of 0% implies the target has been reached, and percent deviation closer to 0% implies better achievement than a higher percent deviation.
Percent deviation is calculated using the following formula: 100*|Actual- Target|/Target.
Level: Output Indicator
Classification: Level
Disaggregation: None
ITT: Yes
Common Indicator Report: No
(P-14.1) Average tariff per kilowatt-hour
Units: US Dollars per kilowatt-hour
Definition: The average tariff per kilowatt-hour should be computed as the weighted average of the approved tariffs based on demand projections for each tariff class by the regulator.
Guidance: Generally, this data should come from the regulator.
Level: Output Indicator
Classification: Level
Disaggregation: None
ITT: Yes
Common Indicator Report: No
(P-14.2) Long-run marginal cost per kilowatt-hour of electricity supplied to customers
Units: US Dollars per kilowatt-hour
Definition: Long-run cost of operating, maintaining, and expanding the power grid, inclusive of generation, transmission, and distribution costs based on the integrated or least cost expansion master plans adopted by government for the sector.
Guidance: Long-run costs are a source of debate in the power sector. Many times energy utilities either do not have a clear understanding of their long-run cost, or have incentives to inflate those costs to receive a higher tariff from regulators. On the other hand, the regulator may have an incentive to keep tariffs down and to underestimate the true long-run costs of the sector.
Level: Output Indicator
Classification: Level
Disaggregation: None
ITT: Yes
Common Indicator Report: No
Outcome Indicators
(P-15) Total electricity supply
Units: Megawatt hours
Definition: Total electricity, in megawatt hours, produced or imported in a year.
Guidance: This indicator is generally available from the electric utility or other regulatory body for the sector. It is computed as the sum of gross electricity supplied during the year for all generating stations and imports.
Definition: Unweighted average across all power plants of the following: total number of hours per month that a plant is able and available to produce electricity / Total number of hours in the same month.
Guidance: The objective of measuring availability is to gauge the quality of maintenance being carried out at the plant. For reporting purposes, MCA should aggregate monthly data within a reporting quarter to provide quarterly averages. For hydroelectric plants impacted by low water levels or weed and sediment problems, plants may occasionally be ‘able’ to produce electricity yet still be ‘unavailable’ due to these issues. Also, power plants may also be unavailable due to factors outside the control of the generating station, such as the unavailability of transmission lines or lack of fuel. Accordingly, MCA should track any factors outside the control of or planned by the generating station while calculating the ‘availability’ percentage.
Percent deviation from the target is calculated for this indicator instead of percent complete. Progress for this indicator is best tracked by percent deviation from the target, because the actual should be as close to the target as possible. A percent deviation of 0% implies the target has been reached, and percent deviation closer to 0% implies better achievement than a higher percent deviation.
Percent deviation is calculated using the following formula: 100*|Actual- Target|/Target.
Level: Outcome Indicator
Classification: Level
Disaggregation: None
ITT: Yes
Common Indicator Report: No
(P-17) Installed generation capacity
Units: Megawatts
Definition: Total generation capacity, in megawatts, installed plants can generate within the country.
Guidance: The objective of measuring generation capacity is to gauge progress on expansion of the overall power sector, which depends on a variety of factors that may be addressed by MCC investments in both power infrastructure and institutional reform, such as improvements in regulatory independence and effectiveness and the execution of a credible sector expansion plan. The indicator should be available from relevant sector institutions responsible for policy development, and should be reported in terms of rated capacity of all sources of generation, rather than effective generation capacity. Off-grid generation capacity includes all isolated power plants or local grids that are not part of an interconnected network, but does not include captive generation or self-generation capacities.
Level: Outcome Indicator
Classification: Level
Disaggregation: (A) Power generation source (On-grid/Off-grid)
ITT: Yes
Common Indicator Report: Yes
(P-18) Transmission system technical losses
Units: Percentage
Definition: 1- [Total megawatt hours transmitted out from transmission substations / Total megawatt hours received from generation to transmission substations].
Guidance: Quarterly estimates should be reported if available; however, collection of data on losses is often unavailable due to insufficient monitoring equipment and estimates are often made based on periodic loss characterization or load flow studies. Data quality reviews can also serve to improve estimates at baseline while recommending steps to improve accuracy of estimates during the compact. In some cases, this indicator may not be appropriate to use if there are separate incorporated entities responsible for operating the transmission network, where the utility company may only be responsible for distribution – especially if the compact is only focusing on one subsector (e.g., distribution).
Level: Outcome Indicator
Classification: Level
Disaggregation: None
ITT: Yes
Common Indicator Report: No
(P-18.1) Total megawatt hours transmitted out from transmission substations
Units: Megawatt hours
Definition: Total electricity, in megawatt hours, transmitted out from transmission substations.
Level: Outcome Indicator
Classification: Level
Disaggregation: None
ITT: Yes
Common Indicator Report: No
(P-18.2) Total megawatt hours received from generation to transmission substations
Units: Megawatt hours
Definition: Total electricity, in megawatt hours, received from generation to transmission substations.
Level: Outcome Indicator
Classification:Level
Disaggregation: None
ITT: Yes
Common Indicator Report: No
(P-19) Distribution system losses
Units: Percentage
Definition: 1 – [Total megawatt hours billed / Total megawatt hours received from transmission].
Guidance: This indicator is a measure of both technical and commercial losses. The ability to measure and report on technical losses will often be limited by the extent to which an electric utility is able to measure or estimate its commercial losses, which many do not routinely monitor. A data quality review should be performed early during compact implementation to determine the utility’s capacity for reporting on this indicator, and to assess what investments in data quality and monitoring equipment must be made to enable reporting. Data should be reported at the highest level possible, likely at the utility or national level.
Level: Outcome Indicator
Classification: Level
Disaggregation: None
ITT: Yes
Common Indicator Report: No
(P-19.1) Total megawatt hours billed
Units: Megawatt hours
Definition: Total electricity, in megawatt hours, for which a bill was sent to customers or which was consumed through prepaid metering.
Level: Outcome Indicator
Classification: Level
Disaggregation: None
ITT: Yes
Common Indicator Report: No
(P-19.2) Total megawatt hours received from transmission
Units: Megawatt hours
Definition: Total electricity, in megawatt hours, received from transmission substations.
Level: Outcome Indicator
Classification: Level
Disaggregation: None
ITT: Yes
Common Indicator Report: No
(P-20) Commercial losses
Units: Percentage
Definition: Total distribution system losses minus distribution technical losses.
Guidance: This indicator may often not be directly reportable by electric utilities due to limited investment in monitoring equipment, or due to infrequent and irregular attempts to determine the extent of commercial losses. In addition, without sufficient capacity to monitor distribution system technical losses, it may not be possible to reliably assess commercial (also known as non-technical) losses distinctively from technical losses. A data quality review should be performed early during compact implementation to determine the utility’s capacity for reporting on this indicator, and to assess what investments in data quality and monitoring equipment must be made to enable reporting.
Level: Outcome Indicator
Classification: Level
Disaggregation: None
ITT: Yes
Common Indicator Report: No
(P-20.1) Total distribution system losses
Units: Percentage
Definition: 1 – [Total megawatt hours billed / Total megawatt hours received from transmission].
Level: Outcome Indicator
Classification: Level
Disaggregation: None
ITT: Yes
Common Indicator Report: No
(P-20.2) Distribution technical losses
Units: Percentage
Definition: The amount of power dissipated in distribution lines and transformers due to internal electrical resistance.
Level: Outcome Indicator Classification: Level
Disaggregation: None
ITT: Yes
Common Indicator Report: No
(P-21) System Average Interruption Duration Index (SAIDI)
Units: Hours
Definition: Sum of durations, in customer-hours, of all customer interruptions in a quarter / Total number of customers connected to network in the same quarter.
Guidance: This indicator is a standardized measure used to assess reliability among electric utilities, and relies on the existence of well-functioning monitoring and data acquisition equipment throughout the network, as well as an accurately maintained customer database for mapping customers to feeder lines. A data quality review should be performed early during compact implementation to determine the utility’s capacity for reporting on this indicator, and to assess what investments in data quality must be made to enable reporting. A proxy indicator may also be used in cases where the data required for calculating the index is unavailable or of inadequate quality. The definition of the recommended proxy indicator is provided in the list of reference indicators for power compacts, and is found under Average Duration of Outages/Interruptions.
Level: Outcome Indicator
Classification: Level
Disaggregation: None
ITT: Yes
Common Indicator Report: No
(P-21.1) Sum of durations of all customer interruptions in a quarter
Units: Number
Definition: The sum of the durations of each period of time each customer did not receive power in a given quarter.
Level: Outcome Indicator
Classification: Level
Disaggregation: None
ITT: Yes
Common Indicator Report: No
(P-21.2) Total number of customers connected to network in the same quarter
Units: Number
Definition: The total number of customers connected to the network in the same quarter.
Level: Outcome Indicator
Classification: Level
Disaggregation: None
ITT: Yes
Common Indicator Report: No
(P-22) System Average Interruption Frequency Index (SAIFI)
Units: Rate
Definition: Sum of customer-interruptions in a quarter / Total number of customers connected to network in the same quarter.
Guidance: This indicator is a standardized measure used to assess reliability among electric utilities, and relies on the existence of well-functioning monitoring and data acquisition equipment throughout the network, as well as an accurately maintained customer database for mapping customers to feeder lines. A data quality review should be performed early during compact implementation to determine the utility’s capacity for reporting on this indicator, and to assess what investments in data quality must be made to enable reporting. A proxy indicator may also be used in cases where the data required for calculating the index is unavailable or of inadequate quality. The definition of the recommended proxy indicator is provided in the list of reference indicators for power compacts, and is found under Average Frequency of Outages/Interruptions.
Level: Outcome Indicator
Classification: Level
Disaggregation: None
ITT: Yes
Common Indicator Report: No
(P-22.1) Sum of customer-interruptions in a quarter
Units: Number
Definition: Sum of customer-interruptions in a quarter.
Level: Outcome Indicator
Classification: Level
Disaggregation: None
ITT: Yes
Common Indicator Report: No
(P-22.2) Total number of customers connected to network in the same quarter
Units: Number
Definition: The total number of customers connected to the network in the same quarter.
Level: Outcome Indicator
Classification: Level
Disaggregation: None
ITT: Yes
Common Indicator Report: No
(P-23) Total electricity sold
Units: Megawatt hours
Definition: The total megawatt hours of electricity sales to all customer types.
Guidance: The indicator should be reported at the level that is most appropriate and relevant to a given compact or project, but will most commonly be reported at the level of a single utility, which may serve a large region of the country or the country as a whole. The indicator description should also identify whether the source of data is from billing records or financial estimates.
Level: Outcome Indicator
Classification: Level (Cumulative)
Disaggregation: Tariff class (Residential/Commercial/Industrial)
ITT: Yes
Common Indicator Report: Yes
(P-24) Operating cost-recovery ratio
Units: Percentage
Definition: Total revenue collected / Total operating cost. Total operating cost is defined as operating expenses plus depreciation.
Guidance: Cost-reflective tariffs aim to set electricity price per kilowatt-hour to account for revenue requirements including operating costs and depreciation, and in many cases even capital costs (if cost of new expansion is captured through tariffs). Many times utilities do not have a clear understanding of their effective cost for operating and capital expansion. To obtain reliable estimates of these figures, data should be triangulated with information available through the relevant regulatory authorities, cost of service studies and integrated and least cost expansion or master plans for the sector. Data reporting for this indicator may depend on audited financial accounts, which are often only audited annually rather than quarterly.
Percent deviation from the target is calculated for this indicator instead of percent complete. Progress for this indicator is best tracked by percent deviation from the target, because the actual should be as close to the target as possible. A percent deviation of 0% implies the target has been reached, and percent deviation closer to 0% implies better achievement than a higher percent deviation.
Percent deviation is calculated using the following formula: 100*|Actual- Target|/Target.
Level: Outcome Indicator
Classification: Level (Cumulative)
Disaggregation: None
ITT: Yes
Common Indicator Report: No
(P-24.1) Total revenue collected
Units: US Dollars
Definition: The total revenue collected by the utility in a given period.
Level: Outcome Indicator
Classification: Level (Cumulative)
Disaggregation: None
ITT: Yes
Common Indicator Report: No
(P-24.2) Total operating cost
Units: US Dollars
Definition: Operating expenses plus depreciation.
Level: Outcome Indicator
Classification: Level (Cumulative)
Disaggregation: None
ITT: Yes
Common Indicator Report: No
(P-25) Percentage of households connected to the national grid
Units: Percentage
Definition: Number of households that have access to a legal connection to electricity service from an electrical utility or service provider / Total number of households in the country.
Guidance: The objective of this indicator is to measure trends in the percentage of the population with access to electricity provided through an electrical utility or other service provider. Reporting for this indicator should be based on monitoring data submitted by the MCA, in coordination with the electric utility and the most recent census or any nationally representative household survey data; this latter source may vary by country.
Level: Outcome Indicator
Classification: Level
Disaggregation: None
ITT: Yes
Common Indicator Report: No
(P-25.1) Households that have access to a legal connection to electricity service from an electrical utility or service provider
Units: Number
Definition: Number of households that have access to a legal connection to electricity service from an electrical utility or service provider.
Level: Outcome Indicator
Classification: Level
Disaggregation: None
ITT: Yes
Common Indicator Report: No
(P-25.2) Total number of households in the country
Units: Number
Definition: Total number of households in the country.
Level: Outcome Indicator
Classification: Level
Disaggregation: None
ITT: Yes
Common Indicator Report: No
(P-26) Share of renewable energy in the country
Units: Percentage
Definition: Total installed generation capacity of on- or off-grid renewable energy, in megawatts / Total installed generation capacity.
Guidance: For this indicator, renewable energy shall be defined as on- or off-grid sources of electricity generation derived from naturally replenished resources including such as wind, hydropower, solar energy, biomass, or biofuel. The indicator should be available from relevant sector institutions responsible for policy development, and should be reported in terms of rated or installed capacity of all sources of generation, rather than effective generation capacity.
Level: Outcome
Classification: Level
Disaggregation: None
ITT: Yes
Common Indicator Report: No
(P-26.1) Total installed generation capacity of on- or off-grid renewable energy
Units: Megawatts
Definition: Total generation capacity, in megawatts, of installed hydropower, solar, wind, biomass, or biofuel plants within the country.
Level: Outcome
Classification: Level
Disaggregation: None
ITT: Yes
Common Indicator Report: No
(P-26.2) Total installed generation capacity
Units: Megawatts
Definition: Total generation capacity, in megawatts, installed plants can generate within the country.
Level: Outcome
Classification: Level
Disaggregation: None
ITT: Yes
Common Indicator Report: No
Power Common Indicator Inputs and Disaggregations
(P-5) Temporary employment generated in power infrastructure construction
P-5.1 Temporary employment generated in power infrastructure construction (Female)
P-5.2 Temporary employment generated in power infrastructure construction (Male)
P-5.3 Temporary employment generated in power infrastructure construction (Foreign)
P-5.4 Temporary employment generated in power infrastructure construction (Local)
P-5.5 Temporary employment generated in power infrastructure construction (Skilled)
P-5.6 Temporary employment generated in power infrastructure construction (Semi-skilled)
P-5.7 Temporary employment generated in power infrastructure construction (Un-skilled)
(P-7)Kilometers of transmission lines upgraded or built
(P-8) Transmission throughput capacity added
(P-9) Transmission substation capacity added
(P-10) Kilometers of distribution lines upgraded or built
(P-11) Distribution substation capacity added
(P-12) Customers added by project
P-12.1 Customers added by project (Residential)
P-12.2 Customers added by project (Commercial)
P-12.3 Customers added by project (Industrial)
P-12.4 Customers added by project (Female-headed household)
P-12.5 Customers added by project (Male-headed household)
(P-13) Maintenance expenditure-asset value ratio
P-13.1 Actual maintenance expenditures
P-13.2 Total value of fixed assets
(P-14) Cost-reflective tariff regime
P-14.1 Average tariff per kilowatt-hour
P-14.2 Long-run marginal cost per kilowatt-hour of electricity supplied to customers
(P-15) Total electricity supply
P-15.1 Total electricity supply (Domestic)
P-15.2 Total electricity supply (Imports)
P-15.3 Total electricity supply (Independent Power Producer)
P-15.4 Total electricity supply (Government-owned)
(P-16) Power plant availability
(P-17) Installed generation capacity
P-17.1 Installed generation capacity (On-grid)
P-17.2 Installed generation capacity (Off-grid)
(P-18) Transmission system technical losses
P-18.1 Total megawatt hours transmitted out from transmission substations
P-18.2 Total megawatt hours received from generation to transmission substations
(P-19) Distribution system losses
P-19.1 Total megawatt hours billed
P-19.2 Total megawatt hours received from transmission
(P-20) Commercial losses
P-20.1 Total distribution system losses
P-20.2 Distribution technical losses
(P-21) System Average Interruption Duration Index (SAIDI)
P-21.1 Sum of durations of all customer interruptions in a quarter
P-21.2 Total number of customers connected to network in the same quarter
(P-22) System Average Interruption Frequency Index (SAIFI)
P-22.1 Sum of customer-interruptions in a quarter
P-22.2 Total number of customers connected to network in the same quarter
(P-23) Total electricity sold
P-23.1 Total electricity sold (Residential)
P-23.2 Total electricity sold (Commercial)
P-23.3 Total electricity sold (Industrial)
(P-24) Operating cost-recovery ratio
P-24.1 Total revenue collected
P-24.2 Total operating cost
(P-25) Percentage of households connected to the national grid
P-25.1 Households that have access to a legal connection to electricity service from an electrical utility or service provider
P-25.2 Total number of households in the country
(P-26) Share of renewable energy in the country
P-26.1 Total installed generation capacity of on- or off-grid renewable energy
P-26.2 Total installed generation capacity
List of Reference Indicators for Power Sector Compacts
Output Indicators
Transition to pre-paid metering system
Units: Percentage
Definition: Number of customers with pre-paid meters installed / Total number of customers
Rationale: Indicates progress by the utility in transitioning to a pre-paid metering system and thereby improving revenue collection.
Level: Output Indicator
Classification: Level
Disaggregation: None
ITT: Yes
Common Indicator Report: No
Outcome Indicators
Collection rate
Units: Percentage
Definition: [Trailing twelve months of total value of post-paid bills collected /Total value of bills issued for same customers in trailing twelve months]x 100
Rationale: Measure of the efficiency of revenue collection, specifically the percentage of receivables collected from customers.
Guidance: Existing billing systems may not segregate the arrear amount collected from post-paid customers. As such, the revenue from post-paid bills collected in a current month may also include arrears and late surcharge payments, which are not accounted separately. The indicator can be collected on a monthly basis, but it is highly variable – therefore only annual averages should be reported, using trailing twelve-month data.
Level: Outcome Indicator
Classification: Level
Disaggregation: Region
ITT: Yes
Common Indicator Report: No
Debt / Equity ratio
Units: Ratio
Definition: Total long-term debt / Total shareholder’s equity
Rationale: Measures the indebtedness of the electric utility.
Level: Outcome Indicator
Classification: Level
Disaggregation: None
ITT: Yes
Common Indicator Report: No
Average Collection Period
Units: Days
Definition: 365 Days * [(Beginning accounts receivables + ending accounts receivable) / 2) / Total post-paid sales]
Rationale: Measure of the liquidity or financial security of the electric utility and of the efficiency of revenue collection, specifically the time lag between billing and receiving payment. Average collection period of 40 days represents a good revenue collection. The best performers in the region are Rwanda (10), South Africa (46), Lesotho (56) and Namibia (60).
Rationale: Measures how long it takes a company to pay its creditors and indicates company’s creditworthiness from a suppliers’ perspective. A company slow to pay bills – 100 days or more – and which is slow in collecting receivables may have trouble generating cash or obtaining supplies. Indicator should be evaluated next to average collection period.
Level: Outcome Indicator
Classification: Level
Disaggregation: None
ITT: Yes
Common Indicator Report: No
Total System Load Shed
Units: Megawatt-hours
Definition: Total megawatt-hours shed in a year
Rationale: To measure extent and magnitude of generation shortfalls leading to planned outages.
Level: Outcome Indicator
Classification: Level
Disaggregation: None
ITT: Yes
Common Indicator Report: No
Capital Expenditure
Units: US Dollars
Definition: Total value of new equipment installed in the power network through projects funds and/or private sector partners in a year.
Rationale: Measure of reinvestment in the grid.
Level: Outcome Indicator
Classification: Cumulative
Disaggregation: None
ITT: Yes
Common Indicator Report: No
Operating Profit / Loss
Units: US Dollars
Definition: Operating revenue minus operating expenses. Rationale: Measure of utility financial health.
Level: Outcome Indicator
Classification: Level
Disaggregation: None
ITT: Yes
Common Indicator Report: No
Current ratio
Units: Ratio
Definition: Total current assets / Total current liabilities
Rationale: Measure of the liquidity or financial security of the electric utility.
Level: Outcome Indicator
Classification: Level
Disaggregation: None
ITT: Yes
Common Indicator Report: No
Bad debt
Units: Percentage
Definition: Total value of accounts receivables over 90 days / Total accounts receivable
Rationale: Measure of financial losses of the utility due to uncollectable debt. Bad debt may increase in the near term due to increasing tariffs and unit sales, creating additional collection burden.
Level: Outcome Indicator
Classification: Level
Disaggregation: None
ITT: Yes
Common Indicator Report: No
Average Duration of Outages/Interruptions
Units: Hours
Definition: [Total duration, in hours, of interruptions in a quarter / Number of interruptions in the same quarter].
Rationale: Proxy indicator for System Average Interruption Duration Index (SAIDI), a key reliability indicator used in the industry to measure duration of outages.
Outage measurements at transmission substations and generation plants underestimate the magnitude of outages at the customer level. This definition may be used in lieu of SAIDI in cases where the data required for calculating the index is unavailable or of inadequate quality.
Level: Outcome Indicator
Classification: Level
Disaggregation: None
ITT: Yes
Common Indicator Report: No
Average Frequency of Outages/Interruptions
Units: Ratio
Definition: [Total number of customer interruptions in a quarter / Average number of customers served during the same quarter].
Rationale: Proxy indicator for System Average Interruption Frequency Index (SAIFI), a key reliability indicator used in the industry to measure frequency of outages. Outage measurements at transmission substations and generation plants underestimate the magnitude of outages at the customer level. This definition may be used in lieu of SAIFI in cases where the data required for calculating the index is unavailable or of inadequate quality.
Level: Outcome Indicator
Classification: Level
Disaggregation: None
ITT: Yes
Common Indicator Report: No
Revisions to the Guidance on Common Indicators
Introduction
ITT Indicator and Aggregation in the Common Indicator Report
March 2020
Change Description:
The distinctions of “ITT Indicator” and “Common Indicator Report” added to each common indicator
Justification:
These distinctions were added to provide clarity on whether the indicator should be reported in the ITT and/or aggregated in the Common Indicator Report.
Female Ownership
March 2013
Change Description:
A definition of Female Ownership was added to the Introduction
Justification:
A few inquiries were made as to what was MCC’s definition of a female owned business; therefore MCC’s definition was included in this common indicator guidance to provide clarity.
Agriculture and Irrigation
Agriculture and Irrigation Common Indicator Inputs and Disaggregations
March 2016
Change Description:
Codes for Agriculture and Irrigation indicator inputs and disaggregations added
Justification:
The added section assigns codes for Agriculture and Irrigation indicator inputs and disaggregations. These codes are used by MCC’s indicator management system to aggregate values across compacts.
(AI-1 – AI-4)
Financial Common Indicators
November 2020
Change Description:
All Financial Common Indicators, including “Value of signed contracts,” “Value disbursed of contracts,” and “Percent disbursed contracts,” removed for feasibility, design, and construction contracts.
Justification:
These indicators were removed due to a determined lack of utility.
(AI-2)
Percent disbursed of irrigation feasibility and design contracts
March 2013
Change Description:
Classification changed from “Cumulative” to “Level”
Justification:
This indicator reports the amount of signed contracts disbursed as a percentage. The amount of contracts signed and the amount of contracts disbursed are both cumulative over the life of the program. Therefore the percent disbursed is cumulative in nature. However, in MCC’s indicator management system, if this indicator is marked as “Cumulative,” the percent disbursed calculated each quarter will be added together with the previous quarter’s percent disbursed thereby double-counting. Even though this indicator calculates the cumulative amount disbursed compared to the cumulative amount signed, it must be marked as “Level” for MCC’s MIS to display the correct value.
(AI-4)
Percent disbursed of irrigation construction contracts
March 2013
Change Description:
Classification changed from “Cumulative” to “Level”
Justification:
This indicator reports the amount of signed contracts disbursed as a percentage. The amount of contracts signed and the amount of contracts disbursed are both cumulative over the life of the program. Therefore the percent disbursed is cumulative in nature. However, in MCC’s indicator management system, if this indicator is marked as “Cumulative,” the percent disbursed calculated each quarter will be added together with the previous quarter’s percent disbursed thereby double-counting. Even though this indicator calculates the cumulative amount disbursed compared to the cumulative amount signed, it must be marked as “Level” for MCC’s MIS to display the correct value.
(AI-6)
Farmers Trained
(AI-10)
Value of Agricultural and Rural Loans
(AI-12)
Hectares Under Improved Practices as a Result of Training
March 2013
Change Description:
Guidance added.
Justification:
Additional guidance was added to the indicators in order to clarify definitions and/or methods for measurement.
Land
Land Common Indicator Inputs and Disaggregations
March 2016
Change Description:
Codes for Land indicator inputs and disaggregations added
Justification:
The added section assigns codes for Land indicator inputs and disaggregations. These codes are used by MCC’s indicator management system to aggregate values across compacts.
(L-6)
Land rights formalized
March 2016
Change Description:
Disaggregation changed from “Community/Male (only)/Female (only) /Joint male and female” to “Community- owned/Male-headed household/Female-headed household/ Co-headed household”
Justification:
The disaggregation categories of were revised because there was confusion about their meaning.
(L-6)
Land rights formalized
March 2013
Change Description:
Disaggregation changed from “Community/Male (only)/Female (only) /Joint male and female/Joint male/Joint female” to “Community/Male (only)/Female (only) /Joint male and female”
Justification:
The disaggregation categories of “Joint male” and “Joint female” were dropped because there was confusion about their meaning. In addition, the important aspect of understanding whether or not the formalized rights belonged to a male or female is already covered by the categories of “Male (only)” and “Female (only).”
Change Description:
Indicator name changed from “Household land rights formalized” to “Land rights formalized”
Justification:
The indicator name was changed so that both household and commercial land rights could be tracked.
Change Description:
The definition of the indicator was changed from “The number of households receiving formal recognition of ownership and/or use rights through certificates, titles, leases, or other recorded documentation by government institutions or traditional authorities at national or local levels.” to “The number of household, commercial and other legal entities (e.g., NGOs, churches, hospitals) receiving formal recognition of ownership and/or use rights through certificates, titles, leases, or other recorded documentation by government institutions or traditional authorities at national or local levels.”
Justification:
The change in the definition allowed for tracking additional formalization of land rights beyond the household. It now includes commercial and other non-commercial (beyond households) formalization.
Change Description:
New disaggregation added “Household/Commercial and other legal entity”
Justification:
The new disaggregation was added so that commercial and other land rights formalized could be tracked in addition to household land rights.
Change Description:
The Feed the Future indicator number changed from 4.5.1-16 to 4.5.1-25.
Justification:
Feed the Future changed the indicator number from the June and October 2011 FTF Indicator Handbooks.
Transportation
Transportation Common Indicator Inputs and Disaggregations
March 2016
Change Description:
Codes for Roads indicator inputs and disaggregations added
Justification:
The added section assigns codes for Roads indicator inputs and disaggregations. These codes are used by MCC’s indicator management system to aggregate values across compacts.
General Program Logic for Transportation Investments (narrative + diagram)
October 2020
Change Description:
Addition
Justification:
Similar to other sectors in the Common Indicators, this narrative and diagram should be a useful basic framework from which to understand the general theory behind transportation investments and therefore the rationale behind the proposed common indicators.
Definitions of key terms
October 2020
Change Description:
Additions
Justification:
Added some definitions of key terms that are referred to throughout the list of indicators.
Notes
October 2020
Change Description:
Additions
Justification:
Added a section with overarching notes and context on the indicators.
(R-1 – R-2, R4 – R5)
Financial Common Indicators
November 2020
Change Description:
All Financial Common Indicators, including “Value of signed contracts,” “Value disbursed of contracts,” and “Percent disbursed contracts,” removed for feasibility, design, and construction contracts.
Justification:
These indicators were removed due to a determined lack of utility.
(R-2)
Percent disbursed of road feasibility and design contracts
March 2013
Change Description:
Classification changed from “Cumulative” to “Level”
Justification:
This indicator reports the amount of signed contracts disbursed as a percentage. The amount of contracts signed and the amount of contracts disbursed are both cumulative over the life of the program. Therefore the percent disbursed is cumulative in nature. However, in MCC’s indicator management system, if this indicator is marked as “Cumulative,” the percent disbursed calculated each quarter will be added together with the previous quarter’s percent disbursed thereby double-counting. Even though this indicator calculates the cumulative amount disbursed compared to the cumulative amount signed, it must be marked as “Level” for MCC’s MIS to display the correct value.
March 2013
Change Description:
Disaggregation changed from “Primary/Secondary/Tertiary” to “None”
Justification:
Disaggregating the inputs that calculate this indicator as well as the indicator itself was deemed too complicated, especially for MCC’s indicator management system. Since MCC will have the inputs (amount signed and amount disbursed) reported in a disaggregated way, it will be possible to calculate the percent disbursed disaggregated by Primary/Secondary/Tertiary outside of the Indicator Tracking Table.
R-3
Kilometers of roads under design
October 2020
Change Description:
Clarifications
Justification:
Clarification that this indicator measures road lengthregardless of the number of lanes. Further clarification on this in the guidance.
Clarification that the indicator includes all roads under design with MCC funding.
Additional disaggregation by investment type added so various investments can be tracked and reported separately.
(R-5)
Percent disbursed of road construction contracts
March 2013
Change Description:
Classification changed from “Cumulative” to “Level”
Justification:
This indicator reports the amount of signed contracts disbursed as a percentage. The amount of contracts signed and the amount of contracts disbursed are both cumulative over the life of the program. Therefore the percent disbursed is cumulative in nature. However, in MCC’s indicator management system, if this indicator is marked as “Cumulative,” the percent disbursed calculated each quarter will be added together with the previous quarter’s percent disbursed thereby double-counting. Even though this indicator calculates the cumulative amount disbursed compared to the cumulative amount signed, it must be marked as “Level” for MCC’s MIS to display the correct value.
March 2013
Change Description:
Disaggregation changed from “Primary/Secondary/Tertiary” to “None”
Justification:
Disaggregating the inputs that calculate this indicator as well as the indicator itself was deemed too complicated, especially for MCC’s indicator management system. Since MCC will have the inputs (amount signed and amount disbursed) reported in a disaggregated way, it will be possible to calculate the percent disbursed disaggregated by Primary/Secondary/Tertiary outside of the Indicator Tracking Table.
R-6
Kilometers of roads under works contracts
October 2020
Change Description:
Clarifications
Justification:
Clarified that this indicator measures road length, regardless of the number of lanes
Clarified this indicator applies to all types of relevant MCC transportation investments
Disaggregates by type of MCC investment so MCC is able to report on these different types
R-7
Temporary employment generating in road construction
October 2020
Change Description:
Clarifications
Justification:
Clarified this indicator applies to all types of relevant MCC transportation investments
Clarified this indicator is measuring unique individuals
Clarified this indicator does not include informal employment, regardless of the investment type.
Notes that procurement documents may state a target for women’s employment that can be referenced.
(R-8)
Kilometers of Roads Completed
March 2013
Change Description:
Guidance added.
Justification:
Additional guidance was added in order to clarify the indicator
definition.
October 2020
Change Description:
Clarifications
Justification:
Clarified that this indicator measures road length, regardless of the number of lanes
Clarified this indicator applies to all types of relevant MCC transportation investments
Disaggregates by type of MCC investment so MCC is able to report on these different types
Reminds that this indicator does not include bridges
R-13
Lane-kilometers completed
October 2020
Change Description:
Addition
Justification:
Measuring kilometers of roads does not fully capture some investments, especially investments that are short in length but multiple lanes, for example when relieving serious congestion. This indicator takes the number of lanes built into account as well.
R-14
Meters of bridges completed
October 2020
Change Description:
Addition
Justification:
The expected results of bridges are very different from roads, as the counterfactual to a bridge is typically a costly long journey. This indicator allows them to be measured separately and highlighted.
R-15
As-built drawings received
October 2020
Change Description:
Addition
Justification:
It is important that these documents are handed over to the independent evaluator, so they don’t have to collect their own primary data and can just use this information source. This indicator should ensure the handover of the documents is not overlooked.
R-9
Roughness
October 2020
Change Description:
Clarification
Justification:
Clarify the name of the indicator to better reflect the definition and typical engineering parlance.
Added guidance to explain when this indicator is an output and when it is an outcome.
Added guidance on how data collection should be done, to ensure consistency across measurements over time and between projects/programs.
Adding guidance on expectations for timing and sources.
R-10
Average annual daily traffic
October 2020
Change Description:
Clarification
Justification:
Added guidance on sampling if there are many investment segments, adjustment factors, vehicle class categories, and necessary contextual details to document. All of this should ensure consistency across measurements both between rounds and between projects/programs.
R-16
Average daily road users
October 2020
Change Description:
Addition
Justification:
This indicator is necessary for HDM-4 modelling of reduction in transportation costs as a result of the investment.
R-17
Travel time
October 2020
Change Description:
Addition
Justification:
This indicator measures a key result in transportation investments, as per the general program logic at the beginning of the Transportation section of this document.
R-18
Travel Speed
October 2020
Change Description:
Addition
Justification:
This indicator measures a key result in transportation investments, as travel time relates to speed. It is also a key input to the HDM-4 model used to estimate reductions in transportation costs as a result of investment.
R-11
Road traffic fatalities
October 2020
Change Description:
Clarification
Justification:
Clarified this indicator applies to all types of relevant MCC transportation investments
R-19
Trip purpose – business
October 2020
Change Description:
Addition
Justification:
This indicator is helpful for understanding the value of time saved because of the investment. It is used in the HDM-4 model of reductions in transportation costs and also can inform theories of change regarding how the transportation cost reductions might lead to reduced poverty through economic growth.
R-20
Trip purpose - Leisure
October 2020
Change Description:
Addition
Justification:
This indicator is helpful for understanding the value of time saved because of the investment. It is used in the HDM-4 model of reductions in transportation costs and also can inform theories of change regarding how the transportation cost reductions might lead to reduced poverty through economic growth.
R-21
Cargo weight
October 2020
Change Description:
Addition
Justification:
Cargo weight is an indicator that is necessary to model in HDM-4 the reductions to transportation costs that result from the investment.
R-22
Cargo value
October 2020
Change Description:
Cargo volume
Justification:
Cargo weight is an indicator that is necessary to model in HDM-4 the reductions to transportation costs that result from the investment.
R-23
Cost of transportation
October 2020
Change Description:
Addition
Justification:
This is a key indicator for most transportation investments, as shown in the program logic.
R-24
Average vehicle weights
October 2020
Change Description:
Addition
Justification:
This indicator provides necessary context to the disaggregation required in R-23. Different countries may have different standard weights for different vehicle classes, and this is important to take into account when comparing across countries.
R-25
Transport fares
October 2020
Change Description:
Addition
Justification:
This indicator allows one to understand the extent to which reductions in transportation costs are passed on to road users themselves.
R-26
People trained in network prioritization
October 2020
Change Description:
Addition
Justification:
This is a common output in MCC’s investments in maintenance capacity building.
R-27
Evidence-based maintenance planning
October 2020
Change Description:
Addition
Justification:
This is a common outcome in MCC’s investments in maintenance capacity building.
R-28
Evidence-based maintenance execution
October 2020
Change Description:
Addition
Justification:
This is a common outcome in MCC’s investments in maintenance capacity building.
R-29
Percentage of annual maintenance budget allocated
October 2020
Change Description:
Addition
Justification:
This indicator is used to understand whether or not the required maintenance is taking place, and if not, whether budgetary issues are a root cause, as is often the case.
R-30
Percentage of annual maintenance budget spent
October 2020
Change Description:
Addition
Justification:
This indicator is used to understand whether or not the required maintenance is taking place, and if not, whether budgetary issues are a root cause, as is often the case.
R-31
Road network roughness
October 2020
Change Description:
Addition
Justification:
This is an outcome indicator that is useful when investments target the road maintenance system in the entire country.
R-32
Transportation cost savings
October 2020
Change Description:
Addition
Justification:
This indicator is a measure of the total impact of the MCC investment on transportation costs. It will also be useful to use to compare across countries.
R-33
Percentage overloading
October 2020
Change Description:
Addition
Justification:
This indicator is an input to HDM-4 to model reductions in transportation cost as a result of the investment. If many trucks are overloaded, the road will deteriorate faster, and fewer reductions in transportation costs for road users will be achieved.
Water Supply, Sanitation and Hygiene
Water Supply, Sanitation and Hygiene Common Indicator Inputs and Disaggregations
March 2020
Change Description:
Codes for Water Supply, Sanitation and Hygiene indicator inputs and disaggregations updated to reflect retired and new indicators
Justification:
The added section assigns codes for Water Supply, Sanitation and Hygiene indicator inputs and disaggregations. These codes are used by MCC’s indicator management system to aggregate values across compacts.
March 2016
Change Description:
Codes for Water Supply, Sanitation and Hygiene indicator inputs and disaggregations added
Justification:
The added section assigns codes for Water Supply, Sanitation and Hygiene indicator inputs and disaggregations. These codes are used by MCC’s indicator management system to aggregate values across compacts.
(WS-1 –
WS-4)
Financial Common Indicators
November 2020
Change Description:
All Financial Common Indicators, including “Value of signed contracts,” “Value disbursed of contracts,” and “Percent disbursed contracts,” removed for feasibility, design, and construction contracts.
Justification:
These indicators were removed due to a determined lack of utility.
WS-2
Percent disbursed of water and sanitation feasibility and design contracts
March 2013
Change Description:
Classification changed from “Cumulative” to “Level”
Justification:
This indicator reports the amount of signed contracts disbursed as a percentage. The amount of contracts signed and the amount of contracts disbursed are both cumulative over the life of the program. Therefore the percent disbursed is cumulative in nature. However, in MCC’s indicator management system, if this indicator is marked as “Cumulative,” the percent disbursed calculated each quarter will be added together with the previous quarter’s percent disbursed thereby double-counting. Even though this indicator calculates the cumulative amount disbursed compared to the cumulative amount signed, it must be marked as “Level” for MCC’s MIS to display the correct value.
(WS-4)
Percent disbursed of water and sanitation construction contracts
March 2013
Change Description:
Classification changed from “Cumulative” to “Level”
Justification:
This indicator reports the amount of signed contracts disbursed as a percentage. The amount of contracts signed and the amount of contracts disbursed are both cumulative over the life of the program. Therefore the percent disbursed is cumulative in nature. However, in MCC’s indicator management system, if this indicator is marked as “Cumulative,” the percent disbursed calculated each quarter will be added together with the previous quarter’s percent disbursed thereby double-counting. Even though this indicator calculates the cumulative amount disbursed compared to the cumulative amount signed, it must be marked as “Level” for MCC’s MIS to display the correct value.
WS-6
People trained in hygiene and sanitary best practices
March 2020
Change Description:
Name, definition and guidance change.
Justification:
Name change to: Individuals trained in social and behavior change.
Definition and guidance change to make it broader.
WS-7
Water points constructed
March 2020
Change Description:
Guidance change, disaggregations removed.
Justification:
Guidance change.
Urban and rural disaggregations redundant because of organization of the common indicators by networked (typically urban) and non-networked (typically rural or peri-urban) systems
WS-8
Non-revenue water
March 2020
Change Description:
Name change, guidance change
Justification:
Name changed to: Proportion of non-revenue water.
Guidance change to IBNET indicator 6.1 to better align with water sector industry practices. Added supplied volume disaggregation to combat data quality issues.
WS-9
Continuity of service
March 2020
Change Description:
Guidance change, disaggregation change
Justification:
Guidance change to IBNET indicator 15.1 to better align with water sector industry practices.
Disaggregation change to: Breakdown of residential areas by neighborhood or DMA as relevant. Making indicator more relevant. Industrial disaggregation removed. Residential should be disaggregated by relevant project geographical areas. That is more important than the industrial disaggregation because industry often has a direct/ dedicated line or special agreements.
WS-10
Operating cost coverage
March 2020
Change Description:
Name change, guidance change
Justification:
Name changed to: Proportion of operating costs covered by revenue.
Guidance change to IBNET indicator 24.1 to better align with water sector industry practices
WS-11
Volume of water produced
March 2020
Change Description:
Name and definition change
Justification:
Name change to: Supplied water volume.
Definition change: The volume of water supplied to the entire distribution system, which equals the total volume of water produced by the utility for a referenced time period.
WS-12
Access to improved water supply
March 2020
Change Description:
Definition, guidance and name change to SDG 6.1.1: “Use of safely managed drinking water sources”
Remove disaggregations – rural/urban
Justification:
Definition, guidance and name change to SDG 6.1.1: “Use of safely managed drinking water sources” to better align with water sector industry practices
Remove disaggregations – rural/urban
WS-13
Access to improved sanitation
March 2020
Change Description:
Name, definition and guidance change.
Justification:
Definition, guidance and name change to SDG 6.2.1: “Use of safely managed sanitation and a hand-washing facility” to better align with water sector industry practices
WS-14
Residential water consumption
March 2020
Change Description:
Removed disaggregations.
Justification:
Updated guidance based on experience in previous compacts.
Removed Rural/Urban Disaggregation. Updated to reflect the change in disaggregation by consumer profile.
WS-15
Industrial/Commercial water consumption
March 2020
Change Description:
Guidance and disaggregation change.
Justification:
Guidance and disaggregation change.
Disaggregation change to suggestion based on size of commercial consumption. Guidance added to align with IBNET indicators.
WS-16
Prevalence of diarrhea
March 2016
Change Description:
WS-16 was revised from “Incidence of diarrhea” to “Prevalence of diarrhea”
Justification:
The name of this indicator was revised to more accurately match the indicator definition.
WS-17
Length of drainage canals constructed or rehabilitated
March 2020
Change Description:
Indicator added
Justification:
Indicator added to include relevant MCC investments in drainage systems. Previously, no such common indicators existed.
WS-18
Proportion of billing collected
March 2020
Change Description:
Indicator added
Justification:
Indicator added to include relevant MCC investments. This indicator helps benchmark a water utility’s financial sustainability. MCC investments often are concerned with outcomes related to a utility’s financial sustainability and this indicator provides information toward assessing that outcome.
WS-19
Utility staff per 1000 connections
March 2020
Change Description:
Indicator added
Justification:
Indicator added to include relevant MCC investments. This indicator that helps benchmark a water utility’s financial sustainability. MCC investments often are concerned with outcomes related to a utility’s financial sustainability and this indicator provides information toward assessing that outcome.
WS-20
Customer complaints ratio
March 2020
Change Description:
Indicator added
Justification:
Indicator added to include relevant MCC investments. This indicator that helps benchmark a water utility’s service provision effectiveness. MCC investments often are concerned with outcomes related to a utility’s financial sustainability and this indicator provides information toward assessing that outcome.
WS-21
Proportion of tests passing drinking water quality criteria
March 2020
Change Description:
Indicator added
Justification:
Indicator added to include relevant MCC investments. This indicator that helps benchmark a water utility’s service provision effectiveness. MCC investments often are concerned with outcomes related to a utility’s financial sustainability and this indicator provides information toward assessing that outcome.
WS-22
Proportion of wastewater treated
March 2020
Change Description:
Indicator added
Justification:
Indicator added to include relevant MCC investments. This indicator that helps benchmark a water utility’s service provision coverage and beneficiaries’ access to those services. MCC investments often are concerned with outcomes related to a utility’s financial sustainability and this indicator provides information toward assessing that outcome.
WS-23
Water service coverage
March 2020
Change Description:
Indicator added
Justification:
Indicator added to include relevant MCC investments. This indicator that helps benchmark a water utility’s service provision coverage and beneficiaries’ access to those services. MCC investments often are concerned with outcomes related to a utility’s financial sustainability and this indicator provides information toward assessing that outcome.
WS-24
Sewerage service coverage
March 2020
Change Description:
Indicator added
Justification:
Indicator added to include relevant MCC investments. This indicator that helps benchmark a water utility’s service provision coverage and beneficiaries’ access to those services. MCC investments often are concerned with outcomes related to a utility’s financial sustainability and this indicator provides information toward assessing that outcome.
WS-25
Total customer connections
March 2020
Change Description:
Indicator added
Justification:
Indicator added to include relevant MCC investments. This indicator that helps benchmark a water utility’s service provision coverage and beneficiaries’ access to those services. MCC investments often are concerned with outcomes related to a utility’s financial sustainability and this indicator provides information toward assessing that outcome.
WS-26
Sanitation facilities constructed
March 2020
Change Description:
Indicator added
Justification:
Indicator added to include relevant MCC investments at the output level for broader Agency level reporting in WASH.
WS-27
Length of water pipelines constructed, replaced or rehabilitated
March 2020
Change Description:
Indicator added
Justification:
Indicator added to include relevant MCC investments at the output level for broader Agency level reporting in WASH.
WS-28
Length of sewers constructed or replaced
March 2020
Change Description:
Indicator added
Justification:
Indicator added to include relevant MCC investments at the output level for broader Agency level reporting in WASH.
WS-29
Reservoirs or pumping stations constructed or rehabilitated
March 2020
Change Description:
Indicator added
Justification:
Indicator added to include relevant MCC investments at the output level for broader Agency level reporting in WASH.
WS-30
Customer water meters installed or replaced
March 2020
Change Description:
Indicator added
Justification:
Indicator added to include relevant MCC investments at the output level for broader Agency level reporting in WASH.
WS-31
Water supply kiosks built
March 2020
Change Description:
Indicator added
Justification:
Indicator added to include relevant MCC investments at the output level for broader Agency level reporting in WASH.
WS-32
Treatment process units within centralized water or wastewater treatment facilities constructed, rehabilitated or expanded
March 2020
Change Description:
Indicator added
Justification:
Indicator added to include relevant MCC investments at the output level for broader Agency level reporting in WASH.
WS-33
Water production capacity added
March 2020
Change Description:
Indicator added
Justification:
Indicator added to include relevant MCC investments at the output level for broader Agency level reporting in WASH.
WS-34
Time Spent Collecting Water
March 2020
Change Description:
Indicator added
Justification:
Indicator added to standardize the measurement of a frequently-targeted result of MCC investments.
WS-35
Affordability of Service
March 2020
Change Description:
Indicator added
Justification:
Indicator added to standardize the measurement of a factor in a household’s ability to consume water, which is relevant to understanding the impact of MCC investments in water supply.
WS-36
Water Production Available per Customer Connection
March 2020
Change Description:
Indicator added
Justification:
Indicator added to standardize the measurement of and provide insight into the average volume of water that will be available to individual connections; it is also useful to estimate whether existing water production will be able to support expansion of service.
Water Supply, Sanitation and Hygiene Common Indicator Inputs and Disaggregations
March 2020
Change Description:
Codes for Water Supply, Sanitation and Hygiene indicator inputs and disaggregations updated to reflect retired and new indicators
Justification:
The added section assigns codes for Water Supply, Sanitation and Hygiene indicator inputs and disaggregations. These codes are used by MCC’s indicator management system to aggregate values across compacts.
March 2016
Change Description:
Codes for Water Supply, Sanitation and Hygiene indicator inputs and disaggregations added
Justification:
The added section assigns codes for Water Supply, Sanitation and Hygiene indicator inputs and disaggregations. These codes are used by MCC’s indicator management system to aggregate values across compacts.
Education
Education Common Indicator Inputs and Disaggregations
March 2016
Change Description:
Codes for Education indicator inputs and disaggregations added
Justification:
The added section assigns codes for Education indicator inputs and disaggregations. These codes are used by MCC’s indicator management system to aggregate values across compacts.
(E-1 – E-4)
Financial Common Indicators
November 2020
Change Description:
All Financial Common Indicators, including “Value of signed contracts,” “Value disbursed of contracts,” and “Percent disbursed contracts,” removed for feasibility, design, and construction contracts.
Justification:
These indicators were removed due to a determined lack of utility.
(E-2)
Percent disbursed of educational facility construction, rehabilitation, and equipping contracts
March 2013
Change Description:
Classification changed from “Cumulative” to “Level”
Justification:
This indicator reports the amount of signed contracts disbursed as a percentage. The amount of contracts signed and the amount of contracts disbursed are both cumulative over the life of the program. Therefore the percent disbursed is cumulative in nature. However, in MCC’s indicator management system, if this indicator is marked as “Cumulative,” the percent disbursed calculated each quarter will be added together with the previous quarter’s percent disbursed thereby double-counting. Even though this indicator calculates the cumulative amount disbursed compared to the cumulative amount signed, it must be marked as “Level” for MCC’s MIS to display the correct value.
Power
Power Common Indicators
March 2016
Change Description:
Common Indicators for Power sector compacts added
Justification:
The added section provides definitions and guidance for indicators that are applicable to various types of power projects funded by MCC. In addition, a list of reference indicators are provided that do not meet criteria for a common indicator, but may be useful and relevant measures for power sector compacts to monitor. The new section includes indicator inputs and disaggregations for Power indicators.
(P-1 – P-4)
Financial Common Indicators
November 2020
Change Description:
All Financial Common Indicators, including “Value of signed contracts,” “Value disbursed of contracts,” and “Percent disbursed contracts,” removed for feasibility, design, and construction contracts.
Justification:
These indicators were removed due to a determined lack of utility.