An official website of the United States government
Here’s how you know
Official websites use .gov A
.gov website belongs to an official government
organization in the United States.
Secure .gov websites use HTTPS A
lock (
) or https:// means you’ve safely connected to
the .gov website. Share sensitive information only on official,
secure websites.
Compact Signing Amounts and Key Dates (in millions of $)*
Partner Country
Compact Amount
Signing
Entry Into Force
Closed Dates
Madagascar
109.8
4/18/2005
7/27/2005
8/31/2009
Honduras
215.0
6/14/2005
9/30/2005
9/30/2010
Cabo Verde
110.1
7/5/2005
10/18/2005
10/17/2010
Nicaragua
175.0
7/15/2005
5/26/2006
5/26/2011
Georgia
395.3
9/12/2005
4/7/2006
4/7/2011
Benin
307.3
2/22/2006
10/6/2006
10/6/2011
Vanuatu
65.7
3/2/2006
4/28/2006
4/28/2011
Armenia
235.7
3/27/2006
9/29/2006
9/29/2011
Ghana
547.0
8/1/2006
2/16/2007
2/16/2012
Mali
460.8
11/13/2006
9/18/2007
8/24/2012
El Salvador
460.9
11/29/2006
9/20/2007
9/20/2012
Mozambique
506.9
7/13/2007
9/22/2008
9/22/2013
Lesotho
362.6
7/23/2007
9/17/2008
9/17/2013
Morocco
697.5
8/31/2007
9/15/2008
9/15/2013
Mongolia
284.9
10/22/2007
9/17/2008
9/17/2013
Tanzania
698.1
2/17/2008
9/17/2008
9/17/2013
Burkina Faso
480.9
7/14/2008
7/31/2009
7/31/2014
Namibia
304.5
7/28/2008
9/16/2009
9/16/2014
Senegal
540.0
9/16/2009
9/23/2010
9/23/2015
Moldova
262.0
1/22/2010
9/1/2010
9/1/2015
Philippines
433.9
9/23/2010
05/25/11
5/25/2016
Jordan
275.1
10/25/2010
12/13/11
12/13/2016
Malawi
350.7
4/7/2011
9/20/2013
Indonesia
600.0
11/19/2011
4/2/2013
Cabo Verde, 2012
66.2
2/10/2012
11/30/2012
11/30/2017
Zambia
354.8
5/10/2012
11/15/2013
Georgia, 2013
140.0
7/26/2013
7/1/2014
Ghana, 2014
498.2
8/5/2014
9/6/2016
El Salvador, 2014
277.0
9/30/2014
9/9/2015
Benin, 2015
375.0
9/9/2015
6/22/2017
Liberia
256.7
10/2/2015
1/20/2016
Morocco, 2015
450.0
11/30/2015
6/30/2017
Niger
437.0
7/29/2016
Nepal
500.0
9/14/2017
Côte d'Ivoire
524.7
11/7/2017
* Please note that the values above are the signed compact amounts and do not reflect lower actual expenditures due to early terminations or funds for a compact not being fully spent. The table on the next page reflects the net obligations/commitments associated with each compact.
Compact Obligations and Commitments
Country/Description
2012 & Prior
2013
2014
2015
2016
2017
2018
2019
Total
Closed Compacts
$7,402.6
-
-
-
-
-
-
-
$7,402.6
Cabo Verde
66.2
-
-
-
-
-
-
-
66.2
El Salvador
117.0
160.0
-
-
-
-
-
-
277.0
Georgia
140.0
-
-
-
-
-
-
-
140.0
Ghana
17.0
283.0
198.2
-
-
-
-
498.2
Indonesia
600.0
-
-
-
-
-
-
-
600.0
Liberia
-
-
-
256.7
-
-
-
-
256.7
Malawi
350.7
-
-
-
-
-
-
-
350.7
Niger
58.0
-
-
-
379.0
-
-
-
437.0
Zambia
354.8
-
-
-
-
-
-
-
354.8
Benin
-
207.0
-
168.0
-
-
-
-
375.0
Morocco
114.1
1.2
168.7
166.0
-
-
-
-
450.0
Nepal
108.0
10.0
-
69.0
107.0
206.0
-
-
500.0
Côte d’Ivoire
40.5
9.0
272.0
10.0
26.2
167.0
-
-
524.7
Active Compacts
$1,966.3
$670.2
$638.9
$669.7
$512.3
$373.0
-
-
$4,830.3
Mongolia
99.9
-
-
8.3
143.1
98.7
-
-
350.0
Senegal
81.6
-
44.4
3.4
18.7
180.4
178.0
-
506.5
Burkina Faso
-
-
-
-
-
-
4.0
300.0
304.0
Sri Lanka
-
-
-
-
-
-
343.0
107.0
450.0
Tunisia
-
-
-
-
-
-
142.0
150.5
292.5
Lesotho
-
-
-
-
-
-
-
-
-
Sri Lanka
-
-
-
-
-
-
-
-
-
Compacts in Development
$181.5
-
$44.4
$11.7
$161.8
$279.1
$667.0
$557.5
$1,903.0
TOTAL
$9,550.4
$670.2
$683.3
$681.4
$674.1
$652.1
$667.0
$557.5
$14,135.9
Threshold Program Agreements Signing Amounts (in millions of $)
Country
Sub-Saharan Africa
Eurasia
Latin America
Middle East and North Africa
Signing Date
Completion Date
Burkina Faso
12.9
7/22/2005
9/30/2008
Malawi
20.9
9/23/2005
9/30/2008
Albania, 2006
13.9
4/3/2006
11/15/2008
Tanzania
11.2
5/3/2006
12/30/2008
Paraguay, 2006
34.6
5/8/2006
8/31/2009
Zambia
22.7
5/22/2006
2/28/2009
Philippines
20.7
7/26/2006
5/29/2009
Jordan
25.0
10/17/2006
8/29/2009
Indonesia
55.0
11/17/2006
12/31/2010
Ukraine
44.5
12/4/2006
12/31/2009
Moldova
24.7
12/14/2006
2/28/2010
Kenya
12.7
3/23/2007
12/31/2010
Uganda
10.4
3/29/2007
12/31/2009
Guyana
6.7
8/23/2007
2/23/2010
São Tomé & Principe
8.7
11/9/2007
4/15/2011
Kyrgyz Republic
16.0
3/14/2008
6/30/2010
Niger
23.1
3/17/2008
12/31/2015
Peru
35.6
6/9/2008
9/30/2012
Rwanda
24.7
9/24/2008
12/31/2011
Albania, 2008
15.7
9/29/2008
7/31/2011
Paraguay, 2009
30.3
4/13/2009
7/31/2012
Liberia
15.1
7/6/2010
12/1/2013
Timor-Leste
10.5
9/22/2010
3/31/2014
Honduras
15.6
8/29/2013
In progress
Guatemala
28.0
4/8/2015
In progress
Sierra Leone
44.4
11/17/2015
In progress
Kosovo
49.0
9/12/2017
In progress
Results of Recently Closed Compacts
Cabo Verde II
Policy Refoms
Environmental requirements, including an improved regime for the disposal of sludge according to international standards. The Ministry of Water and Irrigation will soon float a tender for the construction of the first mono landfill for the disposal of sludge and bio solids and for electricity generation.
Outputs
Land Management for Investment Project
11,418 households, commercial and other legal entities received formal recognition of ownership and/or use rights.
28,985 parcels were corrected or incorporated into an official land information system.
100% of targeted surfaced area on Sal Island has been incorporated into the Land Management Information and Transaction System (LMITS).
38 land administration offices were established or upgraded.
Water, Sanitation and Hygiene Project
In partnership with the Coca-Cola Africa Foundation, the Social Access Fund increased access to water and sanitation with over 3,500 households receiving subsidized water connections and more than 2,200 households benefiting from new sanitation facilities.
Construction of over 200 km of water pipeline and over 20 km of sanitation pipeline.
More than 60 reservoirs and pumping stations constructed or rehabilitated.
Preliminary and Expected Outcomes[[Cabo Verde II closed in November 2017 and updated beneficiary numbers will be available in February 2018. As a result, information on beneficiaries is not included in this document.]]
The infrastructure improvements of the Water and Sanitation Fund supported utilities to improve or expand or improve their water and sanitation networks.
On Santiago Island, transformation of the water sector, including establishment of a new corporatized, consolidated utility—Aguas de Santiago, with more efficient and effective operations and management— has resulted in more than doubling the number of hours of water service many residents on the island receive per day, which has increased from about 6 hours to over 14 hours per day.
The Compact introduced an infrastructure grant facility to fund infrastructure works in the WASH sector. This innovative funding mechanism has inspired the Government of Cabo Verde to create a revolving fund to continue to fund the sector.
Evaluations
Land Management for Investment Project
An independent evaluator is implementing a mixed methods performance evaluation to assess the impacts of LMI Project on investment in land and property, property values, land tenure security, time to process key land transactions, demand for formal land transactions, and tourism growth, as well as sustainability of the new systems and procedures introduced by the Project.
The evaluation includes three complementary components: a trend analysis examining changes in key outcomes over time using secondary data, a qualitative study collecting two rounds of in-depth interviews and focus groups with households and businesses to help interpret the findings from the trend analysis, and a multisite case study of large tourism related commercial investments to capture planned and actual investments in tourism development zones (known as Zonas de Desenvolvimento Turístico Integral, or ZDTIs) to understand how the project affected these investments.
Given the concerns around women’s land rights, the evaluation will also include an analysis of how women’s land rights were captured in the clarification of rights and boundaries process and whether women and men benefit differently.
In support of the monitoring and evaluation, LMI stakeholders are collecting detailed land administrative data across multiple land and investment offices regarding key land transactions (sales, greenfield investments, mortgages and building permits) to better understand how the new Land Management and Information Transaction System (LMITs) and related clarification of rights and boundaries affects time to process a land transaction, demand for land services and related land markets.
The evaluation is anticipated to be completed in 2020 after a 3-year exposure period, with a final report in 2021.
Water, Sanitation and Hygiene Project
MCC has contracted an independent evaluator to (1) document how the project activities were implemented along with key outcomes of those activities; (2) track changes in outcomes among households who received subsidized connections to the water network on Santiago through the Social Access Funds; (3) assess utility-level outcomes that are expected to be affected by the WASH project activities; and (4) evaluate how FASA funding might have incentivized utilities to corporatize, how households and utilities are affected by the infrastructure, and consider the prospects for the infrastructure to be sustainably managed. The evaluation is scheduled to complete an interim report in fall 2018 and a final report to be submitted in 2022.
Compact Modifications
MCC employs a risk-based approach to the management of its portfolio and uses a number of mechanisms to manage projects that face potential major modifications, including the following:
Quarterly portfolio reviews of all compacts, with a focus on high-risk projects and activities;
Early identification of high-risk projects;
Close collaboration with partner countries to develop plans to prevent, mitigate and manage project restructuring; and
Approval of modifications at the appropriate level.
MCC also conducts due diligence on programs in advance of compact signing to increase the reliability of technical, cost, and other estimates. During compact development, MCC makes project design modifications to mitigate potential completion risk, currency fluctuations and the potential for construction cost ovERRuns.
Summary of Restructurings and Reallocations in FY 2016
Project/Activity
Programmatic Change
Description
Indonesia
Green Prosperity Project / Green Prosperity Facility Activity ($242 million)
Reallocation of $12 million of funding from the Green Prosperity Facility to Technical Assistance and Oversight
During finalization of the Green Prosperity (GP) Facility portfolio in mid-2016, MCA-Indonesia identified budget shortfalls for technical assistance and oversight. The funds are needed for program administration, oversight, and identification of new initiatives to mitigate implementation risks and improve project sustainability. Such support will help improve the chances of successful implementation of the project grants, and aid in the delivery of GP grant outputs.
Indonesia (Cont.)
Procurement Modernization Project
Reallocation of $7.7 million from the Program Administration and Control Activity to the Procurement Modernization Project's Procurement Professionalization Activity
The reallocation of funds was designed to help ensure project sustainability by including additional workshops, which would help expand socialization of key concepts, develop a competency-based professional certification program, and improve project investments under implementation. Moreover, MCA-Indonesia's assessment showed that logistics costs for the project exceeded estimates, and additional support was needed to continue human resources development training with the projected beneficiaries to ensure program sustainability.
Indonesia (Cont.)
Procurement Modernization Project
Reallocation of $2.2 million from the Program Administration and Control Activity to the Procurement Modernization Project's Policy and Procedure Development Activity
The objectives of the Public Private Partnership (PPP) Sub-Activity are to develop Policies and Procedures on PPP Procurement, and Bidding Documents to facilitate the implementation of PPP procurement across a diverse set of economic and social sectors. Piloting of these projects requires identification and close cooperation between MCA-Indonesia and the Government of Indonesia as well as the selected PPP proponents. After evaluating the quality of existing pre-feasibility studies for the selected pilots, it became clear that the additional funds are needed to refine the existing studies in order for the PPP Sub-Activity to advance with the bidding documentation and the actual piloting of the new procurement policies and procedures.
Ghana
Northern Electric Distribution Company (NEDCO) Financial and Operational Turnaround Project
Approval by MCC management of a redesigned NEDCO Financial and Operational Turnaround Project in the amount of $54.2 million
MCA-Ghana worked with MCC's Ghana country team to redesign the NEDCO project. The redesign, which was completed at the end of 2016, resulted in several material changes to the following activities: the Private Sector Participation Activity, the Modernizing Utility Operations Activity, the Tamale Service Area Improvement Activity, and the Commercial Development Activity. The redesigned project passes the 10 percent economic rate of return hurdle and was approved by MCC senior management in January 2017.
Zambia
Infrastructure Activity
Additional $22 million to be provided by the Government of the Republic of Zambia to support the completion of the Infrastructure Activity as originally planned
During program implementation, it became clear that the cost to complete the Infrastructure Activity had increased due to unforeseen circumstances, including: Massive underground rock formations not detected during preparatory works; Change in the number of “Project Affected Persons” (persons losing assets because of the project who must compensated) and increased in-kind replacement of structures built in project corridors leading to increased resettlement costs; Underground utility relocations that had not been geo-referenced by utility companies that must be moved during construction works at a cost; Alignment of the detailed designs to adjust to changed circumstances in order to avoid high value impacts, and Increased costs associated with construction of the Bombay Drain. To mitigate this risk, the Zambians committed to contribute $22 million in 2017.
Estimating Compact Beneficiaries and Benefits
Under MCC's results framework, beneficiaries are defined as an individual and all members of his or her household who will experience an income gain as a result of MCC interventions. We consider that the entire household will benefit from the income gain and counts are multiplied by the average household size in the area or country. The beneficiary standard makes a distinction between individuals participating in a project and individuals expected to increase their income as a result of the project. Before signing a compact, MCC estimates the expected long-term income gains through a rigorous benefit-cost analysis. MCC may reassess and modify its beneficiary estimates and the present value of benefits when project designs change during implementation.
Compact[[The table includes estimates for compacts that have ERRs from which income benefit calculations can be drawn. Information for Indonesia is only available for one out of three projects at this time.]][[These estimates do not include the projected beneficiaries of projects or activities that have been terminated or suspended by MCC (Madagascar, Honduras, Nicaragua, Mali, and Armenia). In the case of Madagascar, the estimates account for the compact's early termination.]]
Estimated Number of Beneficiaries
Estimated Long Term Income Gain Over the Life of the Project (PV of Benefits)[[The Present Value (PV) of Benefits is the sum of all projected benefits accruing over the life of the project, typically 20 years, evaluated at a 10% discount rate. Estimates are reported in millions of US$ in the year that the ERR analysis was completed. Because the PV of benefits uses a discount rate, these figures cannot be compared directly to the undiscounted financial costs of MCC compacts, but must be compared to the PV of costs instead.]]
Armenia
428,000
$295,500,000
Benin
14,059,000
$409,600,000
Benin II
9,926,000
$320,500,000
Burkina Faso
1,181,000
$151,000,000
Cape Verde I
385,000
$149,300,000
Cape Verde II
604,000
$112,900,000
El Salvador
706,000
$377,800,000
El Salvador II
6,446,000
$224,500,000
Georgia
143,000
$301,300,000
Georgia II
1,770,000
$338,000,000
Ghana
1,217,000
$733,100,000
Honduras
1,705,000
$237,300,000
Indonesia[[The table includes estimates for compacts that have ERRs from which income benefit calculations can be drawn. Information for Indonesia is only available for one out of three projects at this time.]]
1,700,000
$217,000,000
Jordan
3,000,000
$398,900,000
Lesotho
1,041,000
$485,000,000
Liberia
564,000
$353,900,000
Madagascar
480,000
$123,200,000
Malawi
983,000
$567,200,000
Mali
2,837,000
$393,600,000
Moldova
414,000
$206,100,000
Mongolia
2,058,000
$314,800,000
Morocco
1,695,000
$805,400,000
Mozambique
2,685,000
$288,900,000
Namibia
1,063,000
$310,400,000
Nicaragua
119,000
$83,500,000
Philippines
125,822,000
$464,400,000
Senegal
1,550,000
$625,000,000
Tanzania
5,425,000
$1,474,000,000
Vanuatu
39,000
$73,800,000
Zambia
1,200,000
$306,600,000
Total for All Compacts[[Column totals may not equal the sum of the individual rows due to rounding.]]
191,244,000
$11,142,500,000
Post Compact Economic Rates of Return
All MCC projects are independently evaluated, and these independent evaluations often include post compact ERRs. Independently calculated ERRs complement the closeout ERRs that MCC calculates at the end of the compact. Because independent evaluations occur 2-5 years after compact closure, independently calculated ERRs can offer an updated assessment of a project’s costs and benefits post-compact. However, these ERRs are still projections for projects whose benefits are often projected to last up to 20 years. Nonetheless, the independently produced post compact ERRs, which are based upon the best available evidence, complete the accountability loop in a way that is rare among donors. Two examples are below.
Results of the Mozambique Farmer Income Support Project
MCC’s Farmer Income Support Project (FISP) was designed to reduce the damage to the incomes of 1.7 million Mozambican farmers due to Coconut Lethal Yellowing Disease (CLYD). This was to be accomplished through (i) short term surveillance, control, and mitigation services, prompt eradication of diseased palms, and replanting with the less susceptible Mozambican Green Tall coconut variety, and (ii) Technical advisory services to introduce crop-diversification options. Given projected benefits to farmers’ incomes and the costs of the program, MCC originally projected the project to have an economic rate of return of 25.1 percent.
An independent evaluation of the FISP project’s impacts found that cutting trees and burning tree stumps in epidemic areas did reduce CLYD prevalence, but not to the degree originally forecast, resulting in lower than expected productivity impacts. Likewise, endemic area alternative crop uptake was lower than expected, likely due to insufficient input and output market linkages. The resulting updated, ex-post ERR estimate was 16.8 percent. Greater detail on the evaluation and lessons learned are available in MCC’s public evaluation catalogue.[[https://data.MCC.gov/evaluations/index.php/catalog]]
Results of the Nicaragua Transportation Project
MCC’s Nicaragua Transportation Project was designed to stimulate economic development and improve access to markets and social services by reducing transportation costs. It upgraded and rehabilitated 68 km of roads, consisting of two secondary roads and a trunk road. MCC’s originally estimated an economic return from the project of 13.2 percent based on reduced vehicle operating costs and travel time savings for road users, including those who would travel on the road due to improved road conditions resulting from the project.
The independent evaluation of this project estimated actual impacts using data from 2 years after the roads were completed. It found that the road roughness, a key indicator of transport costs, decreased 80 percent on average, and traffic increased 12 percent on average over the 2 years to 3,062 vehicles per day. At the same time, the capital costs for the road works came in on average 2.2 times those estimated prior to implementation. Given this balance of measured benefits and costs, the resulting “ex-post” ERR fell to 2.1 percent, primarily due to these higher costs. (Benefits were roughly consistent with ex-ante estimates.) Greater detail on the evaluation and lessons learned are available in MCC’s public evaluation catalogue,[[https://data.MCC.gov/evaluations/index.php/catalog]] and recently published Principles into Practice: Lessons from MCC’s Investments in Roads.[[https://www.MCC.gov/our-impact/principles-into-practice]]
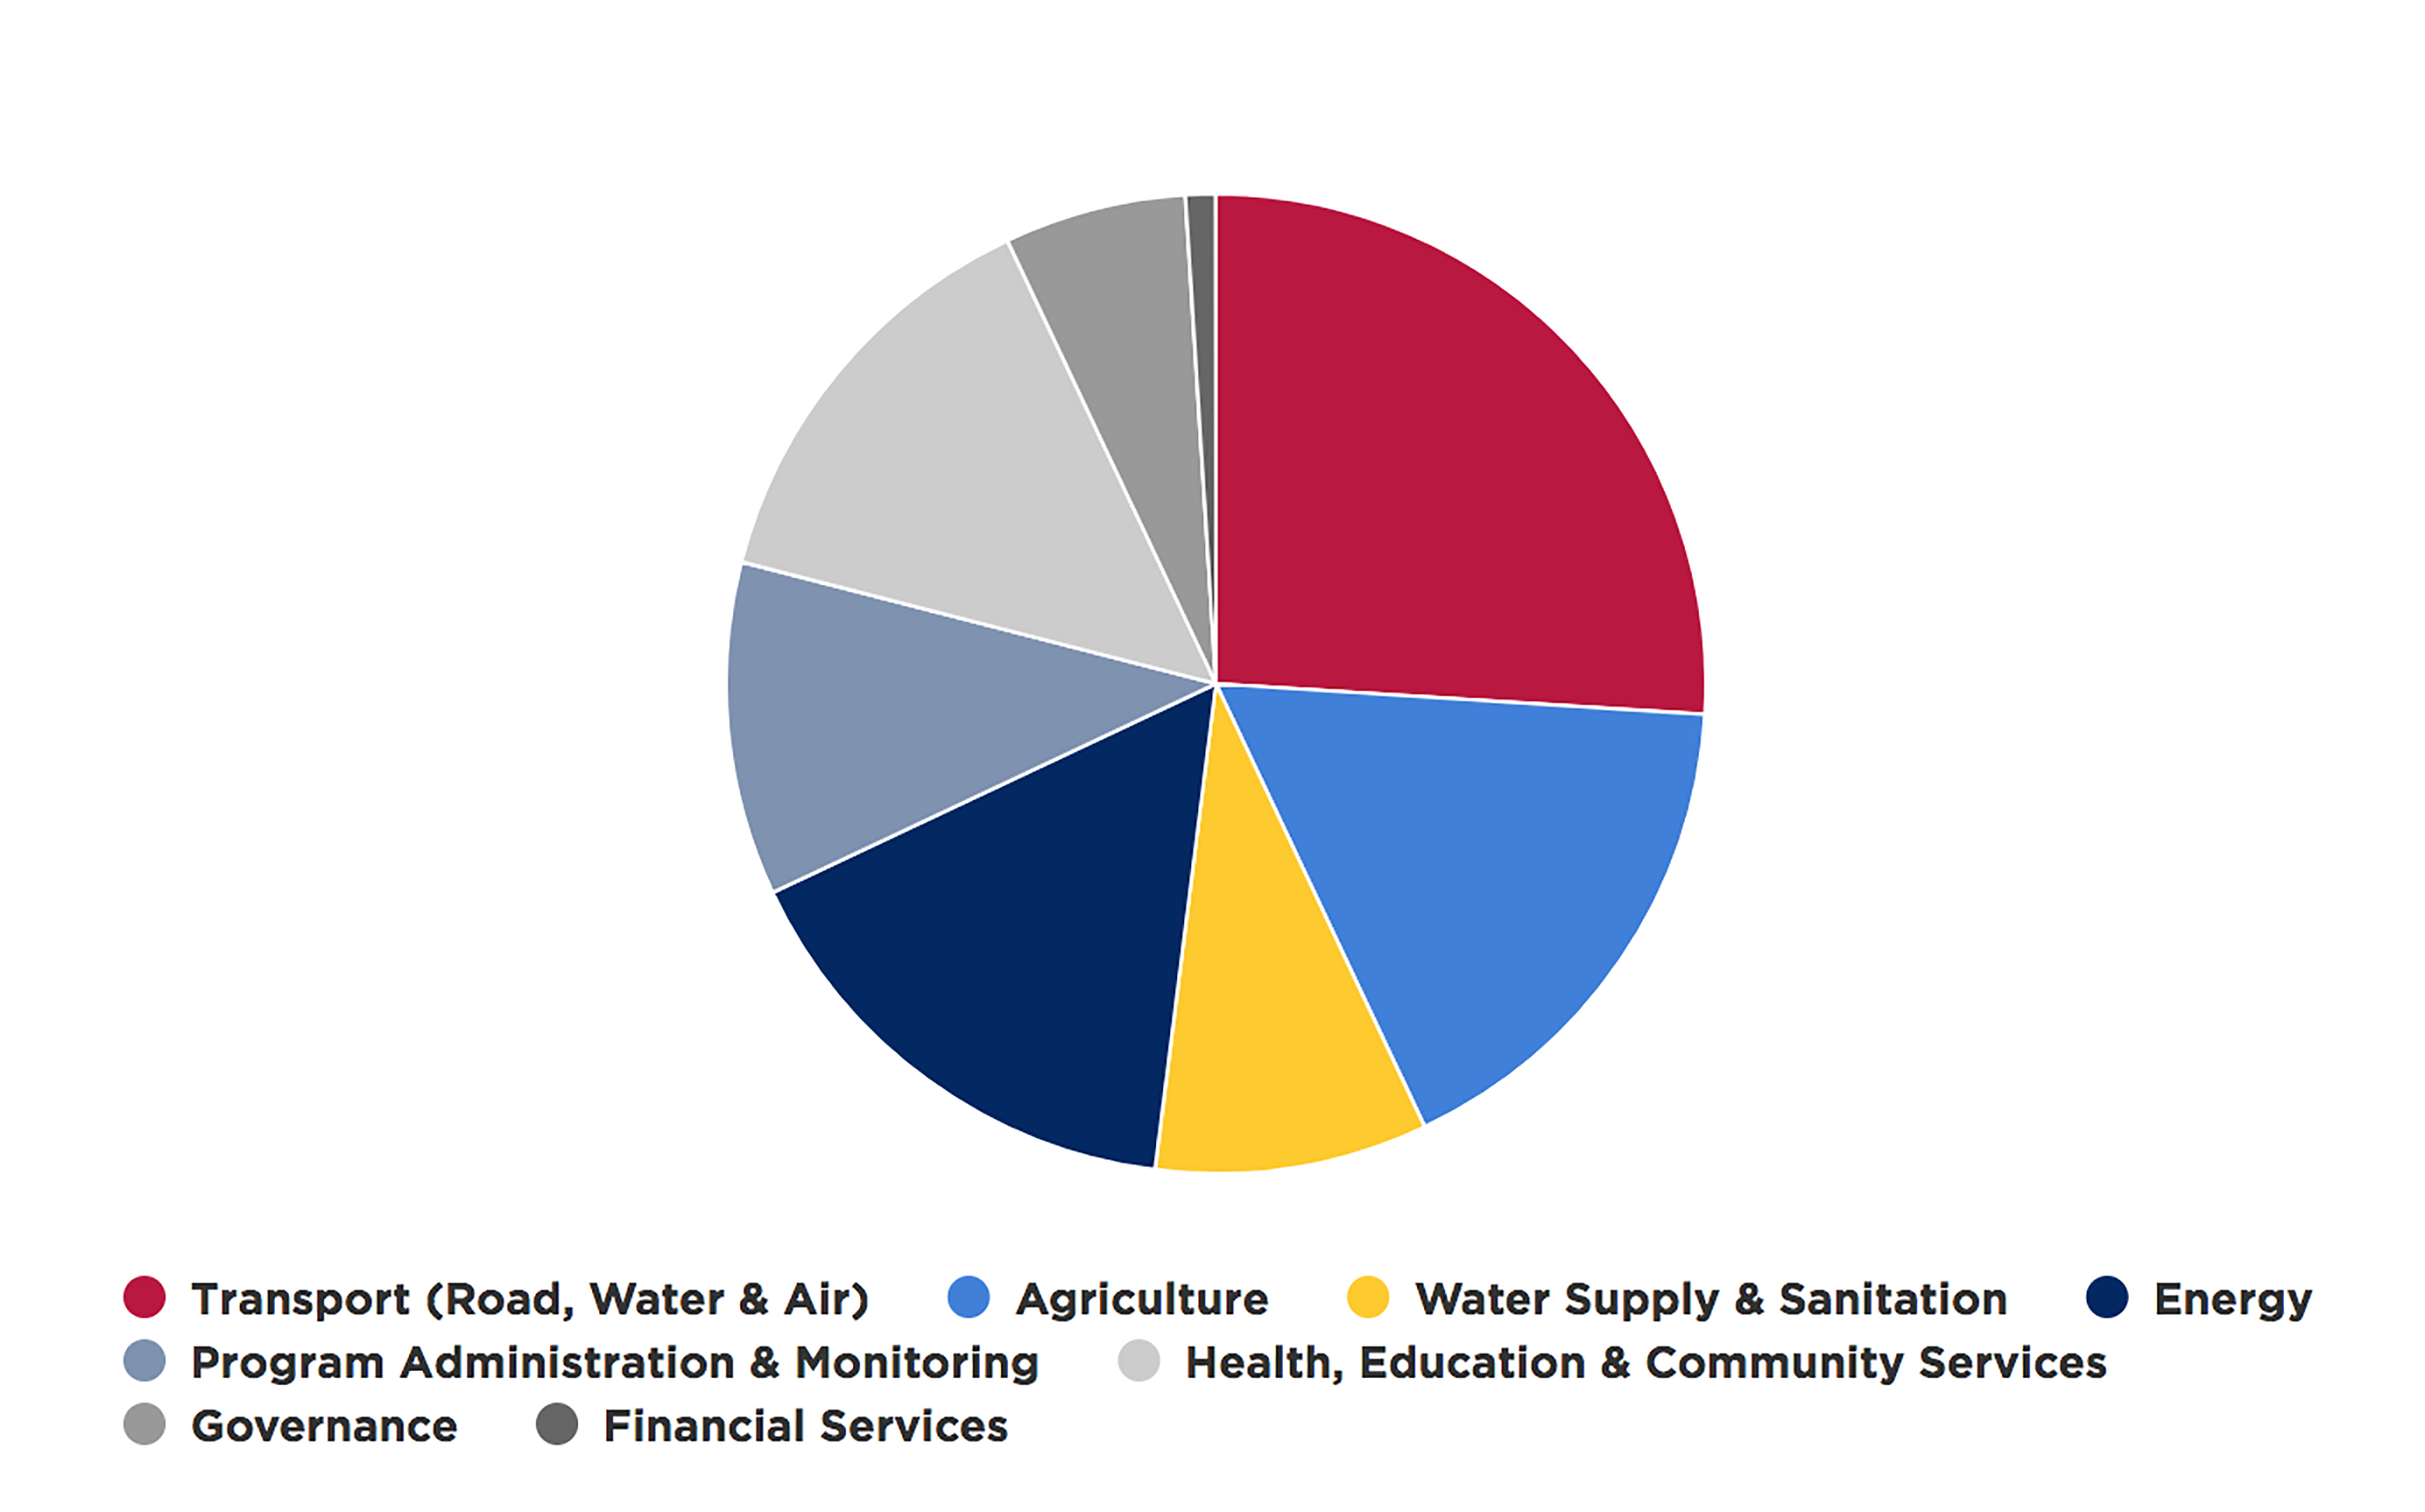
Portfolio by Sector
Investments by Sector
Sector
Amount ($ Millions)
Transportation (Road, Water & Air)
$3,044.4
Agriculture
$1,963.6
Energy
$1,889.3
Health, Education & Community Services
$1,662.8
Program Administration & Monitoring
$1,248.3
Water Supply & Sanitation
$1,088.8
Governance
$649.2
Financial Services
$159.8
Total
$11,706.2
Results by Sector as of FY 2017 Q4
Sector
Indicator
Total Portfolio Actuals (cumulative value 2005-present)
Data Points (number of compacts)
Active and Completed Countries Tracked (underlined indicates still active)
Roads
Temporary employment generated in road construction
49,822
6
Armenia, Burkina Faso, Cabo Verde, El Salvador, El Salvador II, Georgia, Ghana, Honduras, Liberia, Mali, Moldova, Mongolia, Mozambique, Nicaragua, Philippines, Senegal, Tanzania, Vanuatu
Kilometers of roads completed
3,035
15
Agriculture & Irrigation
Farmers trained
330,814
14
Armenia, Burkina Faso, Cabo Verde, El Salvador, Georgia, Ghana, Honduras, Indonesia, Madagascar, Mali, Moldova, Morocco, Mozambique, Namibia, Nicaragua, Senegal
Farmers who have applied improved practices as a result of training
126,592
10
Hectares under improved irrigation
203,963
8
Value of agricultural and rural loans
$87,074,694
9
Water & Sanitation
Temporary employment generated in water and sanitation construction
21,459
6
Cabo Verde II, El Salvador, Georgia, Ghana, Jordan, Lesotho, Mozambique, Tanzania, Zambia
People trained in hygiene and sanitary best practices
12,135
6
Water points constructed
1,181
3
Operating cost coverage
93%
4
Access to improved water supply
63%
3
Education
Students participating
215,607
7
Burkina Faso, El Salvador, El Salvador II, Georgia II, Ghana, Mongolia, Morocco, Namibia
Facilities completed
772
6
Graduates from MCC-supported education activities
62,211
5
Land
Legal and regulatory reforms adopted
127
7
Benin, Burkina Faso, Cabo Verde II, Ghana, Indonesia, Lesotho, Madagascar, Mali, Mongolia, Mozambique, Namibia, Nicaragua, Senegal
Stakeholders trained
76,531
11
Land administration offices established or upgraded
399
8
Parcels corrected or incorporated in land system
338,393
8
Land rights formalized
321,508
7
Power
Kilometers of lines completed
4,318
4
El Salvador, Georgia, Ghana, Ghana II, Indonesia, Liberia, Malawi, Mongolia, Tanzania
Sector Results at a Glance
Numbers are cumulative since the agency’s founding in 2004 and current as of September 2017.
Once a country is selected as eligible to develop a compact or threshold program, the first step in MCC’s process is to work with partner country officials to conduct a rigorous, joint analysis that identifies the most binding constraints to economic growth. These results help prioritize MCC’s investments in the areas that are the biggest impediments to private investment and poverty reduction and may include access to credit, governance, electricity, transportation, or education. Constraints to growth are different for each country and ultimately drive MCC’s investment strategy. Below are highlights of MCC’s sector investments that have emerged from this analysis.
Power
2,683 miles of electricity lines completed
MCC is making major investments in the energy sector to reduce energy poverty in Nepal,Benin, Ghana, Liberia, Malawi and Sierra Leone, while encouraging power sector reforms that complement infrastructure investments. In Liberia, MCC’s compact funds the rehabilitation of a hydropower facility to increase the amount of generated electricity, facilitate lower overall electricity rates, and increase the reliability and adequacy of electricity. In Ghana, the government took significant steps to revitalize its power sector by inviting the private sector to invest in one of its national distribution utility. Implementation of the compact with Benin continues while significant construction works for large-scale, on-grid generation, transmission and distribution projects are underway in Malawi, as well as smaller-scale, on- and off-grid energy projects in Indonesia. In Sierra Leone, MCC began carrying out its threshold program to build the capacity of the newly established power regulator and power generation and transmission utility. In Nepal, preparations are underway for the design of the transmission line funded under the compact. In addition, Kosovo’s threshold program will strengthen the power sector by fostering a market-driven approach to lowering energy costs for households and business, and developing new sources of electricity generation.
Transportation
2,500 miles of road completed
1,000 additional miles of roadway under construction
In May 2016, the Philippines, using MCC compact funding, successfully completed the reconstruction/rehabilitation of 137.9 miles of a road in the Samar and Eastern Samar provinces of the country that will help lower transport costs and travel time and opens up possibilities for new markets. For the Niger Compact, investments were prepared for the upgrading of approximately 198 miles of roads to international standards, and enhancement of both national and regional connectivity. Implementation of technical assistance and policy reform activities that would set Liberia on a long-term path to a sustainable road maintenance were started. In Nepal, a comprehensive technical assistance program targeting capacity building in road maintenance planning and construction has been launched and includes plans to conduct the periodic maintenance of approximately 300km of roads. In Cote D’Ivoire, the design of major rehabilitation and upgrading of four (4) major urban corridors in the metropolitan area of Abidjan has been launched. In El Salvador, the construction tender for a capacity upgrading of the heavily trafficked segment of 18 miles of coastal highway has been completed and construction is scheduled to start in early winter 2018.
Water and Sanitation
12,135 people trained in hygiene and sanitary best practices
1,181 water points constructed
MCC supports capital improvements and policy and institutional reforms to improve the level and quality of water and sanitation services in partner countries. MCC’s five year compact with Jordan, for example, closed in FY 2016 after investing more than $200 million for rehabilitation and construction of water supply and wastewater infrastructure including investment in the As-Samra wastewater treatment plant where treated effluent will be diverted for agricultural use saving precious bulk water supply for this water poor nation. MCC’s compact investment in Zambia is strengthening the main water utility company to improve billings and collections and provide more reliable service to its customers. In Sierra Leone, MCC is partnering with the government on a threshold program to implement policy reforms, build institutional capacity and improve governance in the water sector in Freetown. A comprehensive assessment of the water utility in Guma Valley was conducted to determine the priority areas of assistance for strengthening utility performance but because a cost-benefit analysis is not required for threshold program assistance, the estimated number of beneficiaries above does not include the Sierra Leone beneficiaries.
Agriculture and Irrigation
330,814 farmers trained
504,004 acres (203,963 hectares) under improved irrigation In July 2016, MCC signed a $437 million compact with Niger focused on strengthening the agricultural sector. Through the compact’s Irrigation and the Market Access Project, MCC will work with the Government of Niger to improve irrigation, including the rehabilitation and development of three large-scale irrigation systems in the Dosso and Tahoua regions, to increase crop yields, sustainable fishing and livestock productivity. In addition, the project will reform policies and institutions, including the establishment of a national water resource management plan and natural resource and land use management plans, and create local capacities to increase understanding of best-practices to sustainably use and maintain irrigation and market infrastructure.
Land
321,508 household, commercial, and legal entities gained protected land rights
MCC works with partner countries to improve land governance and administration, strengthen property rights, and stimulate private-sector investment for more productive land use. In Cabo Verde, MCC has invested to reduce the time required to register property rights and establish more conclusive land records in areas with high development potential. MCC funding was used under a pilot activity to complete surveys for 100 percent of land parcels on the island of Sal, which are now being registered. This activity led to the passage of a legal amendment in August 2016 that streamlined the land survey and registration process. MCC is now funding the survey and registration of an additional 22,824 parcels on the islands of Boa Vista, Maio, and Sao Vicente. In Indonesia, MCC’s investment in natural resource management and renewable energy includes development of a methodology for community-based participatory mapping of village boundaries and cultural and natural resources. Following this methodology, villages are able to produce legally recognized village maps to enhance land use plans. As of September 30, 2016, MCC funding had assisted 114 communities in defining and demarcating the boundaries of their villages. Land and natural resource information systems were being installed in government offices in 35 districts across 10 provinces to provide decision-makers with the information they need to encourage investment while effectively supporting the management of their land and other natural resources.
Education
772 education facilities constructed or rehabilitated
4,716 instructors trained
215,607 students participating in MCC-supported education activities
MCC works with partner countries to ensure that students obtain the knowledge and skills demanded by the private sector. In FY 2016, El Salvador officially announced its commitment to reform the technical and vocational education and training (TVET) system, identifying four transformative industries to target. The Salvadorians are establishing Skills Sector Committees for each of these four industries to define demand-driven training programs to feed into the overall technical and vocational educating training system. In Georgia, 26 schools have been completed, with another 3 on track to be completed by December 2017 and hundreds of students will be able to move into highly improved learning environments. Also in Georgia, more than 1,600 principals have been trained. The MCA-Georgia TVET Facility has awarded its first round of grants totaling approximately $12 million, slated to be disbursed in 2018. In September 2016, construction tenders were successfully launched for rehabilitation of pilot schools for MCC’s Morocco Compact. Also in Morocco, preparations are underway to field test an innovative Integrated School Improvement Model that will eventually be implemented in approximately 100 secondary schools, and planning advanced significantly for a TVET Grant Facility as well as a results-based financing component of the compact that aims to improve job placement for women and at-risk youth. In Cote D’Ivoire, MCC signed a Compact with the government in November 2017. The Compact includes an education project with investments in both secondary education and TVET. The secondary education activity will increase access to and the quality of education for students, while the TVET activity will introduce a demand-driven model of skills development with private sector governance. Further, the Guatemala threshold program now includes a TVET component.
Health
1,564 health providers trained on growth monitoring
6,857 service providers trained on community-led total sanitation triggering
16,797 service providers trained on infant and young child feeding
MCC works with partner countries to integrate sanitation, maternal and child health, and nutrition interventions to reduce stunting and increase household income. In Indonesia, MCC has committed more than $130 million to improve nutrition and health. MCC’s Indonesia Compact includes a partnership with the World Bank using incentives-based community grants to increase the demand for health, nutrition and education services and improves the health sector’s capacity to respond to increased demand at the facility and community level. In Sierra Leone, MCC has committed $5 million to improve access to reliable and safe water and sanitation (WASH) services, and to promote WASH practices at the household level. Increased access to safe drinking water, food, and sanitation services is critical to improving children’s nutritional status and preventing environmental enteropathy, which has been associated with growth failure in children.
Common Indicators
Agriculture and Irrigation (all common indicators data as of September 10, 2017)
Process Indicators
Output Indicators
Outcome Indicators
Country
Region
(AI-1)
Value of signed irrigation feasibility and design contracts (USD)
(AI-2)
Percent disbursed of irrigation feasibility and design contracts
(AI-3)
Value of signed irrigation construction contracts (USD)
(AI-4)
Percent disbursed of irrigation construction contracts
(AI-5) Temporary employment generated in irrigation
(AI-6)
Farmers trained
(AI-7) Enterprises assisted
(AI-8)
Hectares under improved irrigation
(AI-9)
Loan borrowers
(AI-10)
Value of agricultural and rural loans (USD)
(AI-11) Farmers who have applied improved practices as a result of training
(AI-12) Hectares under improved practices as a result of training
(AI-13) Enterprises that have applied improved techniques
MCC Total
51,925,328
87.3%
698,425,169
90.2%
6,908
330,814
4,223
203,963
1,195
87,074,694
126,592
42,226
1,016
EAPLA* Total
10,686,574
93.0%
190,892,731
88.1%
2,975
139,419
1,597
11,926
1,099
66,414,932
56,496
7,279
418
AFRICA Total
41,238,754
85.8%
507,532,438
90.9%
3,933
191,395
2,626
192,037
96
20,659,762
70,096
34,947
598
Armenia
EAPLA
4,601,073
100.0%
106,653,443
100.0%
2,389
45,639
227
-
1,008
13,133,200
26,424
-
178
El Salvador
-
-
-
-
-
15,363
281
-
29
4,598,748
11,520
-
163
Georgia
1,155,881
53.4%
-
-
-
-
291
-
-
19,880,003
-
-
-
Honduras
-
-
-
-
-
7,265
464
400
-
17,100,000
6,996
-
-
Indonesia
-
-
-
-
-
55,479
-
-
-
-
-
-
-
Moldova
4,929,620
95.7%
84,239,288
73.0%
586
6,569
334
11,526
62
11,702,981
2,452
7,279
77
Nicaragua
-
-
-
-
-
9,104
-
-
-
-
9,104
-
-
Burkina Faso
AFRICA
17,268,474
74.8%
74,339,448
95.3%
2,414
12,307
278
2,240
96
2,802,000
8,237
3,369
28
Cabo Verde I
-
-
5,167,848
97.6%
-
553
-
13
-
617,000
106
-
-
Ghana
5,202,887
100.0%
13,009,963
100.0%
-
66,930
1,724
514
-
16,740,762
59,060
-
535
Madagascar
-
-
-
-
-
31,366
324
-
-
-
1,892
-
1
Mali
9,077,220
98.2%
148,951,503
98.3%
-
1,308
-
97,503
-
500,000
801
-
-
Morocco
-
-
111,353,027
99.0%
-
40,863
114
53,376
-
-
-
31,578
34
Mozambique
-
-
-
-
-
28,830
186
-
-
-
-
-
-
Namibia
-
-
-
-
-
9,238
-
-
-
-
-
-
-
Senegal
9,690,173
86.3%
154,710,649
75.0%
1,519
-
-
38,391
-
-
-
-
-
Gender**
Female
227
67,733
107
121
924,102
17,660
20
Male
4,292
156,967
413
1,066
13,580,879
40,077
85
All program data are as of September 10, 2017. Data are preliminary and subject to adjustment. Grey shading indicates closed-out Compacts; data revision is not expected for these Compacts. Indicators in this Results Framework may be added, removed, or modified as MCC's investments in education evolve over time. All MCC education programs have as their long-term end goal an increase in individual or household income and a corresponding decrease in poverty.
Gender totals may not match overall totals due to lack of gender counting in earlier compacts.
Education
Process Indicators
Output Indicators
Outcome Indicators
Country
Region
(E-1)
Value of signed educational facility construction, rehabilitation, and equipping contracts (USD)
(E-2)
Percent disbursed of educational facility construction, rehabilitation, and equipping contracts
(E-3)
Legal, financial, and policy reforms adopted
(E-4)
Educational facilities constructed or rehabilitated
(E-5)
Instructors trained
(E-6)
Students participating in MCC-supported education activities
(E-7)
Graduates from MCC-supported education activities
(E-8)
Employed graduates of MCC-supported education activities
MCC Total
208,031,689
92.4%
5
772
4,716
215,607
62,211
–
EAPLA Total
65,724,596
78.7%
5
66
2,107
48,599
16,252
–
AFRICA Total
142,307,093
98.7%
–
706
2,609
167,008
45,959
–
El Salvador I
EAPLA
9,857,585
99.8%
–
22
378
30,672
4,285
–
El Salvador II
–
–
–
–
–
–
–
–
Georgia II**
27,687,683
52.0%
–
26
359
447
–
–
Mongolia
28,179,328
97.6%
5
18
1,370
17,480
11,967
–
Burkina Faso
AFRICA
22,758,211
99.9%
–
396
557
31,065
4,035
–
Ghana
18,689,747
100.0%
–
250
–
41,019
–
–
Morocco
4,568,837
76.2%
–
–
2,052
93,424
41,383
–
Morocco II
–
–
–
–
–
–
–
–
Namibia
96,290,298
99.2%
–
60
–
1,500
541
–
Gender*
Female
2,420
72,963
36,990
–
Male
2,296
64,468
20,513
–
All program data are as of September 10, 2017. Data are preliminary and subject to adjustment. Grey shading indicates closed-out Compacts; data revision is not expected for these Compacts. Indicators in this Results Framework may be added, removed, or modified as MCC's investments in education evolve over time. All MCC education programs have as their long-term end goal an increase in individual or household income and a corresponding decrease in poverty.
Gender totals may not match overall totals due to lack of gender counting in earlier compacts.
** (E-5) Number decreased from 30 to 26 because it was misreported in the previous quarter.
Land
Output Indicators
Outcome Indicators
Country
Region
(L-1) Legal and regulatory reforms adopted
(L-2) Land administration offices established or upgraded
(L-3) Stakeholders trained
(L-4) Conflicts successfully mediated
(L-5) Parcels corrected or incorporated in land system
(L-6) Land rights formalized
(L-7) Percentage change in time for property transactions
(L-8) Percentage change in cost for property transactions
MCC Total
127
399
76,531
12,433
338,393
321,508
NA
NA
EAPLA Total
6
15
6,949
10,639
18,336
20,672
NA
NA
AFRICA Total
121
384
69,582
1,794
320,057
300,836
NA
NA
Indonesia
EAPLA
-
-
3,029
-
-
-
-
-
Mongolia
6
15
3,920
10,639
18,336
20,672
-
-
Nicaragua
-
-
-
-
-
-
-
-
Benin
AFRICA
-
-
50
-
-
-
-
-
Burkina Faso
54
78
61,057
1,364
18,490
4,793
-
-
Cabo Verde II
29
38
439
178
22,913
9,723
-
-
Ghana
4
3
427
23
1,481
-
-
-
Lesotho
11
1
575
151
53,296
21,753
-93
-
Madagascar
4
237
-
-
-
-
-
-
Mali
-
1
1,354
-
-
-
-
-
Mozambique
-
26
1,516
-
205,005
251,556
-
-
Morocco II
-
-
-
-
-
-
-
-
Namibia
19
-
2,524
-
8,869
4,356
-
-
Senegal
-
-
1,640
78
10,003
8,655
-
-
Gender*
Male
53,837
85,665
Female
21,538
55,141
Joint
18,802
Location*
Urban
195,308
154,475
Rural
89,789
124,608
All program data are as of September 10, 2017. Data are preliminary and subject to adjustment. Grey shading indicates closed-out Compacts; data revision is not expected for these Compacts. Indicators in this Results Framework may be added, removed, or modified as MCC's investments in education evolve over time. All MCC education programs have as their long-term end goal an increase in individual or household income and a corresponding decrease in poverty.
Gender and location totals may not match overall totals due to lack of counting by gender and location in earlier compacts.
Power
Process Indicators
Output Indicators
Country
Region
(P-1)
Value of signed power infrastructure feasibility and design contracts
(P-2)
Percent disbursed of power infrastructure feasibility and design contracts
(P-3)
Value of signed power infrastructure construction contracts
(P-4)
Percent disbursed of power infrastructure construction contracts
(P-5)
Temporary employment generated in power infrastructure construction
(P-6)
Generation capacity added
(P-7 and P-10) Km lines upgraded or built
(P-8)
Transmission throughput capacity added
(P-9 and P-11) Substation capacity added
(P-12)
Customers added by project
(P-13)
Maintenance expenditure-asset value ratio
(P-14)
Cost-reflective tariff regime
MCC Total
21,691,032
105.6%
489,000,472
68.6%
8,293
44
4,318
NA
84
35,412
NA
NA
EAPLA Total
–
0.0%
0
0.0%
–
–
1,523
NA
–
35,412
NA
NA
AFRICA total
21,691,032
105.6%
489,000,472
68.6%
8,293
44
2,796
NA
84
–
NA
NA
El Salvador
EAPLA
–
–
–
–
–
–
1,523
–
–
35,412
–
–
Georgia
–
–
–
–
–
–
–
–
–
–
–
–
Indonesia
–
–
–
–
–
–
–
–
–
–
–
–
Mongolia
–
–
–
–
–
–
–
–
–
–
–
–
Benin II
AFRICA
–
–
–
–
–
–
–
–
–
–
–
–
Ghana
–
–
–
–
–
–
99
–
–
Ghana II
–
–
–
–
–
–
–
–
–
–
–
–
Liberia***
–
–
101,773,325
100.0%
–
44
24
–
84
–
–
–
Malawi
5,943,608
98.0%
233,674,595
44.0%
4,220
–
–
–
–
–
2
–
Tanzania
15,747,424
108.6%
153,552,553
85.3%
4,073
–
2,673
–
–
–
–
–
T&D
Transmission
–
–
–
–
–
–
–
–
–
–
–
–
Distribution
–
–
–
–
–
–
4,294
–
–
–
–
–
Gender*
Female
–
–
Male
–
–
Grid
On-grid
–
Off-grid
–
Tariff class
Residential
–
Commercial
–
Industrial
–
All program data are as of September 10, 2017. Data are preliminary and subject to adjustment. Grey shading indicates closed-out Compacts; data revision is not expected for these Compacts.
*Gender totals may not match overall totals due to lack of gender counting in earlier compacts.
** This is a monitoring indicator and cannot be attributed solely to MCC investment.
*** Not all common indicator data for Liberia were included for this quarter as the data are still being verified.
****In Ghana II there are two utilities who report different SAIDI and SAIFI numbers. P-21 - ECG: 24.02, NEDCo: 35 P-22 - ECG: 23.57, NEDCo: 39.5
Power (continued)
Outcome Indicators
Country
Region
(P-15)
Total electricity supply
(P-16)
Power plant availability
(P-17)
Installed generation capacity
(P-18)
Transmission system technical losses (%)
(P-19)
Distribution system losses
(P-20)
Commercial losses
(P-21)
System Average Interruption Duration Index (SAIDI)
(P-22)
System Average Interruption Frequency Index (SAIFI)
(P-23)
Total electricity sold
(P-24)
Operating cost-recovery ratio
(P-25)
Percentage
of households connected to the national grid
(P-26)
Share of
renewable energy in the country
MCC Total
13,796,863
NA
5,732
NA
NA
NA
NA
NA
1,810,250
NA
NA
NA
EAPLA Total
0
NA
0
NA
NA
NA
NA
NA
0
NA
NA
NA
AFRICA total
13,796,863
NA
5,732
NA
NA
NA
NA
NA
1,810,250
NA
NA
NA
El Salvador
EAPLA
–
–
–
–
–
–
–
–
–
–
–
–
Georgia
–
–
–
–
–
–
–
–
–
–
–
–
Indonesia
–
–
–
–
–
–
–
–
–
–
–
–
Mongolia
–
–
–
–
–
–
–
–
–
–
–
–
Benin II
AFRICA
–
–
–
–
–
–
–
–
–
–
–
–
Ghana
–
–
–
–
–
–
–
–
–
–
–
–
Ghana II
11,935,781
77.6
4,316
–
–
–
24.02; 35****
23.57; 39.5****
–
–
–
–
Liberia***
60,236
65
139
–
–
–
81
57
29,156
–
6
32
Malawi
1,800,846
108
327
23.2
18.3
–
–
–
1,455,324
67.60
–
100
Tanzania
–
–
949
–
–
–
–
–
325,769
–
–
–
T&D
Transmission
–
–
–
–
–
–
–
–
–
–
–
–
Distribution
–
–
–
–
–
–
–
–
–
–
–
–
Gender*
Female
Male
Grid
On-grid
–
Off-grid
–
Tariff class
Residential
–
Commercial
–
Industrial
–
All program data are as of September 10, 2017. Data are preliminary and subject to adjustment. Grey shading indicates closed-out Compacts; data revision is not expected for these Compacts.
*Gender totals may not match overall totals due to lack of gender counting in earlier compacts.
** This is a monitoring indicator and cannot be attributed solely to MCC investment.
*** Not all common indicator data for Liberia was included for this quarter as the data is still being verified.
****In Ghana II there are two utilities who report different SAIDI and SAIFI numbers. P-21 - ECG: 24.02,
NEDCo: 35 P-22 - ECG: 23.57, NEDCo: 39.5
Roads
Process Indicators
Output Indicators
Outcome Indicators
Country
Region
(R-1)
Value of signed road feasibility and design contracts
(R-2)
Percent disbursed of road feasibility and design contracts
(R-3)
Kilometers of roads under design
(R-4)
Value of signed road construction contracts
(R-5)
Percent disbursed of road construction contracts
(R-6)
Kilometers of roads under works contracts
(R-7)
Temporary employment generated in road construction
(R-8)
Kilometers of roads completed
(R-9) Roughness
(R-10)
Average annual daily traffic
(R-11)
Road traffic fatalities
MCC Total
130,499,160
96.7%
4,465
2,345,958,621
88.8%
3,918
49,822
3,035
NA
NA
655
EAPLA Total
64,075,771
93%
1,791
1,084,655,312
90%
1834.3
1,309
1,749
–
–
–
AFRICA Total
66,423,389
100%
2,675
1,261,303,310
87%
2083.4
48,513
1,286
–
–
651
Armenia
EAPLA
–
–
–
–
–
–
–
24.4
3.47
735
–
El Salvador I
18,321,410
99%
223
248,378,825
97%
223.0
–
223.32
–
–
–
El Salvador II
–
–
32
–
–
–
–
–
–
–
–
Georgia
11,980,000
99%
–
197,299,030
100%
220.2
–
220.20
1.50
1,092
–
Honduras
9,500,000
75%
673
179,400,000
72%
673.0
–
610.10
–
–
–
Moldova
–
–
96
100,807,443
96%
96.0
1,309
96
–
–
4
Mongolia
6,083,650
89%
19.3
73,108,907
91%
176.4
–
176.40
1.90
353
–
Nicaragua
–
–
375.5
56,507,526
100%
74.0
–
74.0
–
–
–
Philippines
15,235,623
94%
222.0
173,156,531
81%
222.0
–
175.0
–
–
–
Vanuatu
2,955,088
100%
150
55,997,051
97%
149.7
–
149.70
3.00
–
–
Burkina Faso
AFRICA
8,339,651
115%
536
140,205,145
102%
419.1
4,162
277.80
–
–
6
Cape Verde I
3,520,000
92%
63
24,280,000
100%
40.6
–
40.60
2.00
–
Ghana
5,549,044
100%
943
250,604,022
100%
446.4
35,455
445.03
–
602
Liberia
–
–
–
–
–
–
–
–
–
–
–
Mali
–
–
–
42,918,038
35%
81.0
–
79.00
–
–
–
Mozambique**
17,669,992
85%
253
132,240,557
88%
253.0
2,308
253
–
–
Senegal
12,201,371
102%
406
271,128,882
70%
375.0
2,757
***
–
–
43
Tanzania
19,143,331
107%
473
399,926,666
91%
468.34
3,831
190.14
–
–
–
Gender*
Male
13,260
45
Female
1,197
4
Road Type*
Primary
65,222,944
23%
2,093
1,342,644,867
90%
1,867
1,177.58
Secondary
24,735,623
87%
1,374
617,229,323
85%
1,133
478.65
Tertiary
6,719,183
112%
935
164,505,401
66%
681
1,077.77
All program data are as of September 10, 2017. Data are preliminary and subject to adjustment. Grey shading indicates closed-out Compacts; data revision is not expected for these Compacts.
*Gender and road type totals may not match overall totals due to lack of counting by gender and road type in earlier Compacts.
** The kilometers of roads completed for Mozambique is provisional data. Subject to change after verification of takeover certificates.
*** According to the Common Indicator definition, a road is completed when official certificates are handed over and approved. In Senegal, this was taken to mean final acceptance of the road works, which typically happens after the end of the 1 year defects liability period which starts when the construction is completed and the roads are provisionally accepted. As part of its Compact, Senegal intended to rehabilitate 372 kilometers of national roads. By September 2015, when the Senegal Compact closed, no roads had achieved final acceptance, and therefore were not officially completed, per the common indicator definition. However, by the end of the Compact, 185km of roads had been fully rehabilitated and had received provisional acceptance. An additional 72km were provisionally accepted in November 2015, and the remaining 116km are anticipated to be provisionally accepted with the support of the Government of Senegal by mid-2016.
Water Supply, Sanitation, and Hygiene
Process Indicators
Output Indicators
Country
Region
(WS-1)
Value of signed water and sanitation feasibility and design contracts (USD)
(WS-2)
Percent disbursed of water and sanitation feasibility and design contracts
(WS-3)
Value of signed water and sanitation construction contracts (USD)
(WS-4)
Percent disbursed of water and sanitation construction contracts
(WS-5) Temporary employment generated in water and sanitation construction
(WS-6)
People trained in hygiene and sanitary best practices
(WS-7)
Water points constructed
MCC Total
57,878,874
96.1%
798,435,421
81.4%
21,459
12,135
1,181
EAPLA Total
5,250,665
96.2%
303,498,694
98.8%
3,825
2,406
–
AFRICA Total
52,628,209
96.1%
494,936,726
70.7%
17,634
9,729
1,181
El Salvador
EAPLA
4,983,800
96.0%
10,451,448
97.5%
–
2,406
–
Georgia
266,865
100.0%
54,315,000
94.2%
–
–
–
Jordan
–
–
238,732,246
100%
3,825
–
–
Cabo Verde II****
AFRICA
730,419
82.0%
18,739,566
78.0%
759
32
–
Ghana
1,475,148
100.0%
13,949,465
100.0%
–
778
392
Lesotho
3,594,133
100.0%
59,733,645
89%
11,527
454
175
Mozambique
35,076,009
99.1%
169,500,497
87.5%
2,276
8,400
614
Tanzania
6,861,280
102.1%
45,403,796
81.1%
387
–
–
Zambia
4,891,220
64.0%
187,609,757
44.0%
2,685
65
–
Gender*
Female
1,059
5,777
Male
8,486
5,904
All program data are as of September 10, 2017. Data are preliminary and subject to adjustment. Grey shading indicates closed-out Compacts; data revision is not expected for these Compacts.
*Gender totals may not match overall totals due to lack of gender counting in earlier compacts.
** This is a monitoring indicator; any change over baseline data represents the current trend and does not represent the direct impact of the MCC‐investment.
*** Jordan's M&E Plan has, throughout the life of the compact, defined hours of supply as hours/week. As such all documentation is in this form. The value here has been divided by 7 here to accurately reflect supply hours per day.
****(WS-8): In Cabo Verde II the utility is in transition and during this period it has experienced challenges with its billing system and low collection rates, which accounts for some of the high rates of Non revenue water.
****(WS-5): Number decreased due to a correction in previously recorded data in Cabo Verde II.
*****The current unit for volume of water produced has a discrepancy. MCC M&E is in the process of revising this common indicator to clarify and align with current industry standards.
Water Supply, Sanitation, and Hygiene (continued)
Outcome Indicators
Country
Region
(WS-8)
Non revenue water
(WS-9)
Continuity of service
(WS-10)
Operating cost coverage
(WS-11)**
Volume of water produced*****
(WS-12)
Access to improved water supply
(WS-13)
Access to improved sanitation
(WS-14)**
Residential water consumption
(WS-15)**
Industrial/Commercial water consumption
(WS-16)**
Prevalence of diarrhea
MCC Total
52.9%
NA
NA
220,152,344
NA
NA
NA
NA
NA
EAPLA Total
50.7%
–
–
–
–
–
–
–
AFRICA Total
55.1%
–
–
220,152,344
–
–
–
–
–
El Salvador
EAPLA
–
–
–
–
83.0%
88%
Georgia
–
–
–
–
–
–
–
–
–
Jordan
50.7%
7.35***
85.6%
–
–
67%
54.1
–
3.1
Cabo Verde II****
AFRICA
97.5%
14.6
64%
–
81.50%
75
22.0
–
Ghana
–
–
–
–
–
–
36.0
–
–
Lesotho
27.0%
–
–
–
–
–
–
–
–
Mozambique
–
–
–
–
23.4%
–
19.5
–
–
Tanzania
48.8%
–
113.1%
200,330,000
–
–
166.5
998,439.6
–
Zambia
47.0%
18
110.0%
19,822,344
–
–
–
–
–
Gender*
Female
Male
All program data are as of September 10, 2017. Data are preliminary and subject to adjustment. Grey shading indicates closed-out Compacts; data revision is not expected for these Compacts.
*Gender totals may not match overall totals due to lack of gender counting in earlier compacts.
** This is a monitoring indicator; any change over baseline data represents the current trend and does not represent the direct impact of the MCC‐investment.
*** Jordan's M&E Plan has, throughout the life of the compact, defined hours of supply as hours/week. As such all documentation is in this form. The value here has been divided by 7 here to accurately reflect supply hours per day.
****(WS-8): In Cabo Verde II the utility is in transition and during this period it has experienced challenges with its billing system and low collection rates, which accounts for some of the high rates of Non revenue water.
****(WS-5): Number decreased due to a correction in previously recorded data in Cabo Verde II.
*****The current unit for volume of water produced has a discrepancy. MCC M&E is in the process of revising this common indicator to clarify and align with current industry standards.
FY 2018 Corporate Goals
For FY 2018, MCC management established four specific goals to guide agency planning and performance for the year. These goals build on MCC’s current strategic plan, NEXT, as the agency awaits incoming political leadership. As in past years, these corporate goals are the starting point for annual department and division goal-setting, from which staff develop their individual performance plans. Below you will find MCC’s FY 2018 corporate goals with a brief description of MCC’s progress to date.
Corporate Priority
Progress
Advance and deliver high‐quality compacts and threshold programs.
For program development, MCC is on target to present compact programs with Mongolia, Senegal and Sri Lanka to the Board in FY 2018, while closely monitoring progress on potential compact programs with Tunisia and Burkina Faso to ensure successful Board presentations in FY 2019. MCC is also monitoring ongoing governance challenges in Togo to determine the best path forward for the proposed Togo threshold program, while initiating compact and threshold program development, respectively, with Timor-Leste and the Gambia.For program implementation, highlights include the signing on the Cote d’Ivoire compact and the successful close out of MCC’s $66 million compact with Cabo Verde in November, as well as entry into force of the Niger compact in January 2018. MCC is also preparing for close out in Indonesia and Honduras, while closely monitoring implementation progress across the compact and threshold program portfolio.
Strengthen organization health and effectiveness.
For FY 2018, MCC is focused on three improvements—reforming MCC’s performance management system, implementing targeted efforts to improve knowledge management, and creating tools to better link workforce decisions to agency business needs. For performance management, the agency launched a new recognition program and successfully completed the FY 2017 review cycle utilizing new agency-wide leadership dimensions/guidance. For knowledge management, MCC completed an assessment and is implementing key elements of the KM action plan. On workforce planning, the agency launched an organizational development assessment and continues to make progress on improved workforce demand tools.
Enhance operational and technical agility.
As described elsewhere in this document, MCC launched an “efficiency challenge” to identify opportunities to improve and shorten the program development process, launched the new Star Report tool to consolidate and streamline reporting, rolled out a new U.S. market outreach strategy, and is piloting new program management tools for country partners to better and more consistently manage—and report to MCC about—compact projects/activities.
Advance MCC policy and legislative initiatives.
In anticipation of MCC’s incoming leadership team, the agency is preparing several key policy and legislative initiatives for consideration by new leadership. Specifically, MCC continues to engage with Congress to obtain concurrent compact authority for the purposes of making regional investments, with legislation expected to be voted on by the full Senate and the House in early 2018. In addition, the agency has continued efforts to better assess and measure the impact of MCC programs/activities focused on policy and institutional reform.