

Compact Amounts at Signing and Key Dates ($ millions)*
| Partner Country | Compact Amount | Signed | Entry Into Force | Compact End Date |
|---|---|---|---|---|
| Madagascar | $109.8 | 04/18/2005 | 07/27/2005 | 08/31/2009 |
| Honduras | $215.0 | 06/14/2005 | 09/30/2005 | 09/30/2010 |
| Cabo Verde | $110.1 | 07/05/2005 | 10/18/2005 | 10/18/2010 |
| Nicaragua | $175.0 | 07/15/2005 | 05/26/2006 | 05/26/2011 |
| Georgia | $395.3 | 09/12/2005 | 04/07/2006 | 04/07/2011 |
| Benin | $307.3 | 02/22/2006 | 10/06/2006 | 10/06/2011 |
| Vanuatu | $65.7 | 03/02/2006 | 04/28/2006 | 04/28/2011 |
| Armenia | $235.7 | 03/27/2006 | 09/29/2006 | 09/29/2011 |
| Ghana | $547.0 | 08/01/2006 | 02/16/2007 | 02/16/2012 |
| Mali | $460.8 | 11/13/2006 | 09/18/2007 | 08/24/2012 |
| El Salvador | $460.9 | 11/29/2006 | 09/20/2007 | 09/20/2012 |
| Mozambique | $506.9 | 07/13/2007 | 09/22/2008 | 09/22/2013 |
| Lesotho | $362.6 | 07/23/2007 | 09/17/2008 | 09/17/2013 |
| Morocco | $697.5 | 08/31/2007 | 09/15/2008 | 09/15/2013 |
| Mongolia | $284.9 | 10/22/2007 | 09/17/2008 | 09/17/2013 |
| Tanzania | $698.1 | 02/17/2008 | 09/17/2008 | 09/17/2013 |
| Burkina Faso | $480.9 | 07/14/2008 | 07/31/2009 | 07/31/2014 |
| Namibia | $304.5 | 07/28/2008 | 09/16/2009 | 09/16/2014 |
| Senegal | $540.0 | 09/16/2009 | 09/23/2010 | 09/23/2015 |
| Moldova | $262.0 | 01/22/2010 | 09/01/2010 | 09/01/2015 |
| Philippines | $433.9 | 09/23/2010 | 05/25/2011 | 05/25/2016 |
| Jordan | $275.1 | 10/25/2010 | 12/13/2011 | 12/13/2016 |
| Cabo Verde | $66.2 | 02/10/2012 | 11/30/2012 | 11/30/2017 |
| Indonesia | $600.0 | 11/19/2011 | 04/02/2013 | 04/02/2018 |
| Malawi | $350.7 | 04/07/2011 | 09/20/2013 | 09/20/2018 |
| Zambia | $354.8 | 5/10/2012 | 11/15/2013 | 11/15/2018 |
| Georgia | $140.0 | 07/26/2013 | 07/01/2014 | 07/01/2019 |
| El Salvador | $277.0 | 09/30/2014 | 09/09/2015 | 09/09/2020 |
| Liberia | $256.7 | 10/02/2015 | 01/20/2016 | 01/21/2021 |
| Ghana | $498.2 | 08/05/2014 | 09/06/2016 | |
| Benin | $375.0 | 09/09/2015 | 06/22/2017 | |
| Morocco | $450.0 | 11/30/2015 | 06/30/2017 | |
| Niger | $437.0 | 07/29/2016 | 01/26/2018 | |
| Côte d'Ivoire | $524.7 | 11/07/2017 | 08/05/2019 | |
| Mongolia | $350.0 | 07/27/2018 | 03/31/2021 | |
| Senegal | $550.0 | 12/10/2018 | ||
| Nepal | $500.0 | 09/14/2017 | ||
| Burkina Faso | $450.0 | 08/13/2020 |
Compact Commitments, Obligations, and Plan
As of Second Quarter FY 2021
$'s in millions
| Fiscal Year of appropriation | ||||||||||||
|---|---|---|---|---|---|---|---|---|---|---|---|---|
| Country Program | 2012 & Prior | 2013 | 2014 | 2015 | 2016 | 2017 | 2018 | 2019 | 2020 | 2021 | 2022 | TOTAL |
| El Salvador II | 117 | 160 | - | - | - | - | - | - | - | - | - | $277 |
| Ghana II* | 17 | 277 | 15 | - | - | - | - | - | - | - | - | $308 |
| Liberia | - | - | - | 257 | - | - | - | - | - | - | $257 | |
| Benin II | - | 207 | - | 168 | - | - | - | - | - | - | - | $375 |
| Morocco II | 114 | 1 | 169 | 166 | - | - | - | - | - | - | - | $450 |
| Niger | 58 | - | - | - | 379 | - | - | - | - | - | - | $437 |
| Nepal | 108 | 10 | - | 69 | 107 | 129 | 77 | - | - | - | - | $500 |
| Cote D'Ivoire | 41 | 9 | 272 | 10 | 26 | 167 | - | - | - | - | - | $525 |
| Mongolia | 100 | - | - | 1 | - | 95 | 154 | - | - | - | - | $350 |
| Senegal II | 21 | - | 1 | - | - | - | 447 | 81 | - | - | - | $550 |
| Burkina Faso II | 17 | - | 85 | - | - | - | - | 309 | 39 | - | - | $450 |
| Committed & Obligated | $592 | $664 | $541 | $671 | $512 | $391 | $678 | $390 | $39 | $ - | $ - | $4,479 |
| Fiscal Year of appropriation | ||||||||||||
|---|---|---|---|---|---|---|---|---|---|---|---|---|
| Country Program | 2012 & Prior | 2013 | 2014 | 2015 | 2016 | 2017 | 2018 | 2019 | 2020 | 2021 | 2022 | TOTAL |
| Tunisia | 124 | - | - | - | 135 | - | - | 68 | 138 | 34 | $499 | |
| Lesotho II | - | - | 145 | - | - | - | - | 113 | 53 | - | $310 | |
| Timor-Leste | - | - | - | - | - | - | - | - | 291 | - | 90 | $381 |
| Malawi II | - | - | - | - | - | - | - | - | 27 | 243 | 80 | $350 |
| Kosovo | - | - | - | - | - | - | - | 50 | - | 74 | 76 | $200 |
| Regional Transport | - | - | - | - | - | - | - | - | - | 300 | 150 | $450 |
| Regional Energy | - | - | - | - | - | - | - | - | - | - | 252 | $252 |
| Indonesia II | - | - | - | - | - | - | - | - | - | - | - | $ - |
| Mozambique II | - | - | - | - | - | - | - | - | - | - | - | $ - |
| Sierra Leone | - | - | - | - | - | - | - | - | - | - | - | $ - |
| Compact Extensions* | 37 | - | - | - | - | - | - | - | 21 | - | - | $57 |
| Planned | $161 | $ - | $145 | $ - | $135 | $ - | $ - | $230 | $529 | $651 | $648 | $2,498 |
*Per the Consolidated Appropriations Act, 2021 (P.L. 116-260), MCC has been authorized to extend any compact in implementation as of January 29, 2020, for up to one additional year to account for delays related to the COVID-19 pandemic. Prior year funds are planned to be utilized to cover program administration, supervision, and oversight costs for the period of extension in support of five compacts currently undergoing implementation.
Closed Compacts
As of Second Quarter FY 2021
| Fiscal Year of appropriation | ||||||||||
|---|---|---|---|---|---|---|---|---|---|---|
| Country Program | 2004 | 2005 | 2006 | 2007 | 2008 | 2009 | 2010 | 2011 | 2012 | Total |
| Armenia | - | 177 | - | - | - | - | - | - | - | $177 |
| Benin | - | 302 | - | - | - | - | - | - | - | $302 |
| Burkina Faso | - | - | - | - | 475 | - | - | - | - | $475 |
| Cabo Verde | 109 | - | - | - | - | - | - | - | - | $109 |
| Cabo Verde II | - | - | - | - | - | - | - | - | 66 | $66 |
| El Salvador | - | - | 362 | 88 | - | - | - | - | - | $450 |
| Georgia | 290 | 24 | - | 17 | 56 | - | - | - | - | $387 |
| Georgia II | - | - | - | - | - | - | - | - | 139 | $139 |
| Ghana | - | 536 | - | - | - | - | - | - | - | $536 |
| Honduras | 204 | - | - | - | - | - | - | - | - | $204 |
| Indonesia | - | 49 | - | - | - | - | - | 425 | - | $474 |
| Jordan | - | - | - | - | - | 55 | 218 | - | - | $273 |
| Lesotho | - | - | - | 358 | - | - | - | - | - | $358 |
| Madagascar | 86 | - | - | - | - | - | - | - | - | $86 |
| Malawi | - | - | - | - | - | - | 208 | 137 | - | $345 |
| Mali | - | - | 434 | - | - | - | - | - | - | $434 |
| Moldova | 90 | 16 | 8 | 1 | 9 | 86 | 49 | - | - | $259 |
| Mongolia | - | - | - | 269 | - | - | - | - | - | $269 |
| Morocco | - | 72 | 578 | - | - | - | - | - | - | $650 |
| Mozambique | - | - | - | 448 | - | - | - | - | - | $448 |
| Namibia | - | - | - | 219 | 76 | - | - | - | - | $296 |
| Nicaragua | 113 | - | - | - | - | - | - | - | - | $113 |
| Philippines | - | - | - | - | - | - | 385 | - | - | $385 |
| Senegal | - | - | - | - | - | 433 | - | - | - | $433 |
| Tanzania | - | - | - | - | 695 | - | - | - | - | $695 |
| Vanuatu | - | 65 | - | - | - | - | - | - | - | $65 |
| Zambia | - | - | - | - | - | - | - | - | 332 | $332 |
| Closed Compacts | $891 | $1,242 | $1,383 | $1,400 | $1,310 | $574 | $860 | $561 | $536 | $8,758 |
Threshold Program Amounts at Signing and Key Dates ($ millions)*
| Country | Threshold Program Amount | Signed | Completed |
|---|---|---|---|
| Burkina Faso | $12.9 | 07/22/2005 | 09/30/2008 |
| Malawi | $20.9 | 09/29/2005 | 09/30/2008 |
| Albania | $13.9 | 04/03/2006 | 11/15/2008 |
| Tanzania | $11.2 | 05/03/2006 | 12/30/2008 |
| Paraguay | $34.6 | 05/08/2006 | 08/31/2009 |
| Zambia | $22.7 | 05/22/2006 | 02/28/2009 |
| Philippines | $20.7 | 07/26/2006 | 05/29/2009 |
| Jordan | $25.0 | 10/17/2006 | 08/29/2009 |
| Indonesia | $55.0 | 11/17/2006 | 12/31/2010 |
| Ukraine | $45.0 | 12/04/2006 | 12/31/2009 |
| Moldova | $24.7 | 12/15/2006 | 02/28/2010 |
| Kenya | $12.7 | 03/23/2007 | 12/31/2010 |
| Uganda | $10.4 | 03/29/2007 | 12/31/2009 |
| Guyana | $6.7 | 08/23/2007 | 02/23/2010 |
| São Tomé & Principe | $8.7 | 11/09/2007 | 04/15/2011 |
| Kyrgyz Republic | $16.0 | 03/14/2008 | 06/30/2010 |
| Niger | $23.1 | 03/17/2008 | 12/31/2015 |
| Peru | $35.6 | 06/09/2008 | 09/30/2012 |
| Rwanda | $24.7 | 09/24/2008 | 12/31/2011 |
| Albania | $15.7 | 09/29/2008 | 07/31/2011 |
| Paraguay | $30.3 | 04/13/2009 | 07/31/2012 |
| Liberia | $15.1 | 07/06/2010 | 12/15/2013 |
| Timor-Leste | $10.5 | 09/22/2010 | 03/31/2014 |
| Honduras | $15.7 | 08/28/2013 | 05/31/2019 |
| Sierra Leone | $44.4 | 11/17/2015 | 03/31/2021 |
| Guatemala | $28.0 | 04/08/2015 | |
| Kosovo | $49.0 | 09/12/2017 | |
| Togo | $35.0 | 02/14/2019 |
* Please note that the values above are the signed threshold program amounts and do not reflect lower actual expenditures due to early terminations or funds for a threshold program not being fully spent.
Results of Recently-Closed Compacts and Threshold Programs
El Salvador Compact
| Overview | MCC marked the end of the $277 million El Salvador Investment Compact on September 9, 2020. The compact focused on regulatory reforms, education, and logistical infrastructure, with the goal of promoting private investment and economic growth in the country. Through three interrelated projects, the compact: 1) helped Salvadorans better meet labor market demands by improving the quality of general education and technical and vocational training; 2) reduced transportation and logistics costs that impede regional trade by investing in physical and technological infrastructure; and 3) strengthened El Salvador’s investment climate through regulatory and institutional reforms and introducing new partnership models with the private sector. The Human Capital Project’s Education Quality Activity benefited over 73,000 students by rehabilitating 45 schools, increasing classroom time by nearly 60 percent (from 25 to up to 40 hours per week), and training over 5,600 instructors. To address gender imbalance and disparity, a Gender Policy was developed and implemented at the Ministry of Education, Science, & Technology. The activity also supported the creation of an education management system (SIGES). The system tracks student performance, gathers information, and helps monitor the education system nationally, for more relevant and efficient decision-making, design, and implementation of education projects. To strengthen the links between labor market demand and skill supply, the Technical Vocational Education & Training (TVET) Activity created El Salvador’s first TVET Coordination Council that determined national skill requirements and developed certificates for trainees to set national standards for job qualifications. Over 470 people enrolled in MCC-supported trainings in nine different sectors. Additionally, MCC supported technical assistance to identify market trends and determine training needs that were not covered by the training institutes within the nine business chambers. Through the Investment Climate Project’s (ICP) Partnership Development Activity, El Salvador introduced its first-ever public-private partnerships (PPP). In 2020, a $57 million contract to improve the cargo terminal at El Salvador’s international airport was awarded and a procurement for a highway video lighting and surveillance concession was launched. The Compact also introduced a new model whereby the Government of El Salvador leveraged private sector funding by allocating its limited resources to strategic public sector investments. Nine investment agreements were signed between the public and private sectors, through which a $75 million combined investment from MCC and the Government leveraged $150 million in private investment to support two technical assistance projects, five water, sanitation, and irrigation projects, one border crossing, and one road bypass. The Regulatory Improvement Activity alleviated bureaucratic red tape to allow firms in El Salvador to carry out quicker and more profitable business transactions. This was achieved by creating a Regulatory Improvement Body (OMR), a National Registry of Procedures to help streamline required procedures and costs, and a framework for the Government to analyze its regulations and identify changes and reforms that would improve efficiency and increase transparency in the most common business processes. The Logistical Infrastructure Project expanded approximately 27 km of the coastal highway, one of El Salvador’s most important highways for regional trade. MCC's investments supported infrastructure and technological work at the El Amatillo border crossing (Honduras) with the aim to reduce wait times at the border and ease the flow of regional trade. This compact was MCC’s first program to close during the COVID-19 pandemic and was heavily impacted by its effects. While several project completion dates were delayed due to the pandemic, the Government demonstrated its commitment to country ownership and the shared investments and agreed to continue funding and managing the implementation of the remaining projects, which are estimated to be completed by mid-2021. |
|---|---|
| Policy Reforms | In order to maximize the success and sustainability of the El Salvador Ivestment Compact, MCC partnered with the Government to implemenet several reforms. Human Capital Project To maximize the sustainability of the investments and improve school management, the Human Capital Project supported policy reforms to improve oversight of schools and TVET programs. Through this project, the Ministry of Education, Science, and Technology (MINEDUCYT) created an operations and maintenance plan to oversee the 45 school clusters that benefited from the Compact. Other important reforms include: the incorporation of Vocational Technical Baccalaureates in each school cluster to expand the educational offerings; the management information system for education (SIGES); the creation of a Gender Unit within MINEDUCYT and the adoption of a gender policy; the development of a National Evaluation Unit, and an increase in the education budget. To strengthen the links between industry demand and the TVET skills supplied by the market, a Technical Education and Professional Training Coordination Council was created. This Council, comprised of MINEDUCYT, INSAFORP (Salvadoran Institute for Professional Training), and the Board of Sector Committees, coordinates education and job trainings and plans to establish national benchmarks for job qualifications. The Council will allow private and public sectors to bridge the gap between public education and job market demands. Investment Climate Project The reforms implemented through this project helped El Salvador better compete for foreign investments while improving business processes locally. The reforms focused on reducing bureaucracy and red tape and increasing trade facilitation by streamlining border crossing and customs procedures. Additionally, they supported increased transparency and alignment between local and national policies. Logistical Infrastructure Project To ensure longevity of MCC investments, the Government passed a financial reform in 2020 to increase funding to El Salvador’s Road Conservation Fund (FOVIAL), a compact condition precedent. This reform ensures an annual allocation of funding for road maintenance, in line with international best practices. |
| Outputs (preliminary) | Human Capital Project
|
| Preliminary and Expected Outcomes | Improved labor force by providing better general and technical education, and professional training in skills that matched the demands of international trade firms. Increased competitiveness in trade and an increase in private investment by reducing bureaucracy in El Salvador’s regulatory framework and building institutional capacity in the country. Reduced costs of transportation and necessary logistics and increased investment and productivity in the trade of goods and services, including relieving traffic at critical sections between the main border crossing with Honduras at El Amatillo, the Ports of La Union and Acajutla, and the international airport (SAL). |
| Evaluations | Human Capital Project The evaluation of the Education Quality Activity is comprised of two analyses. The first, a performance evaluation, will answer the following questions: how each component of the activity was implemented, were targets met, what helped and what hindered implementation of the activity, and what are the plans for sustainability. The second analysis, an impact evaluation, is focused on the Full-Time Inclusive Model Sub-Activity and compares outcomes for MCC-funded schools to outcomes for non-funded schools. The evaluation will measure the impact of the program on student dropout, academic performance, quality of education (as measured by time-on-task in the classroom), and other outcomes. The evaluation design report and baseline report can be found in MCC’s evaluation catalog. The baseline report was completed in April 2019, and the final report is expected in 2023. The evaluation of the TVET System Reform Activity will answer, qualitatively, questions such as: which courses were implemented, how the courses were implemented and what the perceived benefits of these courses were for trainees and for firms. In addition, the evaluation will assess the sustainability of key activities, such as the establishment of the Sector Committees, the Board of Sector Committees, and the Coordination Council, as well as which courses did sectors implement after the compact and how was the FOMELENIO II-purchased equipment used. Also, the evaluation will assess trainees’ perceived benefits from program participation, such as changes in their work responsibilities and tasks, perceived improvements in their work performance or work conditions, etc. The design report for this evaluation can be found in MCC's evaluation catalog. There is no baseline report, and the final report is expected in 2023. Investment Climate Project MCC published the interim report for the Investment Climate Project in June 2020, which includes early findings from all activities and sub-activities of the Investment Climate Project. The evaluation involves an analysis of data from affected institutions before and after the compact, surveys, interviews, and focus groups, to assess whether the program was implemented correctly, and its results and sustainability. The Key Findings of the Investment Climate Interim Evaluation Report (June 2020) include:
A final evaluation report that covers the full set of evaluation questions is underway and results will be available in 2024. Logistical Infrastructure Project The evaluation of the Logistical Infrastructure Project will utilize the Highway Development Model IV to assess the economic benefits of the road and border crossing improvements. The evaluation will cover the following research areas:
A final evaluation report that covers the full set of evaluation questions is underway and results will be available in 2023. |
Liberia Compact
| Overview | On January 20, 2021, MCC concluded the Liberia Compact, with 92.1 percent of the $256.7 million budget disbursed. The Compact’s Energy Project ($209 million) and Roads Project ($20 million) aimed to encourage economic growth and reduce poverty in Liberia by addressing the inadequate access to reliable and affordable electricity in the country and the poor quality of road infrastructure. The Energy Project is expected to benefit 528,000 Liberians over the long term by increasing the reliability and affordability of electricity. MCC’s investment of $151.5 million in the Mount Coffee Rehabilitation Activity, added to $212 million from three European funders, resulted in the reconstruction of the Mount Coffee Hydropower Plant (MCHPP), which was destroyed during Liberia’s 14-year civil war. Completed in 2018, the 88-megawatt MCHPP is the largest source of power and renewable energy supply for LEC, Liberia’s public electric utility. MCHPP enabled LEC to provide more reliable and affordable power supply to over 76,000 homes, businesses, and other entities, a three-fold increase since 2015. The electricity tariff reduced by 37.5 percent. The $23.7 million Mount Coffee Support Activity aimed to provide additional support to the MCHPP Rehabilitation Activity in part to mitigate environmental and social impacts and ensure long-term sustainability. In addition to supporting small-scale community infrastructure, the Activity funded the construction of a new, larger 48-inch diameter Raw Water Pipeline to replace one damaged during the civil-war. By drawing water from the Mt. Coffee reservoir and using gravity to deliver it, the new pipeline’s operation eliminated the need to pump water from downstream, where an up-river tidal flow would infuse salt water. The pipeline will save the Liberia Water and Sewer Corporation (LWSC) an estimated $780,000 annually in electricity costs. The $35.8 million Energy Sector Reform Activity complemented the rehabilitation of MCHPP by building the capacity of Liberia’s national electric utility and investing in other reforms and capacity building to strengthen the power sector. Results from a three-year management services contract for the Liberia Electricity Corporation (LEC) included strengthened planning and operations utility wide, increased new customer connections, improved customer service, enhanced environmental performance, and the building of staff capacity. Interim independent evaluation findings have shown significant progress to stabilizing LEC. Operationally, since 2015, total electricity supply has increased almost fourfold from 4.2 million megawatt hours (MWh) to 18.5 million MWh in 2019. After prompting the passage of a law modernizing the electricity sector’s legal framework, the compact also provided the seed money and technical assistance to stand-up the country’s independent electricity regulator. The first commissioners and technical staff were trained and took up their duties in 2019. Regulations and other instruments have been approved and the regulator began issuing its first licenses in 2021. The $20 million Road Project advanced passage of new road network management laws and with the support of the U.S. Department of Transportation’s Volpe Center, built a 5-year national road maintenance plan and supported a data driven approach to road maintenance. The Government, which faced grave fiscal challenges throughout the compact, was an active partner in meeting compact objectives. However, its commitment to policy reform was weak, particularly in regard to the Roads Project, where it failed to meet MCC conditions for disbursement of $15 million in matching funds for maintenance of Liberia’s roads. Failure to remove a presidentially appointed utility manager complicit in electricity theft and untimely payments for its own use of electricity are examples of the Government's inconsistent support of Energy Project objectives. |
|---|---|
| Policy Reforms | The Liberia Compact achieved or made progress toward achieving key sector policy reforms in the energy and road sectors:
The Roads Sector Reform Activity aimed to kick-start reform of Liberia’s system of national roads maintenance by strengthening the capacity of key institutions in road data collection, road asset management, and maintenance planning. An early condition for the funding of the Roads Project was the passage of a National Road Fund Act, which provided for a dedicated national fund for road maintenance, and the Axle Load Control Law, which set weight limits on trucks operating on the nation’s roads. |
| Preliminary and Expected Outputs | Energy Project
|
| Preliminary and Expected Outcomes | Energy Project
Raw Water Pipeline Sub Activity
Roads Project Short-Term Outcomes
Medium & Long-Term Outcomes
|
| Evaluations | Energy Project MCC commissioned an independent performance evaluation of the Energy Project, which will cover the following: the Mt. Coffee Hydropower Plant Rehabilitation Activity, the Energy Sector Reform Activity, the Training Activity, and the Raw Water Pipeline sub-activity. The pre-post evaluation of the Mt. Coffee Hydropower Plant Rehabilitation and Energy Sector Reform Activities will look at outcomes at the grid level, energy sector level, utility level, and end users. Preliminary findings from these activities were published in September 2020. The design report and baseline/interim report for this evaluation can be found in MCC’s evaluation catalog. Interim findings for this evaluation will be available in 2022 and final evaluation results will be published in 2025. The Training Center and Raw Water Pipeline evaluations will employ an ex-post evaluation methodology, and evaluation findings will be available in early 2022. Roads Project MCC commissioned a pre-post independent performance evaluation of the Roads Project. This evaluation will principally look at outcomes related to project implementation and the new road maintenance regime, with the possibility of measuring road-usage patterns and transportation market structure if certain targets are met. Engineering analysis and economic modeling will be done as part of an Evaluation Economic Rate of Return as part of the final report, expected no later than 2024. The design report for this evaluation can be found in MCC’s evaluation catalog. |
Sierra Leone Threshold Program
| Overview | MCC and the Government of Sierra Leone signed a $44.4 million threshold program on November 17, 2015 with the primary goal of strengthening the Government’s capacity to effectively deliver sustainable water and electricity services, with a focus on the greater Freetown area. All program activities ended March 31, 2021, with an administrative closeout period running through July 2021. The $8.3 million Regulatory Strengthening Project was designed to reinforce the Electricity and Water Regulatory Commission’s role in governance and oversight of the electricity and water sectors to improve sector transparency, establish performance monitoring standards, and improve consumer engagement. The $15.7 million Water Sector Reform Project was designed to improve sector coordination, commercial practices, operational capacity, planning abilities, and customer service at the utility, the Guma Valley Water Company (GVWC). As part of the project, MCC supported the development of a sector roadmap that will inform future investments across Sierra Leone’s water infrastructure and the establishment of two controlled district metering areas. The $12.1 million Electricity Sector Reform Project was designed to support operationalizing an institutional framework and market structure for Sierra Leone’s electricity sector. |
|---|---|
| Preliminary and Expected Outputs | Regulatory Strengthening Project (RSP)
Water Sector Reform Project (WSRP)
Electricity Sector Reform Project (ESRP)
|
| Preliminary and Expected Outcomes | Operationalized and increased core capacities at the Electricity and Water Regulatory Commission to ensure transparency, support the long-term financial sustainability of the water and electricity sectors, and improve overarching sector governance. Improved coordination in the water sector, strengthened commercial practices, operational independence, and planning capacity at GVWC, and enhanced transparency, accountability and customer service practices in order to improve financial viability, operational efficiency and customer satisfaction with water service. Improved financial viability of the electricity sector by operationalizing the emerging institutional framework and market structure in Sierra Leone’s electricity sector, improving integrated planning capacity, and strengthening operational efficiency and corporate governance at targeted electricity sector institutions. |
| Evaluations | MCC has commissioned an independent evaluation of the threshold program which will assess the results of the RSP, WSRP and ESRP. There will not be a separate evaluation report for the RSP given that the project is linked to the program logics for the WSRP and the ESRP and integrated into those evaluations. While there is no baseline report, the interim evaluation report is expected later in 2021 and an endline report in 2023. Water Sector Reform Project The evaluation of the WSRP will examine the implementation of the project and assess the achievement of expected outcomes, namely the improved operational efficiency and financial viability of GVWC and the increased satisfaction of customers with the water service provide by GVWC. Results will be assessed through a performance evaluation of the Sector Coordination and Institutional Strengthening activities and related Regulatory Reform Project activities. The evaluation of the District Metering Area activity will include a performance as well as an impact evaluation (through a time series analysis of system level administrative, metering and customer billing data). In addition, household surveys and focus groups will be conducted in the areas targeted by the water project. The evaluation design report can be found in MCC’s evaluation catalog. Electricity Sector Reform Project A performance evaluation will be conducted of the ESRP to assess the extent to which the project has had an impact on the strategic planning and business operations of the institutions and utilities as well as the financial viability and sustainability of transformations initiated for these entities. Data collection will include key informant interviews, process mapping, and administrative data. The evaluation design report can be found in MCC’s evaluation catalog. |
Compact Modifications
MCC employs a risk-based approach to the management of its portfolio and uses a number of mechanisms to manage projects that face potential major modifications, including the following:
- Quarterly portfolio reviews of all compacts, with a focus on high-risk projects and activities;
- Early identification of high-risk projects;
- Close collaboration with partner countries to develop plans to prevent, mitigate and manage project restructuring; and
- Approval of modifications at the appropriate level.
MCC also conducts due diligence on programs in advance of compact signing to increase the reliability of technical, cost, and other estimates. During compact development, MCC makes project design modifications to mitigate potential completion risk, currency fluctuations and the potential for construction cost overruns.
| Project/Activity | Programmatic Change | Description | |
|---|---|---|---|
| Benin | Electricity Distribution Project/Grid Strengthening Activities | $32.31 million increase to the Cotonou and Regional Grid Strengthening Activities, with funding drawn from each compact project, M&E, and Program Administration. | This increase provided funding for a critical works contract for the construction and rehabilitation of high-voltage substations that exceeded its previously budgeted amount as well as contingency funding. |
| Niger | Irrigation and Market Access Project / Irrigation Activity | Reallocate $29.1 million from the Ouna Kouanza and Sia construction budget to other components of the Irrigation and Market Access Project | Replace the development of Ouna-Kouanza (zones 4, 5, 6 and 7) and Sia (lower terrace) large-scale perimeters with the development of 640 hectares of small-scale irrigation in the Sia (lower terrace) area. Allow MCA-Niger to initiate identification of a small scale-irrigation component that will meet MCC investment criteria with the balance of the funds previously allocated to the construction budget for the Ouna Kouanza and Sia Perimeters. |
| Ghana | MCC is seeking an extension to the overall compact term to June 6, 2022 and an increase of $8,225,250 in total funding due to the impacts of COVID-19. The amended compact memorializing the extension request is planned to be completed and signed by June 2021. |
Projected Beneficiaries and Income Benefits by Compact
Under MCC's results framework, beneficiaries are defined as an individual and all members of his or her household who will experience an income gain as a result of MCC’s interventions. MCC considers that the entire household will benefit from the income gain and counts are multiplied by the average household size in the area or country. The beneficiary standard makes a distinction between individuals participating in a project and individuals expected to increase their income as a result of the project. Before signing a compact, MCC estimates the expected long-term income gains through a rigorous benefit-cost analysis. MCC may reassess and modify its beneficiary estimates and/or the present value of benefits when project designs change during implementation.
| Compact | Estimated Number of Beneficiaries | Estimated Net Benefits over the Life of the Project (Present Value)3 |
|---|---|---|
| Armenia | 428,000 | $150,400,000 |
| Benin | 14,059,000 | $140,400,000 |
| Benin II | 1,969,000 | $24,800,000 |
| Burkina Faso | 1,181,000 | ($123,300,000) |
| Cabo Verde I | 385,000 | $84,600,000 |
| Cabo Verde II | 604,000 | $72,000,000 |
| El Salvador | 706,000 | $262,100,000 |
| El Salvador II | 6,446,000 | N/A |
| Georgia | 143,000 | $166,000,000 |
| Georgia II | 1,770,000 | $18,200,000 |
| Ghana | 1,217,000 | $520,400,000 |
| Honduras | 1,705,000 | $252,500,000 |
| Indonesia | 1,700,000 | $5,500,000 |
| Jordan | 3,000,000 | $89,300,000 |
| Lesotho | 1,041,000 | $75,500,000 |
| Liberia | 528,000 | $8,000,000 |
| Madagascar | 480,000 | $46,800,000 |
| Malawi | 983,000 | $234,100,000 |
| Mali | 2,837,000 | $136,300,000 |
| Moldova | 414,000 | ($66,700,000) |
| Mongolia | 2,058,000 | $54,500,000 |
| Morocco | 1,695,000 | $610,200,000 |
| Morocco II | 828,000 | N/A |
| Mozambique | 2,685,000 | $120,900,000 |
| Namibia | 1,063,000 | $133,800,000 |
| Nicaragua | 119,000 | $11,500,000 |
| Niger | 3,888,000 | $238,700,000 |
| Philippines | 125,822,000 | $159,700,000 |
| Senegal | 1,550,000 | $110,600,000 |
| Tanzania | 5,425,000 | $775,400,000 |
| Vanuatu | 39,000 | N/A |
| Zambia | 1,200,000 | $62,200,000 |
| Total for All Compacts | 187,966,000 | $4,314,926,000 |
Notes:
1. The table includes estimates for compacts that have entered into force and have economic rates of return (ERRs) from which income benefit calculations can be drawn. The Ghana II compact does not yet have published ERRs.
2. These estimates do not include the projected beneficiaries of projects or activities that have been terminated or suspended by MCC (Madagascar, Honduras, Nicaragua, Mongolia, and Armenia). In the case of Madagascar, the estimates account for the compact's early termination.
3. The Present Value (PV) of Benefits is the sum of all projected benefits accruing over the life of the project, typically 20 years, evaluated at a 10 percent discount rate. Estimates are reported in millions of dollars in the year that the ERR analysis was completed. Because the PV of benefits uses a discount rate, these figures cannot be compared directly to the undiscounted financial costs of MCC compacts but must be compared to the PV of costs instead.
4. Indonesia entries are currently available for only one of three projects. Liberia entries are currently available only for the energy project. Benin II entries are unavailable for the off-grid clean energy facility.
Column totals may not equal the sum of the individual rows due to rounding.
Evaluation-Based Economic Rates of Return
All MCC projects are independently evaluated, and these independent evaluations often include evaluation-based economic rates of return (ERRs). Independently calculated ERRs complement the closeout ERRs that MCC calculates at the end of the compact. Because independent evaluations occur two to five years after compact closure, evaluation-based ERRs offer an updated assessment of a project’s costs and benefits post-compact. These ERRs still rely on forecasts for the later portion of MCC’s cost-benefit analysis evaluation horizon, which spans 20 years. Nonetheless, independent evaluation-based ERRs complete the accountability loop in a way that is rare among donors. Two examples are below; MCC expects to have completed 25 evaluation-based ERRs by the end of FY 2021.[[Evaluation-based ERRs are reported in MCC’s Evaluation Briefs, available at: https://www.mcc.gov/our-impact/evaluation-briefs]]
Results of the Mozambique Farmer Income Support Project
MCC’s Farmer Income Support Project (FISP) was designed to reduce damage to the incomes of 1.7 million Mozambican farmers due to Coconut Lethal Yellowing Disease (CLYD). This was to be accomplished through (i) short-term surveillance, control, and mitigation services, prompt eradication of diseased palms, and replanting with the less susceptible Mozambican Green Tall coconut variety; and (ii) technical advisory services to introduce crop-diversification options. Given forecast benefits to farmers’ incomes and the costs of the program, MCC originally forecast a project ERR of 25.1 percent.
An independent evaluation of the FISP’s impacts found that cutting trees and burning tree stumps in epidemic areas did reduce CLYD prevalence, but not to the degree originally forecast, resulting in lower than expected productivity impacts. Likewise, endemic area alternative crop uptake was lower than expected, likely due to insufficient input and output market linkages. The resulting updated, evaluation-based ERR estimate was 16.8 percent. Greater detail on the evaluation and lessons learned are available in MCC’s public evaluation catalog.[[https://data.MCC.gov/evaluations/index.php/catalog]]
Results of the Nicaragua Transportation Project
MCC’s Nicaragua Transportation Project was designed to stimulate economic development and improve access to markets and social services by reducing transportation costs. It upgraded and rehabilitated 68 km of roads, consisting of two secondary roads and a trunk road. MCC originally forecast an ERR of 13.2 percent from the project based on reduced vehicle operating costs and travel time savings for road users, including new users expected to travel on the road due to improved road conditions resulting from the project.
The independent evaluation of this project estimated actual impacts using data from two years after the roads were completed. It found that road roughness, a key indicator of transport costs, decreased 80 percent on average, and traffic increased 12 percent on average over the two years to 3,062 vehicles per day.
At the same time, the capital costs for the road works came in on average 2.2 times higher than those estimated prior to implementation. Given this balance of measured benefits and costs, the resulting evaluation-based ERR fell to 2.1 percent, primarily due to these higher costs. Benefits were roughly consistent with ex-ante estimates. Greater detail on the evaluation and lessons learned are available in MCC’s public evaluation catalog,[[https://data.MCC.gov/evaluations/index.php/catalog]] and MCC’s Principles into Practice: Lessons from MCC’s Investments in Roads.[[https://www.MCC.gov/our-impact/principles-into-practice]]
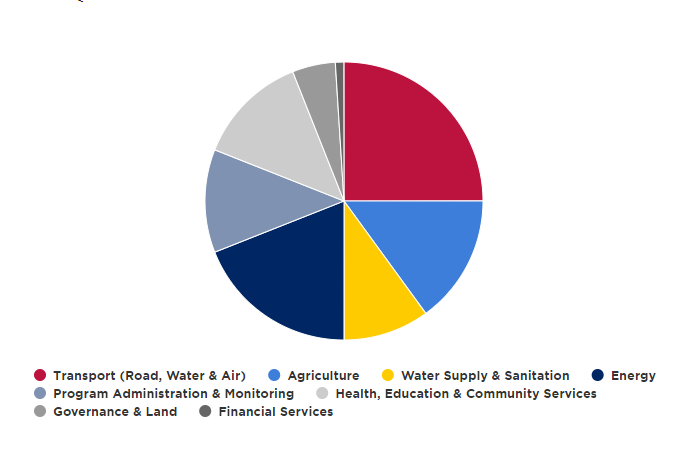
Compact Funding by Sector
As of First Quarter FY 2021
Results by Sector
As of First Quarter FY 2021
| Sector | Indicator | Total Portfolio Actuals | Data points | Active and Completed Countries Tracked |
|---|---|---|---|---|
| Indicators listed are MCC's common indicators, which are selected to aggregate sector results across countries. | Cumulative value for the indicator for both closed and active compacts (2005-present). | Number of compacts with available data | Underlined text indicates compacts that are still active. | |
| ROADS | Temporary employment generated in road construction | 52,472 | 7 | Armenia, Burkina Faso, Cabo Verde, Côte d’Ivoire, El Salvador, El Salvador II, Georgia, Ghana, Honduras, Liberia, Mali, Moldova, Mongolia, Mozambique, Nicaragua, Niger, Philippines, Senegal, Tanzania, Vanuatu |
| Kilometers of roads completed | 3,035 | 15 | ||
| AGRICULTURE & IRRIGATION | Farmers trained | 405,482 | 15 | Armenia, Burkina Faso, Cabo Verde, El Salvador, Georgia, Ghana, Honduras, Indonesia, Madagascar, Mali, Moldova, Morocco, Morocco II, Mozambique, Namibia, Nicaragua, Niger, Senegal |
| Farmers who have applied improved practices as a result of training | 126,693 | 11 | ||
| Hectares under improved irrigation | 203,963 | 8 | ||
| Value of agricultural and rural loans | $87,074,694 | 9 | ||
| WATER & SANITATION | Temporary employment generated in water and sanitation construction | 21,776 | 6 | Cabo Verde II, El Salvador, Georgia, Ghana, Jordan, Lesotho, Mozambique, Tanzania, Zambia |
| People trained in hygiene and sanitary best practices | 12,386 | 6 | ||
| Water points constructed | 1,191 | 4 | ||
| EDUCATION | Students participating | 291,144 | 8 | Burkina Faso, Côte d’Ivoire, El Salvador, El Salvador II, Georgia II, Ghana, Mongolia, Morocco, Morocco II, Namibia |
| Facilities completed | 844 | 7 | ||
| Graduates from MCC-supported education activities | 62,938 | 6 | ||
| LAND | Legal and regulatory reforms adopted | 135 | 8 | Benin, Burkina Faso, Cabo Verde II, Ghana, Indonesia, Lesotho, Madagascar, Mali, Morocco II, Mongolia, Mozambique, Namibia, Nicaragua, Niger, Senegal |
| Stakeholders trained | 78,064 | 12 | ||
| Land administration offices established or upgraded | 399 | 8 | ||
| Parcels corrected or incorporated in land system | 352,975 | 8 | ||
| Land rights formalized | 320,722 | 7 | ||
| POWER | Kilometers of lines completed | 5,467 | 7 | Benin II, El Salvador, Georgia, Ghana, Ghana II, Indonesia, Liberia, Malawi, Mongolia, Tanzania |
Common Indicators
As of First Quarter FY 2021
Agriculture & Irrigation Common Indicators
| Agriculture & Irrigation Process Indicators | |||||||
|---|---|---|---|---|---|---|---|
| Agriculture & Irrigation Common Indicators | (AI-1) Value of signed irrigation feasibility and design contracts | (AI-2.1) Amount Disbursed | (AI-2) Percent disbursed of irrigation feasibility and design contracts | (AI-3) Value of signed irrigation construction contracts | (AI-4.1) Amount Disbursed | (AI-4) Percent disbursed of irrigation construction contracts | (AI-5)Temporary employment generated in irrigation |
| Unit | USD | Percentage | USD | Percentage | Number | ||
| Classification | Cumulative | Level | Cumulative | Level | Cumulative | ||
| MCC Total | 56,327,910.69 | 48,141,668.98 | 85% | 729,022,019 | 635,387,639 | 87% | 7,160 |
| Gender | 4,771 | ||||||
| Female | 252 | ||||||
| Male | 4,519 | ||||||
| Country | |||||||
| Armenia | 4,601,073.00 | 4,601,073.00 | 100% | 106,653,443 | 106,653,443 | 100% | 2,389 |
| El Salvador | |||||||
| El Salvador II | X | X | X | X | X | X | X |
| Georgia | 1,155,881.00 | 617,380.00 | 53% | X | X | X | X |
| Honduras | X | - | X | X | X | X | X |
| Indonesia | X | - | X | X | X | X | X |
| Moldova | 4,929,620.01 | 4,719,796.00 | 96% | 84,239,288 | 61,489,674 | 73% | 586 |
| Nicaragua | 0.00 | 0.00 | X | X | X | X | X |
| Burkina Faso | 17,268,474.00 | 12,910,517.60 | 75% | 74,339,448 | 70,862,959 | 95% | 2,414 |
| Cabo Verde I | X | - | X | 5,167,848 | 5,043,885 | 98% | X |
| Ghana | 5,202,887.00 | 5,202,887.00 | 100% | 13,009,963 | 13,009,963 | 100% | X |
| Madagascar | X | - | X | X | X | X | X |
| Mali | 9,077,220.00 | 8,916,457.06 | 98% | 148,951,503 | 146,354,137 | 98% | X |
| Morocco | X | - | X | 111,353,027 | 110,239,497 | 99% | X |
| Mozambique | X | - | X | X | X | X | X |
| Namibia | X | - | X | X | X | X | X |
| Niger | 4,402,582.39 | 2,811,590.61 | 64% | $30,596,850 | $5,648,417 | 18% | 252 |
| Senegal | 9,690,173.29 | 8,361,967.71 | 86% | 154,710,649 | 116,085,665 | 75% | 1,519 |
Agriculture and Irrigation Common Indicator Definitions:
(AI-1) Value of signed irrigation feasibility and design contracts: The value of all signed feasibility, design, and environmental contracts, including resettlement action plans, for agricultural irrigation investments using 609(g) and compact funds.
(AI-2) Percent disbursed of irrigation feasibility and design contracts: The total amount of all signed feasibility, design, and environmental contracts, including resettlement action plans, for agricultural irrigation investments disbursed divided by the total value of all signed contracts.
(AI-3) Value of signed irrigation construction contracts: The value of all signed construction contracts for agricultural irrigation investments using compact funds.
(AI-4) Percent disbursed of irrigation construction contracts: The total amount of all signed construction contracts for agricultural irrigation investments disbursed divided by the total value of all signed contracts.
(AI-5) Temporary employment generated in irrigation: The number of people temporarily employed or contracted by MCA-contracted construction companies to work on construction of irrigation systems.
| Agriculture & Irrigation Output Indicators | Agriculture & Irrigation Outcome Indicators | ||||||
|---|---|---|---|---|---|---|---|
| (AI-6) Farmers trained | (AI-7) Enterprises assisted | (AI-8) Hectares under improved irrigation | (AI-9) Loan borrowers | (AI-10) Value of agricultural and rural loans | (AI-11) Farmers who have applied improved practices as a result of training | (AI-12) Hectares under improved practices as a result of training | (AI-13) Enterprises that have applied improved techniques |
| Number | Number | Hectares | Number | USD | Number | Hectares | Number |
| Cumulative | Cumulative | Cumulative | Cumulative | Cumulative | Cumulative | Cumulative | Cumulative |
| 405,482 | 4,224 | 203,963 | 1,195 | 87,074,694.40 | 126,693 | 42,252 | 1,016 |
| 299,368 | 520 | 1,187 | 14,504,981.00 | 57,838 | 105 | ||
| 92,542 | 107 | 121 | 924,102.00 | 17,660 | 20 | ||
| 206,826 | 413 | 1,066 | 13,580,879.00 | 40,178 | 85 | ||
| 45,639 | 227 | 1,008 | 13,133,200.00 | 26,424 | X | 178 | |
| 15,363 | 281 | 29 | 4,598,748.00 | 11,520 | X | 163 | |
| X | 1 | X | X | X | X | X | X |
| X | 291 | X | X | 19,880,003.00 | X | X | X |
| 7,265 | 464 | 400 | X | 17,100,000.00 | 6,996 | X | X |
| 129,142 | X | X | X | X | X | X | X |
| 6,569 | 334 | 11,526 | 62 | 11,702,981.00 | 2,452 | 7,279 | 77 |
| 9,104 | X | X | X | X | 9,104 | X | X |
| 12,307 | 278 | 2,240 | 96 | 2,802,000.00 | 8,237 | 3,369 | 28 |
| 553 | X | 13 | X | 617,000.00 | 106 | X | X |
| 66,930 | 1,724 | 514 | X | 16,740,762.40 | 59,060 | X | 535 |
| 31,366 | 324 | X | X | X | 1,892 | X | 1 |
| 1,308 | X | 97,503 | X | 500,000.00 | 801 | X | X |
| 40,863 | 114 | 53,376 | X | X | X | 31,578 | 34 |
| 28,830 | 186 | X | X | X | X | X | X |
| 9,238 | X | X | X | X | X | X | X |
| 1,005 | X | - | X | X | 101 | 26 | X |
| X | X | 38,391 | X | X | X | X | X |
Agriculture and Irrigation Common Indicator Definitions (cont.):
(AI-6) Farmers trained: The number of primary sector producers (farmers, ranchers, fishermen, and other primary sector producers) receiving technical assistance or participating in a training session (on improved production techniques and technologies, including post-harvest interventions, developing business, financial, or marketing planning, accessing credit or finance, or accessing input and output markets).
(AI-7) Enterprises assisted: The number of enterprises; producer, processing, and marketing organizations; water users associations; trade and business associations; and community-based organizations receiving assistance.
(AI-8) Hectares under improved irrigation: The number of hectares served by existing or new irrigation infrastructure that are either rehabilitated or constructed with MCC funding.
(AI-9) Loan borrowers: The number of borrowers (primary sector producers, rural entrepreneurs, and associations) who access loans for on-farm, off-farm, and rural investment through MCC financial assistance.
(AI-10) Value of agricultural and rural loans: The value of agricultural loans and rural loans disbursed for on-farm, off-farm, and rural investments.
(AI-11) Farmers who have applied improved practices as a result of training: The number of primary sector producers (farmers, ranchers, fishermen, and other primary sector producers) that are applying new production or managerial techniques introduced or supported by MCC training or technical assistance, such as input use, production techniques, irrigation practices, post-harvest treatment, farm management techniques, or marketing strategies.
(AI-12) Hectares under improved practices as a result of training: The number of hectares on which farmers are applying new production or managerial techniques introduced or supported by MCC, such as input use, production techniques, irrigation practices, post-harvest treatment, farm management techniques, or marketing strategies.
(AI-13) Enterprises that have applied improved techniques: The number of rural enterprises; producer, processing, and marketing organizations; water users associations; trade and business associations; and community-based organizations that are applying managerial or processing techniques introduced or supported by MCC.
Education Common Indicators
| Education Process Indicators | Education Output Indicators | Education Outcome Indicators | |||||||
|---|---|---|---|---|---|---|---|---|---|
| (E-1) Value of signed educational facility construction, rehabilitation, and equipping contracts (USD) | Amount Disbursed (E-2.1) | (E-2) Percent disbursed of educational facility construction, rehabilitation, and equipping contracts | (E-3) Legal, financial, and policy reforms adopted | (E-4) Educational facilities constructed or rehabilitated | (E-5) Instructors trained | (E-6) Students participating in MCC-supported education activities | (E-7) Graduates from MCC-supported education activities | (E-8) Employed graduates of MCC-supported education activities | |
| Unit | US Dollars | US Dollars | Number | Number | Number | Number | Number | Number | |
| Classification | Level | Level | Level | Cumulative | Cumulative | Cumulative | Cumulative | Cumulative | |
| MCC Total | $304,283,400 | $271,777,895 | 89% | 15 | 844 | 10,670 | 291,144 | 62,938 | 0 |
| Gender* | 10,670 | 212,469 | 58,230 | ||||||
| Female | 6,202 | 108,596 | 37,091 | ||||||
| Male | 4,468 | 103,873 | 21,139 | ||||||
| Country | |||||||||
| Burkina Faso | $22,758,211 | $22,736,023 | 100% | X | 396 | 557 | 31,065 | 4,035 | X |
| Cote d'Ivoire* | - | - | - | 2 | - | - | - | - | - |
| El Salvador I | $9,857,585 | $9,839,371 | 100% | X | 22 | 378 | 30,672 | 4,285 | X |
| El Salvador II | $59,449,148 | $48,692,482 | 82% | 7 | 7 | 5,709 | 73,407 | - | - |
| Georgia II | $42,742,227 | $41,365,549 | 97% | X | 91 | 604 | 2,577 | 727 | X |
| Ghana | $18,689,747 | $18,689,747 | 100% | X | 250 | - | 41,019 | X | X |
| Mongolia | $28,179,328 | $27,490,984 | 98% | 5 | 18 | 1,370 | 17,480 | 11,967 | X |
| Morocco | $4,568,837 | $3,480,627 | 76% | X | X | 2,052 | 93,424 | 41,383 | X |
| Morocco II | $21,748,018 | $3,922,534 | 18% | 1 | - | - | X | - | X |
| Namibia | $96,290,298 | $95,560,578 | 99% | X | 60 | X | 1,500 | 541 | X |
‡ All MCC education programs have as their long-term end goal an increase in individual or household income and a corresponding decrease in poverty.
Education Common Indicator Definitions
(E-1) Value of signed educational facility construction, rehabilitation, and equipping contracts: The value of all signed construction contracts for educational facility construction, rehabilitation, or equipping (e.g., information technology, desks and chairs, electricity and lighting, water systems, latrines) using compact funds.
(E-2) Percent disbursed of educational facility construction, rehabilitation, and equipping contracts: The total amount of all signed construction contracts for education facility works or equipping divided by the total value of all signed contracts.
(E-3) Legal, financial, and policy reforms adopted: The number of reforms adopted by the public sector attributable to compact support that increase the education sector’s capacity to improve access, quality, and/or relevance of education at any level, from primary to post-secondary.
(E-4) Educational facilities constructed or rehabilitated: The number of educational facilities constructed or rehabilitated according to standards stipulated in MCA contracts signed with implementers.
(E-5) Instructors trained: The number of classroom instructors who complete MCC-supported training focused on instructional quality as defined by the compact training activity.
(E-6) Students participating in MCC-supported education activities: The number of students enrolled or participating in MCC-supported educational schooling programs.
(E-7) Graduates from MCC-supported education activities: The number of students graduating from the highest grade (year) for that educational level in MCC-supported education schooling programs.
(E-8) Employed graduates of MCC-supported education activities: The number of MCC-supported training program graduates employed in their field of study within one year after graduation.
Land Common Indicators
| Land Output Indicators | ||||||
|---|---|---|---|---|---|---|
| (L-1) Legal and regulatory reforms adopted | (L-2) Land administration offices established or upgraded | (L-3) Stakeholders trained | (L-4) Conflicts successfully mediated | (L-5) Parcels corrected or incorporated in land system | (L-6) Land rights formalized | |
| Unit | Number | Number | Number | Number | Parcels | Number |
| Classification | Cumulative | Cumulative | Cumulative | Cumulative | Cumulative | Cumulative |
| MCC Total | 135 | 399 | 78,064 | 12,484 | 352,975 | 320,722 |
| Gender | 76,629.00 | 159,878 | ||||
| Female | 21,747 | 54,903 | ||||
| Male | 54,882 | 85,400 | ||||
| Joint | 19,575 | |||||
| Location | 299,679.00 | 280,725 | ||||
| Urban | 200,922 | 156,232 | ||||
| Rural | 98,757 | 124,493 | ||||
| Country | ||||||
| Benin | X | X | 50 | X | X | X |
| Burkina Faso | 54 | 78 | 61,057 | 1,364 | 18,490 | 4,793 |
| Cabo Verde II | 36 | 38 | 442 | 229 | 37,495 | 11,365 |
| Ghana | 4 | 3 | 427 | 23 | 1,481 | X |
| Indonesia | X | X | 4,463 | X | X | X |
| Lesotho | 11 | 1 | 575 | 151 | 53,296 | 19,325 |
| Madagascar | 4 | 237 | X | X | X | X |
| Mali | X | 1 | 1,354 | X | X | X |
| Mongolia | 6 | 15 | 3,920 | 10,639 | 18,336 | 20,672 |
| Morocco II | 1 | X | - | X | X | - |
| Mozambique | X | 26 | 1,516 | X | 205,005 | 251,556 |
| Namibia | 19 | X | 2,524 | X | 8,869 | 4,356 |
| Nicaragua | X | X | X | X | X | X |
| Niger | X | X | 96 | - | - | - |
| Senegal | X | X | 1,640 | 78 | 10,003 | 8,655 |
Land Common Indicator Definitions
(L-1) Legal and regulatory reforms adopted: The number of specific pieces of legislation or implementing regulations adopted by the compact country and attributable to compact support.
(L-2) Land administration offices established or upgraded: The number of land administration and service offices or other related facilities that the project physically establishes or upgrades.
(L-3) Stakeholders trained: The number of public officials, traditional authorities, project beneficiaries and representatives of the private sector, receiving formal on-the-job land training or technical assistance regarding registration, surveying, conflict resolution, land allocation, land use planning, land legislation, land management or new technologies.
(L-4) Conflicts successfully mediated: The number of disputed land and property rights cases that have been resolved by local authorities, contractors, mediators, or courts with compact support.
(L-5) Parcels corrected or incorporated in land system: The number of parcels with relevant parcel information corrected or newly incorporated into an official land information system (whether a system for the property registry, cadastre, or an integrated system).
(L-6) Land rights formalized: The number of household, commercial and other legal entities (e.g., NGOs, churches, hospitals) receiving formal recognition of ownership and/or use rights through certificates, titles, leases, or other recorded documentation by government institutions or traditional authorities at national or local levels.
(L-7) Percentage change in time for property transactions: The average percentage change in number of days for an individual or company to conduct a property transaction within the formal system.
(L-8) Percentage change in cost for property transactions: The average percentage change in dollars of out-of-pocket cost for an individual or company to conduct a property transaction within the formal system.
Power Common Indicators
| Power Process Indicators | |||||||
|---|---|---|---|---|---|---|---|
| (P-1) Value of signed power infrastructure feasibility and design contracts | (P-2.1 Amount Disbursed | (P-2) Percent disbursed of power infrastructure feasibility and design contracts | (P-3) Value of signed power infrastructure construction contracts | (P-4.1) Amount Disbursed | (P-4) Percent disbursed of power infrastructure construction contracts | (P-5) Temporary employment generated in power infrastructure construction | |
| Unit | USD | Percentage | USD | Percentage | Number | ||
| Classification | Cumulative | Level | Cumulative | Level | Cumulative | ||
| MCC Total | $93,857,178 | $74,085,610 | 79% | 877,274,243 | 529,192,590 | 60.3% | 8,819 |
| T&D | |||||||
| Transmission | |||||||
| Distribution | |||||||
| Gender | 4,776.00 | ||||||
| Female | 270 | ||||||
| Male | 4,506 | ||||||
| Grid | |||||||
| On-grid | |||||||
| Off-grid | |||||||
| Tariff class | |||||||
| Residential | |||||||
| Commercial | |||||||
| Industrial | |||||||
| Country | |||||||
| Benin II | $19,866,155.52 | 13,108,840.36 | 66% | 224,100,168.59 | 32,431,531.97 | 14% | X |
| El Salvador | X | X | X | X | X | X | |
| Georgia | X | X | X | X | X | X | |
| Ghana | X | - | X | X | X | X | X |
| Ghana II | 37,616,913.81 | 28,033,792.95 | 75% | 121,275,084.04 | 55,085,244.89 | 45% | 2,412 |
| Indonesia | X | X | X | X | X | X | X |
| Liberia | X | X | X | 144858722 | 144,858,722.00 | 100.0% | X |
| Malawi | $20,626,684 | $15,837,791 | 77% | 233,487,716 | 165,898,820 | 71.1% | 2,334 |
| Mongolia | X | X | X | X | X | X | X |
| Tanzania | $15,747,424 | $17,105,186 | 109% | 153,552,553 | 130,918,271 | 85.3% | 4,073 |
| Mainland | 8,400,178 | 8,867,662 | 98,637,310 | 80,903,553 | 3,957 | ||
| Morogoro | |||||||
| Tanga | |||||||
| Mbeya | |||||||
| Iringa | |||||||
| Dodoma | |||||||
| Mwanza | |||||||
| Kigoma | |||||||
| Kigoma Solar | 510,724 | 463,530 | 4,746,957 | 4,788,979 | 57 | ||
| Zanzibar | 6,836,522 | 7,773,994 | 50,168,285 | 45,225,739 | 59 | ||
Power Common Indicator Definitions
(P-1) Value of signed power infrastructure feasibility and design contracts: The value of all signed feasibility, design, and environmental impact assessment contracts, including resettlement action plans, for power infrastructure investments using 609(g) and compact funds.
(P-2) Percent disbursed of power infrastructure feasibility and design contracts: The total amount of all signed feasibility, design, and environmental impact assessment contracts, including resettlement action plans, for power infrastructure disbursed divided by the total current value of signed contracts.
(P-3) Value of signed power infrastructure construction contracts: The value of all signed construction contracts for power infrastructure investments using compact funds.
(P-4) Percent disbursed of power infrastructure construction contracts: The total amount of all signed construction contracts for power infrastructure investments disbursed divided by the total current value of all signed contracts.
(P-5) Temporary employment generated in power infrastructure construction: The number of people temporarily employed or contracted by MCA-contracted construction companies to work on construction of new power infrastructure or reconstruction, rehabilitation, or upgrading of existing power infrastructure.
(P-6) Generation capacity added: Generation capacity added, measured in megawatts, resulting from construction of new generating capacity or reconstruction, rehabilitation, or upgrading of existing generating capacity funded with MCC support.
(P-7) Kilometers of transmission lines upgraded or built: The sum of linear kilometers of new, reconstructed, rehabilitated, or upgraded transmission lines that have been energized, tested, and commissioned with MCC support.
(P-8) Transmission throughput capacity added: The increase in throughput capacity, measured in megawatts, added by new, reconstructed, rehabilitated, or upgraded transmission lines that have been energized, tested, and commissioned with MCC support.
(P-9) Transmission substation capacity added: The total added transmission substation capacity, measured in mega volt-amperes, that is energized, commissioned, and accompanied by a test report and supervising engineer’s certification resulting from new construction or refurbishment of existing substations that is due to MCC support.
(P-10) Kilometers of distribution lines upgraded or built: The sum of linear kilometers of new, reconstructed, rehabilitated, or upgraded distribution lines that have been energized, tested, and commissioned with MCC support.
(P-11) Distribution substation capacity added: The total added substation capacity, measured in mega volt amperes, that is energized, commissioned, and accompanied by a test report and supervising engineer’s certification resulting from new construction or refurbishment of existing substations supported by MCC.
(P-12) Customers added by project: The number of new customers that have gained access to a legal connection to electricity service from an electrical utility or service provider as a direct output of an MCC-funded project or intervention.
(P-13) Maintenance expenditure-asset value ratio: Actual maintenance expenditures / total value of fixed assets.
(P-14) Cost-reflective tariff regime: Average tariff per kilowatt-hour / long-run marginal cost per kilowatt-hour of electricity supplied to customers.
(P-15) Total electricity supply: Total electricity, in megawatt hours, produced or imported in a year.
(P-16) Power plant availability: Unweighted average across all power plants of the following: total number of hours per month that a plant is able and available to produce electricity / total number of hours in the same month.
(P-17) Installed generation capacity: Total generation capacity, in megawatts, installed plants can generate within the country.
(P-18) Transmission system technical losses: 1- [Total megawatt hours transmitted out from transmission substations / total megawatt hours received from generation to transmission substations]
(P-19) Distribution system losses: 1 – [Total megawatt hours billed / total megawatt hours received from transmission]
(P-20) Commercial losses: Total distribution system losses (P-19) minus distribution technical losses
(P-21) System Average Interruption Duration Index (SAIDI): Sum of durations, in customer-hours, of all customer interruptions in a quarter / total number of customers connected to network in the same quarter.
(P-22) System Average Interruption Frequency Index (SAIFI): Sum of customer-interruptions in a quarter / total number of customers connected to network in the same quarter.
(P-23) Total electricity sold: The total megawatt hours of electricity sales to all customer types.
(P-24) Operating cost-recovery ratio: Total revenue collected / total operating cost. Total operating cost is defined as operating expenses plus depreciation.
(P-25) Percentage of households connected to the national grid: Number of households that have access to a legal connection to electricity service from an electrical utility or service provider / total number of households in the country.
(P-26) Share of renewable energy in the country: Total installed generation capacity of on- or off-grid renewable energy, in megawatts / total installed generation capacity (P-17).
Transportation Common Indicators
| Process Indicators | Output Indicators | Outcome Indicator | |||||||||
|---|---|---|---|---|---|---|---|---|---|---|---|
| Transportation Common Indicators | (R-1) Value of signed road feasibility and design contracts | (R-2.1) Value disbursed of road feasibilty and design contracts | (R-2) Percent disbursed of road feasibility and design contracts | (R-3) Kilometers of roads under design | (R-4) Value of signed road construction contracts | (R-5.1) Value disbursed of roads construction contracts | (R-5) Percent disbursed of road construction contracts | (R-6) Kilometers of roads under works contracts | (R-7) Temporary employment generated in road construction | (R-8) Kilometers of roads completed | (R-11) Road traffic fatalities |
| Unit | USD | Percentage | Kilometers | USD | USD | Percentage | Kilometers | Number | Kilometers | Number | |
| Classification | Cumulative | Level | Cumulative | Cumulative | Cumulative | Level | Cumulative | Cumulative | Cumulative | Level | |
| MCC Total | $149,178,209 | $134,345,645 | 90% | 4,773 | $2,498,560,215 | $2,142,107,370 | 86% | 4,042.9 | 52,472 | 3035 | 655 |
| Gender* | 17,107 | 49 | |||||||||
| Female | 1,460 | 4 | |||||||||
| Male | 15,647 | 45 | |||||||||
| Road Type* | $115,356,798 | $101,231,984 | 88% | 4710 | $2,223,462,366 | $1,814,052,591 | 82% | 3,348.2 | 2734 | ||
| Primary | $82,645,410 | $70,906,112 | 86% | 2183 | $1,441,727,642 | $1,148,246,014 | 80% | 1,534.4 | 1178 | ||
| Secondary | $25,992,205 | $22,767,400 | 88% | 1591 | $617,229,323 | $526,845,893 | 85% | 1,132.9 | 479 | ||
| Tertiary | $6,719,183 | $7,558,472 | 112% | 935 | $164,505,401 | $138,960,684 | 84% | 681.0 | 1078 | ||
| Country | |||||||||||
| Armenia | X | - | X | X | X | X | X | 0.0 | X | 24 | X |
| Burkina Faso | $8,339,651 | $9,625,883 | 115% | 536 | $140,205,145 | $142,457,135 | 102% | 419.1 | 4,162 | 278 | 6 |
| Cape Verde I | $3,520,000 | $3,230,000 | 92% | 63 | $24,280,000 | $24,279,171 | 100% | 40.6 | X | 41 | X |
| Cote d'Ivoire* | $15,506,313 | $5,030,174 | 32% | 30 | - | - | - | - | - | - | - |
| El Salvador I | $18,321,410 | $18,048,524 | 99% | 223 | $248,378,825 | $240,211,648 | 97% | 223.0 | X | 223 | X |
| El Salvador II | X | X | X | 10 | $99,082,774 | $58,739,536 | 59% | 42.2 | 2,650 | X | X |
| Georgia | $11,980,000 | $11,868,449 | 99% | 0 | $197,299,030 | $197,299,030 | 100% | 220.2 | X | 220 | X |
| Ghana | $5,549,044 | $5,549,044 | 100% | 943 | $250,604,022 | $250,604,022 | 100% | 446.4 | 35,455 | 445 | 602 |
| Honduras | $9,500,000 | $7,163,000 | 75% | 673 | $179,400,000 | $128,412,000 | 72% | 673.0 | X | 610 | X |
| Liberia | X | X | X | X | X | X | X | X | X | X | X |
| Mali | $0 | $0 | X | X | $42,918,038 | $15,018,313 | 35% | 81.0 | X | 79 | X |
| Moldova | X | - | X | 96 | $100,807,443 | $97,020,289 | 96% | 96.0 | 1,309 | 96 | 4 |
| Mongolia | $6,083,650 | $5,421,254 | 89% | 19 | $73,108,907 | $66,492,533 | 91% | 176.4 | X | 176 | X |
| Mozambique* | $17,669,992 | $15,049,358 | 85% | 253 | $132,240,557 | $116,601,108 | 88% | 253.0 | 2,308 | 253 | X |
| Nicaragua | $0 | $0 | X | 376 | $56,507,526 | $56,507,526 | 100% | 74.0 | X | 74 | X |
| Niger | $3,172,736 | $3,091,229 | 97% | 300 | $53,518,819 | - | - | 83.0 | - | - | X |
| Philippines | $15,235,623 | $14,391,002 | 94% | 222 | $173,156,531 | $139,529,147 | 81% | 222.0 | X | 175 | 0 |
| Senegal | $12,201,371 | $12,444,412 | 102% | 406 | $271,128,882 | $189,227,036 | 70% | 375.0 | 2,757 | X | 43 |
| Tanzania | $19,143,331 | $20,478,228 | 107% | 473 | $399,926,666 | $363,711,825 | 91% | 468.3 | 3,831 | 190 | 0 |
| Vanuatu | $2,955,088 | $2,955,088 | 100% | 150 | $55,997,051 | $55,997,051 | 100% | 149.7 | X | 150 | X |
*Kilometers of road for Mozambique require verification through takeover certificates. However, takeover certificates were never provided and the number reported is not verified.
** According to the Common Indicator definition, a road is completed when official certificates are handed over and approved. In Senegal, this was taken to mean final acceptance of the road works, which typically happens after the end of the 1 year defects liability period which starts when the construction is completed and the roads are provisionally accepted. As part of its Compact, Senegal intended to rehabilitate 372 kilometers of national roads. By September 2015, when the Senegal Compact closed, no roads had achieved final acceptance, and therefore were not officially completed, per the common indicator definition. However, by the end of the Compact, 185km of roads had been fully rehabilitated and had received provisional acceptance. An additional 72km were provisionally accepted in November 2015, and the remaining 116km are anticipated to be provisionally accepted with the support of the Government of Senegal by mid-2016.
Transportation Common Indicator Definitions
(R-1) Value of signed road feasibility and design contracts: The value of all signed feasibility, design, and environmental contracts, including resettlement action plans, for road investments using 609(g) and compact funds.
(R-2.1) Value disbursed of road feasibility and design contracts: The value disbursed of all signed feasibility, design, and environmental contracts, including resettlement action plans, for road investments using 609(g) and compact funds.
(R-2) Percent disbursed of road feasibility and design contracts: The total amount of all signed feasibility, design, and environmental contracts, including resettlement action plans, for road investments disbursed divided by the total value of all signed contracts.
(R-3) Kilometers of roads under design: The length of roads in kilometers under design contracts. This includes designs for building new roads and reconstructing, rehabilitating, resurfacing, or upgrading existing roads.
(R-4) Value of signed road construction contracts: The value of all signed construction contracts for new roads or reconstruction, rehabilitation, resurfacing, or upgrading of existing roads using compact funds.
(R-5.1) Value disbursed of roads construction contracts: The value disbursed of all signed construction contracts for new roads or reconstruction, rehabilitation, resurfacing, or upgrading of existing roads.
(R-5) Percent disbursed of road construction contracts: The total amount of all signed construction contracts for new roads or reconstruction, rehabilitation, resurfacing, or upgrading of existing roads disbursed divided by the total value of all signed contracts.
(R-6) Kilometers of roads under works contracts: The length of roads in kilometers under works contracts for construction of new roads or reconstruction, rehabilitation, resurfacing, or upgrading of existing roads.
(R-7) Temporary employment generated in road construction: The number of people temporarily employed or contracted by MCA-contracted construction companies to work on construction of new roads or reconstruction, rehabilitation, resurfacing, or upgrading of existing roads.
(R-8) Kilometers of roads completed: The length of roads in kilometers on which construction of new roads or reconstruction, rehabilitation, resurfacing, or upgrading of existing roads is complete (certificates handed over and approved).
(R-9) Roughness: The measure of the roughness of the road surface, in meters of height per kilometer of distance traveled.
(R-10) Average annual daily traffic: The average number and type of vehicles per day, averaged over different times (day and night) and over different seasons to arrive at an annualized daily average.
(R-11) Road traffic fatalities: The number of road traffic fatalities per year on roads constructed, rehabilitated, or improved with MCC funding.
WASH Common Indicators
| WASH Process Indicators | WASH Output Indicators | WASH Output Indicators | |||||||||
|---|---|---|---|---|---|---|---|---|---|---|---|
| (WS-1) Value of signed water and sanitation feasibility and design contracts (USD) | Amount Disbursed | (WS-2) Percent disbursed of water and sanitation feasibility and design contracts | (WS-3) Value of signed water and sanitation construction contracts (USD) | Amount Disbursed | (WS-4) Percent disbursed of water and sanitation construction contracts | (WS-5) Temporary employment generated in water and sanitation construction | (WS-6) People trained in hygiene and sanitary best practices | (WS-7) Water points constructed | Residential population connnected to sewer system* | Residential population* | |
| Unit | US Dollars | Percentage | USD | Percentage | Number | Number | Number | Number | Number | ||
| Classification | Cumulative | Level | Cumulative | Level | Cumulative | Cumulative | Cumulative | Cumulative | Cumulative | ||
| MCC Total | 54,337,691 | $53,735,311 | 98.9% | 816,963,219 | 763,548,856 | 93.5% | 21,776 | 12,386 | 1,191 | NA | NA |
| Gender | 9,862 | ||||||||||
| Female | 1,123 | - | |||||||||
| Male | 8,739 | - | |||||||||
| Country | |||||||||||
| Cabo Verde II | $783,369 | $733,263 | 93.6% | $19,315,569 | $18,827,292 | 97.5% | 759 | 32 | X | X | X |
| El Salvador | $4,983,800 | $4,785,175 | 96.0% | $10,451,448 | $10,188,837 | 97.5% | X | 2,406 | X | X | X |
| El Salvador II | X | X | X | X | X | X | X | X | - | X | X |
| Georgia | $266,865 | $266,865 | 100.0% | $54,315,000 | $51,178,716 | 94.2% | X | X | X | X | X |
| Ghana | $1,475,148 | $1,475,148 | 100.0% | $13,949,465 | $13,949,465 | 100.0% | X | 778 | 392 | X | X |
| Jordan | $0 | $0 | X | $238,732,246 | $238,486,447 | 100% | 3,825 | X | X | X | X |
| Lesotho | X | - | X | $59,733,645 | $47,189,579 | 79% | 11,527 | 454 | 175 | X | X |
| Mozambique | $35,076,009 | $34,753,498 | 99.1% | $169,500,497 | $148,359,134 | 87.5% | 2,276 | 8,400 | 614 | X | X |
| Tanzania | $6,861,280 | $7,008,600 | 102.1% | $45,403,796 | $36,801,560 | 81.1% | 387 | X | X | X | X |
| Zambia | $4,891,220 | $4,712,762 | 96.4% | $205,561,552 | $198,567,825 | 96.6% | 3,002 | 316 | 10 | X | X |
* This is a monitoring indicator; any change over baseline data represents the current trend and does not represent the direct impact of the MCC‐investment.
** Jordan's M&E Plan has, throughout the life of the compact, defined hours of supply as hours/week. As such all documentation is in this form. The value here has been divided by 7 here to accurately reflect supply hours per day.
***The current unit for volume of water produced has a discrepancy. MCC M&E is in the process of revising this common indicator to clarify and align with current industry standards.
WASH Common Indicator Definitions:
(WS-1) Value of signed water and sanitation feasibility and design contracts: The value of all signed feasibility, design, and environmental contracts, including resettlement action plans, for water and sanitation investments using 609(g) and compact funds.
(WS-2) Percent disbursed of water and sanitation feasibility and design contracts: The total amount of all signed feasibility, design, and environmental contracts, including resettlement action plans, for water and sanitation investments disbursed divided by the total value of all signed contracts.
(WS-3) Value of signed water and sanitation construction contracts: The value of all signed construction contracts for reconstruction, rehabilitation, or upgrading of water and sanitation works using compact funds.
(WS-4) Percent disbursed of water and sanitation construction contracts: The total amount of all signed construction contracts for construction, reconstruction, rehabilitation, or upgrading of water and sanitation works disbursed divided by the total value of all signed contracts.
(WS-5) Temporary employment generated in water and sanitation construction: The number of people temporarily employed or contracted by MCA-contracted construction companies to work on construction of water or sanitation systems.
(WS-6) People trained in hygiene and sanitary best practices: The number of people who have completed training on hygiene and sanitary practices that block the fecal-oral transmission route.
(WS-7) Water points constructed: The number of non-networked, stand-alone water supply systems constructed, such as: protected dug wells, tube-wells / boreholes, protected natural springs and rainwater harvesting / catchment system
(WS-8) Nonrevenue water: The difference between water supplied and water sold (i.e. volume of water “lost”) expressed as a percentage of water supplied.
(WS-9) Continuity of service: Average hours of service per day for water supply.
(WS-10) Operating cost coverage: Total annual operational revenues divided by total annual operating costs.
(WS-11) Volume of water produced: Total volume of water produced in cubic meters per day for the service area, i.e., leaving treatment works operated by the utility and purchased treated water, if any.
(WS-12) Access to improved water supply: The percentage of households in the MCC project area whose main source of drinking water is a private piped connection (into dwelling or yard), public tap/standpipe, tube-well, protected dug well, protected spring or rainwater.
(WS-13) Access to improved sanitation: The percentage of households in the MCC project area who get access to and use an improved sanitation facility such as flush toilet to a piped sewer system, flush toilet to a septic tank, flush or pour flush toilet to a pit, composting toilet, ventilated improved pit latrine or pit latrine with slab and cover.
(WS-14) Residential water consumption: The average water consumption in liters per person per day.
(WS-15) Industrial/Commercial water consumption: The average amount of commercial water consumed measured in cubic meters per month.
(WS-16) Incidence of diarrhea: The percentage of individuals reported as having diarrhea in the two weeks preceding the survey.
FY 2022 Corporate Goals/Priorities
For FY 2022, MCC’s new leadership is undertaking a review of MCC’s corporate goals and priorities, as reflected in the priorities identified in the Executive Summary—namely, climate change, inclusion and gender, and catalyzing private sector investment. This may also include additional priorities focused on MCC’s organizational health and business operations, as well as future opportunities to maximize MCC’s mission.
Under MCC’s previous leadership team, MCC established four specific goals for FY2021 that informed annual department and division goal setting (as well as individual performance plans):
- Human Capital: empower our people for optimal performance
MCC worked to develop a more comprehensive approach to human capital to better align MCC’s hiring practices, existing resources, and learning tools with the agency’s mission to ensure that MCC is appropriately staffed to achieve its strategic priorities and implement programs.
- Innovation: establish a culture of creativity that encourages smart risk
MCC made further progress on operationalizing the concurrent compact authority
- Private Investment: crowd-in and enable private investment
MCC developed a strategy to expand and deepen MCC’s blended finance capacity, portfolio, and leverage, and a partnerships strategy to increase impact, innovation, scale, and sustainability of MCC programs through partnerships
- Accountability: hold ourselves and partners accountable for results. MCC is continuing to make progress in each of these areas
MCC continued to intensify its focus on data and evidence-driven results. In FY21 MCC issued two Star Reports, public-facing narratives of MCC’s assistance for a country from selection through project evaluation, and 22 Evaluation Briefs, summaries of the key results and learning from MCC’s independent evaluations in a user-friendly, four-page packet.